US 500 Index
No trades
No trades
S&P500 Is it about to correct to 7000 minimum?The S&P500 index (SPX) has turned into a sideways consolidation for almost 2 months, putting a stop to the relentless 9 straight green weeks rally that preceded it. At the same time, the 1W RSI has been falling under Lower Highs pressure.
Every time we saw this RSI pattern since late 2021, the inde
Into The RealmLast time I wrote to you,
I shared my view that the US Stock Market,
as measured by the S+P 500, was about to enter a new price adjustment realm.
Volume has entered the market today, on the downside
with a gap down opening to awaken that realization
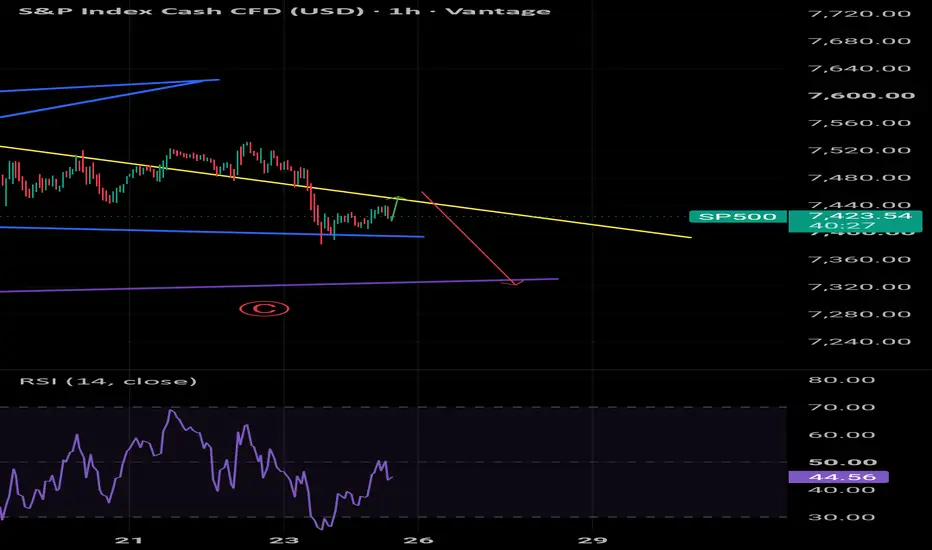
You must respect the move down below SPX 75
S&P 500 — When the Data Speaks and the Crowd Doesn't ListenThe Setup in One Paragraph
The US market is simultaneously carrying the second-highest valuation reading in 155 years of recorded history AND the calmest fear gauge in recent memory. CAPE at 41.37. VIX at 16.6. Those two numbers sitting together — in 20 years of weekly back-test data — have produce
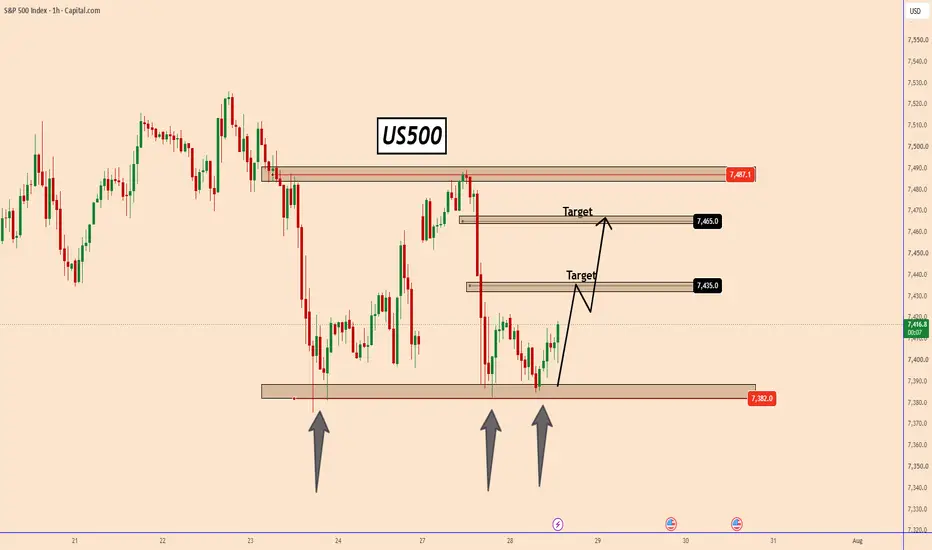
US500 Holds Key Support – Bulls Target Higher LevelsUS500 Holds Key Support – Bulls Target Higher Levels
US500 found strong support near 7380 and the price bounced back.
The indices stopped at this area several times in the previous days, thus increasing the chances that he could respect this area again.
The larger trend remains strong and bullis
S&P500 When this happens, the market falls -10% at least.The S&P500 index (SPX) has been unable to break above its 1D MA50 (blue trend-line), turning it into a Resistance and every time this took place while the 1D RSI was falling under Lower Highs, the market corrected by at least -10%.
More specifically, the Double Top before the current one took place
Warning: Institutional Cash Allocation Falls Below 4%!While the S&P 500 is trading close to its all-time high, the Federal Reserve is set to announce a new monetary policy decision this week, and the biggest U.S. technology companies will report their quarterly earnings.
Last week, I highlighted the technical signal that should absolutely be avoided t
See all ideas
Displays a symbol's value movements over previous years to identify recurring trends.
Frequently asked questions
US 500 Index reached its highest quote on Jun 2, 2026 — 7,624.56 USD. See more data on the US 500 Index chart.
The lowest ever quote of US 500 Index is 4,098.66 USD. It was reached on Oct 26, 2023. See more data on the US 500 Index chart.
US 500 Index is just a number that lets you track performance of the instruments comprising the index, so you can't invest in it directly. But you can buy US 500 Index futures or funds or invest in its components.