WTI Crude Oil: Trend Reversal or Just a Temporary Bounce? Hi!
WTI has broken below its ascending trendline and the previous S&D zone, with strong selling pressure pushing price lower.
The former support area around $100–101 could now act as resistance. I'm watching for a possible pullback into this zone before another move down.
There are two potential paths from here, but both point toward the $91 support area, which is the next key level to watch.
As long as price remains below the broken support and resistance holds, the bearish scenario remains
In-depth trading ideas
XTIUSD H8 Institutional Liquidity Levels Bulls/BearsXTIUSD · H8 OUTLOOK · ProjectSyndicate Levels Desk
▪️ My read: WTI at 98.612 on the 480, pinned inside the 97.556 to 98.994 shelf with the MTF bias flipped 480 ▼ and the last print a SWEEP ▼ 4.0★ seven bars ago, zero open. The board is lopsided in an interesting way: 2 sell-side pools above, 5 buy-side pools below. Quantity sits underneath, quality sits overhead, and the magnet reads SELL-SIDE heavier, 4.6 vs 4.2. Fuel below, destination above. That is exactly the sequence the chart paints: red
WTI OIL on critical crossroads. $118 or $74.30 will prevail?WTI Oil (USOIL) broke below its 1D MA50 (blue trend-line) and is approaching the bottom of its 4-month Channel Up. On any other occasion, that would have been the most technical buy opportunity but attention is needed for one reason.
This time, the current 4-day pull-back was initiated on the U.S. - Iran War Lower Highs trend-line, which is the long-term Resistance that started on the March 09 High. So even though the pull-back resembles that of August 25, which also took place after a near 0.7
Can Oil Continue to Sell?Looks like gold is ready to sell off further.
If there is no further military action in the Middle East, oil prices may fall further.
The resistance is holding up at the moment.
This is my analysis; it is not financial advice.
What do you think about this analysis?
Let me know in the comment box. Don't forget to follow me now and share this analysis with your friends.
Cheers!
USOIL 30Min Engaged ( Bullish & Bearish Reversal Detected )HANZO MARKET LIQUIDITY REPORT
USOIL
Timeframe: 30min (Volume Basis)
Scale: Higher Timeframe Context / Deep Volume analysis
━━━━━━━━━━━━━━━━━━━━━━
Market Observation
This analysis is focusing on structural behavior, liquidity zones, Volume analysis
and key areas of interest within the current range.
━━━━━━━━━━━━━━━━━━━━━━
Market Bias
Full liquidity Map
━━━━━━━━━━━━━━━━━━━━━━
🔥Bullish Reversal
Key Volume Zone : 91.00 Area
🔥Bearish Reversal
Key Volume Zone : 95.50 Area
━━━━━━━━━━━━━━━━━━━━━━
Stru
OIL: A Movement Unrelated to War DevelopmentsOIL: A Movement Unrelated to War Developments
Currently, oil has fallen below $100 per barrel after the price tested a strong resistance zone near 105 - 106.8 degrees Celsius.
The current situation between the US and Iran remains very dangerous.
Trump threatened many times over the past week that the US and Israel will attack Iran after November 3.
However, there have been many reports that Trump also wants to reach a deal.
What is strange is that despite the conflict, oil has started to fa
XTIUSD H12 Institutional Liquidity Levels Bulls/BearsXTIUSD · 84.347 · Primary: bearish — correction resumes
▪️ My read: WTI at 84.347, now trading under the ★★★ 7.8/10 STRONG zone at 85.41 to 86.48 after a near $20 unwind off the early November high. That band absorbed 51 retests as support through the summer — it is a ceiling now, not a floor, and the first candle through it is already closed. Above it the tape is empty all the way to the ★ 5.3/10 at 91.42 to 92.65, which tells you nothing is defending this.
▪️ Below is where the work gets don
USOIL 30Min Engaged ( Bullish Reversal Detected )HANZO MARKET LIQUIDITY REPORT
USOIL
Timeframe: 30min (Volume Basis)
Scale: Higher Timeframe Context / Deep Volume analysis
━━━━━━━━━━━━━━━━━━━━━━
Market Observation
This analysis is focusing on structural behavior, liquidity zones, Volume analysis
and key areas of interest within the current range.
━━━━━━━━━━━━━━━━━━━━━━
Market Bias
Full liquidity Map
━━━━━━━━━━━━━━━━━━━━━━
🔥Bullish Reversal
Key Volume Zone : 97.50 Area
━━━━━━━━━━━━━━━━━━━━━━
Structure Factors:
• Higher timeframe Volume reacti
Oil's bull move is over, likely heads to $29-$48 before higherI've been bullish on oil all throughout October as we moved up into the recent highs, but now the chart has morphed and I think the bull move is over.
I think everyone is trying to view oil through the lens of fundamentals instead of technicals. The arguments are the war(s), loss of refineries, etc., as reasons why the oil prices should continue up.
But what I think oil is selling off here because all risk is selling off, not because of fundamental reasons, and the only way to understand that
Black Gold, Yellow Gold### Beyond Correlation: A Structural Perspective on Oil and Gold
*Reading time: Approximately 4 minutes*
Oil and gold are often viewed as two very different assets. One is a major source of energy for the global economy; the other has long been regarded as a store of value, particularly during periods of uncertainty.
Yet their relationship goes far beyond a simple comparison of prices.
When oil rises, the effects can spread throughout the economy. Transportation, heating, cooking, manufactur
WTI Crude Oil – Bearish OutlookWTI Crude Oil – Market Structure & Bearish Outlook
This chart presents a technical analysis of WTI Crude Oil using Smart Money Concepts (SMC), focusing on key liquidity levels, market structure, and potential price movements.
Price action is being monitored around important supply and demand zones, with 93.03 acting as a key resistance reference and 69.74 representing a major downside liquidity area. The highlighted zones identify potential reaction points where institutional buying or selling
USOIL – Daily CHoCH & Bearish Order Blocks USOIL – Daily CHoCH, Bearish Order Blocks & FVG | Potential Downside Continuation
Market: WTI Crude Oil
Instrument:USOIL CFD
Timeframe:Daily (1D)
Methodology:Smart Money Concepts (SMC) / ICT / Price Action
Market Overview
WTI crude oil has recently shown a notable change in its daily market structure.
Following a strong recovery from the July lows, price maintained a bullish sequence along an ascending trendline.
However, the rejection from the 103–105 region introduced significant s
Bullish bounce in play?XTI/USD has bounced off the pivot, which has been identified as a pullback support, and could potentially rise toward the 50% Fibonacci resistance.
Pivot: 95.86
1st Support: 91.68
1st Resistance: 100.55
Disclaimer:
The opinions given above constitute general market commentary and do not constitute the opinion or advice of IC Markets or any form of personal or investment advice.
Any opinions, news, research, analyses, prices, other information, or links to third-party sites contained on this
OILUSD 30m: Bounce Setup from Reversal Point – Target 93.65Crude Oil has seen a sharp sell-off and is now testing a key support zone on the 30-minute timeframe.
Key Observations:
Price broke down from the rising channel.
A clear demand zone is marked as Reversal Point around 87.50 – 88.50.
Price is currently reacting from this area.
Trade Idea (Bullish Bounce):
Looking for a bounce from the Reversal Point.
As long as price holds above this zone, a recovery move is expected.
Target:
Upside Target → 93.50 – 93.65 area
Invalidation:
A strong break and clos
CRUDE OIL (USOIL): Massive Support BreakoutFollowing the significant decline in 📉Crude Oil prices last week, the market successfully broke and closed below a major horizontal support cluster.
The next significant historical daily support level is located in the 81.12 to 79.64 range. This will likely serve as the primary long-term goal for sellers.
USOIL 30Min Engaged ( Bullish Reversal Detected )HANZO MARKET LIQUIDITY REPORT
USOIL
Timeframe: 30min (Volume Basis)
Scale: Higher Timeframe Context / Deep Volume analysis
━━━━━━━━━━━━━━━━━━━━━━
Market Observation
This analysis is focusing on structural behavior, liquidity zones, Volume analysis
and key areas of interest within the current range.
━━━━━━━━━━━━━━━━━━━━━━
Market Bias
Full liquidity Map
━━━━━━━━━━━━━━━━━━━━━━
🔥Bullish Reversal
Key Volume Zone : 96.15 Area
━━━━━━━━━━━━━━━━━━━━━━
Structure Factors:
• Higher timeframe Volume reactio
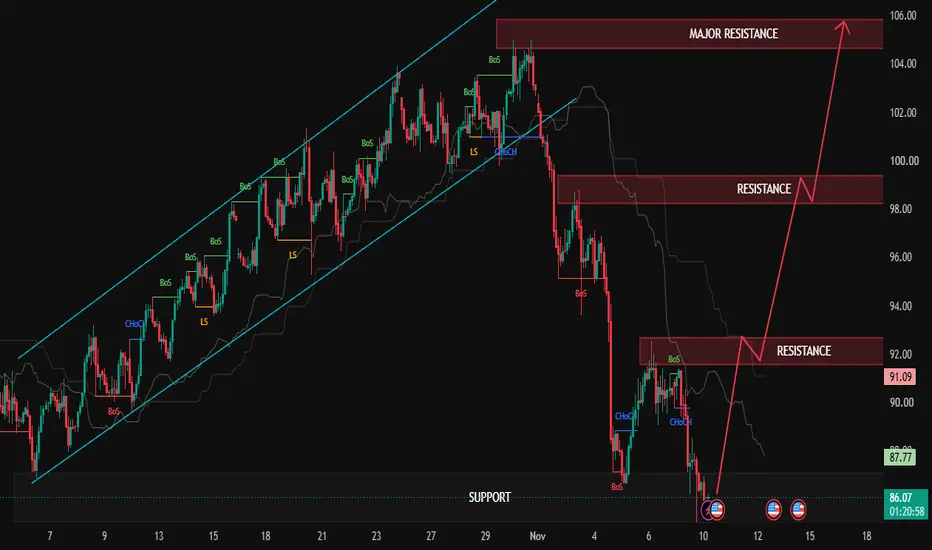
USOIL: Critical Demand Zone Reaction | Structural Recovery...# USOIL | Critical Demand Defense & Multi-Stage Bullish Recovery Setup
**Market Direction:** Conditional Bullish Rebound | Major Downtrend Resistance Ahead
📍 **BUY ENGAGEMENT REGION:** 85.50–87.00
### Projected Upside Path
- **Recovery Objective 1:** 92.00–92.50
- **Breakout Objective 2:** 98.20–99.30
- **Major Extension Target:** 104.50–105.50
🛑 **Downside Protection Boundary:** 84.50 — a confirmed 1H candle close below this level would invalidate the proposed recovery scenario.
### Techni
USOIL 30Min Engaged ( Bullish & Bearish Reversal Detected )HANZO MARKET LIQUIDITY REPORT
USOIL
Timeframe: 30min (Volume Basis)
Scale: Higher Timeframe Context / Deep Volume analysis
━━━━━━━━━━━━━━━━━━━━━━
Market Observation
This analysis is focusing on structural behavior, liquidity zones, Volume analysis
and key areas of interest within the current range.
━━━━━━━━━━━━━━━━━━━━━━
Market Bias
Full liquidity Map
━━━━━━━━━━━━━━━━━━━━━━
🔥Bullish Reversal
Key Volume Zone : 88.25 Area
🔥Bearish Reversal
Key Volume Zone : 93.45 Area
━━━━━━━━━━━━━━━━━━━━━━
Stru
USOIL Breaks Rising Trendline – Is 88.00 Liquidity Next?🔹 USOIL is showing a shift in market structure after facing strong rejection from the 103.00–105.00 resistance zone. Price has broken below the rising trendline, suggesting that bullish momentum has weakened and bearish pressure is increasing. The recent downside move has pushed price toward the 95.00–97.00 region, where short-term consolidation is developing. The previous bullish structure appears disrupted, while the highlighted resistance zone remains an important area for sellers. This price
WTI CRUDE OIL: Bull Trap or Massive Breakout? (VWAP Trade Plan)WTI CRUDE OIL (XTIUSD) 🌍
The macro narrative heading into this week is dominated by shifting geopolitical headlines and post-election diplomatic posturing surrounding Middle East shipping corridors and supply risk premiums 🏦. Market chatter suggests a growing division across trading desks, while retail consensus is currently leaning heavily split with a bearish tilt following last week's sharp pullback, anticipating further downside continuation toward the lower settlement floors. In this mixed
WTI Crude Oil: The Coiled Spring Setup Targeting $136### 📊 Market Overview & Structure
Following a healthy multi-week consolidation and a textbook symmetrical triangle compression pattern on the 4-hour timeframe, **WTI Crude Oil** is showing strong structural signs of resuming its primary macro uptrend. After successfully building support off the lower harmonic boundaries, price is coiling tightly near the apex, preparing for an explosive expansion phase.
### 🟢 The Bullish View (The Path to $136)
* **Structural Coiled Spring:** Following a powerf
USOIL | Midterm Shift Pressures Crude as 93.70 Becomes the Pivot
Oil prices extended losses on Wednesday as markets reassessed the outlook for the U.S.–Iran conflict following the Democratic sweep of both chambers of Congress.
The election result could make it harder for President Trump to secure congressional support for parts of his foreign-policy agenda, increasing speculation that Washington may face greater political pressure to pursue diplomacy rather than further escalation with Iran. However, Trump still retains substantial authority over military
CRUDE OIL Long-TradeHey guys,
welcome to my trading-diary.
Today I`m looking for a long trade ahead the NFPS.
More risk-off likely to appear due to inflation-worries are likely in the current enviroment.
I guess we miggt see a crazy-ass-trump soon with more threats against IRAn as long as he can.
However, for now I`m lookin for a long-pullback-trade.
Lets see!