USDCADHello Traders! 👋
What are your thoughts on USDCAD?
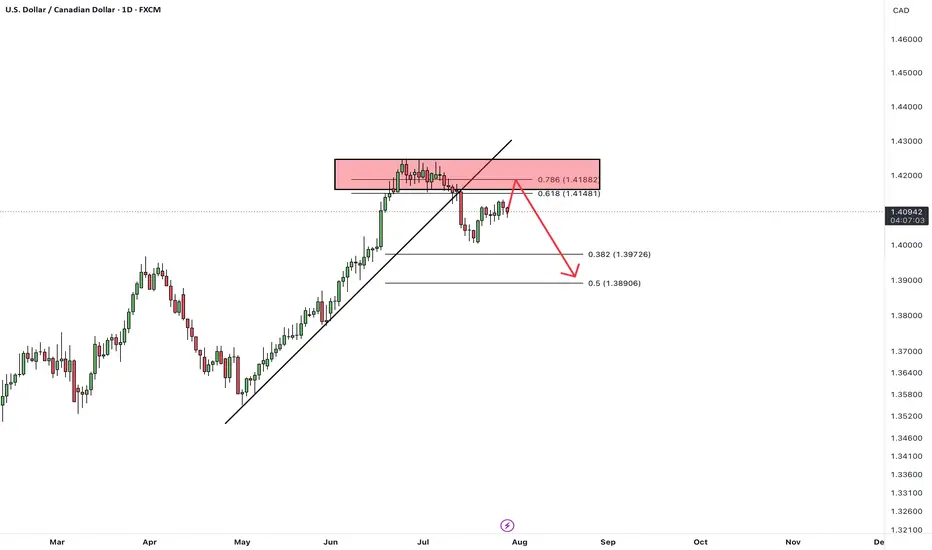
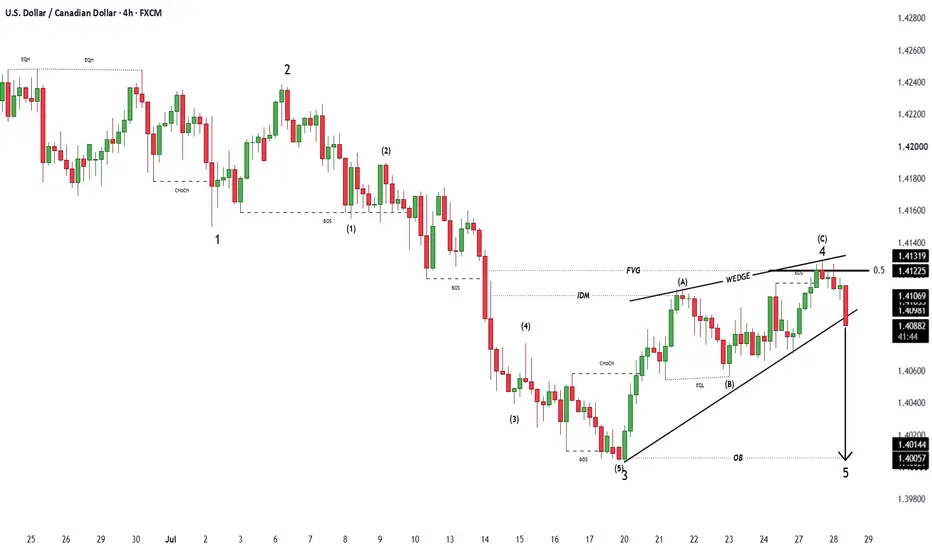
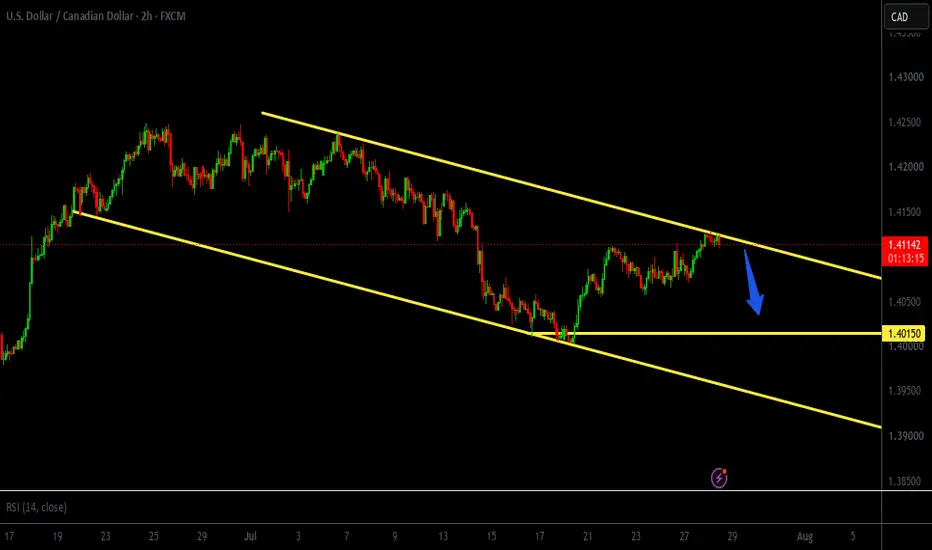
USD/CAD failed to break above its resistance zone and was rejected, triggering a decline that led to the breakdown of its short-term ascending trendline. The pair is now trading below this broken trendline, suggesting that bearish momentum remains in control.
From here, price is expected to continue its corrective rebound and complete a pullback into the highlighted resistance zone. As long as USD/CAD remains below this resistance area, the broader outlook stays bearish, with the downside targets shown on the chart remaining in focus. A confirmed daily close above the resistance zone would invalidate the bearish scenario and signal that buyers have regained control.
If you found this analysis helpful, please support it with a like and share your thoughts in the comments! Good luck with your trades!❤️
U.S. Dollar / Canadian Dollar
No trades
No trades
In-depth trading ideas
#USDCAD: From 400 To 900+ Pips Trade Setup! 🔺The USDCAD pair has been bullish since the conflict in the Middle East began. This is because the US dollar is the primary investment vehicle for global investors, which has contributed to the strong performance of the DXY. Consequently, the USDCAD prices have risen by over 1000 pips in a short period.
🔺In forex, no pair moves at such a rapid pace. Given the unique situation, we anticipate a strong bullish volume to continue increasing in the near future, with the price potentially reaching 1.47 or even exceeding 1.50.
🔺We have two entry zones. The first is aligned with the price movement, while the second is triggered by a short-term change or negative data affecting the USD, which would cause a drop in the price. The take price is initially set at 1.47 and can be adjusted to 1.50 if the price shows strong bullish momentum.
If you agree with this analysis, please like and comment. ❤️
Bullish Momentum Builds on USD/CADUSD/CAD is showing signs of strengthening after defending a key support zone and forming a bullish reversal pattern. Price has broken above short-term resistance while continuing to respect the ascending trendline, indicating that buyers are gradually taking control. The highlighted demand area and Ichimoku support provide strong technical confluence, suggesting the recent pullback may be a healthy retracement rather than the start of a bearish reversal. As long as price remains above the breakout zone, the bullish structure is expected to stay intact. 🔍
🚀 A sustained move above the current resistance could trigger the next bullish leg toward the first target at 1.4128. If buying momentum remains strong and buyers maintain control, the rally could extend further to the second target at 1.4153. 🎯 Traders should wait for confirmation before entering positions as a failure to hold above support could weaken the bullish outlook. ⚠️
If you found this analysis helpful, don’t forget to LIKE 👍 and COMMENT 💬!
USDCAD Price Update – Clean & Clear ExplanationUSD/CAD has confirmed a bullish Break of Structure (BOS) after breaking above a key resistance zone, indicating that buyers have regained control. The pair continues to print higher highs and higher lows, supported by a strong ascending trendline, which reflects sustained buying momentum.
The recent breakout above the supply zone suggests that the market is targeting higher liquidity. If price pulls back, the previous resistance area is expected to act as a new support zone, providing an opportunity for buyers to re-enter before the next bullish expansion.
As long as USD/CAD remains above the breakout level, the overall outlook stays bullish, with the potential for further upside toward the next resistance and liquidity targets. However, a sustained move below the key support zone could invalidate the current bullish structure and trigger a deeper correction.
Overall, the market sentiment remains positive, and the bullish structure is still intact. Traders should monitor price action around the breakout zone for confirmation before looking for continuation setups. Only a sustained move below the key support area would weaken the current bullish outlook and suggest a deeper corrective move.
This analysis is shared for educational purposes only and should not be considered financial advice.
USD/CAD Bullish Recovery Toward 1.4154
USD/CAD is showing signs of a **bullish recovery** after rebounding strongly from the major support zone around **1.4000–1.4010**. Price has broken out of the previous descending channel, suggesting that bearish momentum has weakened and buyers are gradually taking control.
The pair is now consolidating above **1.4090**, and a sustained move above the recent intraday highs could trigger further upside momentum. If bullish pressure continues, the next objective is the **1.4154** area, which aligns with the marked target on the chart. A successful move beyond this level could open the door for a retest of the higher **resistance zone near 1.4230**.
However, traders should monitor the **1.4000 support** closely. A break below this level would invalidate the current bullish outlook and could shift momentum back in favour of the sellers.
**🎯 Target:** **1.4154**
**🟢 Bias:** Bullish
**🔑 Key Support:** 1.4000–1.4010
**🚧 Major Resistance:** 1.4230
USDCAD: Bullish momentum remains intactThe USDCAD exchange rate is holding firm above a key support zone following several successful rebounds, indicating that buyers are actively defending the current uptrend. Despite facing resistance from a downtrend line, sellers have failed to push the pair below the 1.4035 support level, thereby preserving the bullish structure.
From a fundamental perspective, the outlook also leans bullish. Expectations that the Federal Reserve will maintain a cautious stance on interest rate cuts—combined with falling oil prices and ongoing pressure on the Canadian dollar—are supporting the USD/CAD pair.
My preferred scenario involves a pullback to the 1.4035 support zone, followed by renewed buying pressure targeting the 1.4112 resistance level. A decisive break above the downtrend line would reinforce the bullish outlook and signal that buyers are regaining full control.
My view: USD/CAD remains bullish in the short term. I prefer looking for BUY opportunities on pullbacks to support levels rather than chasing the price after a resistance breakout.
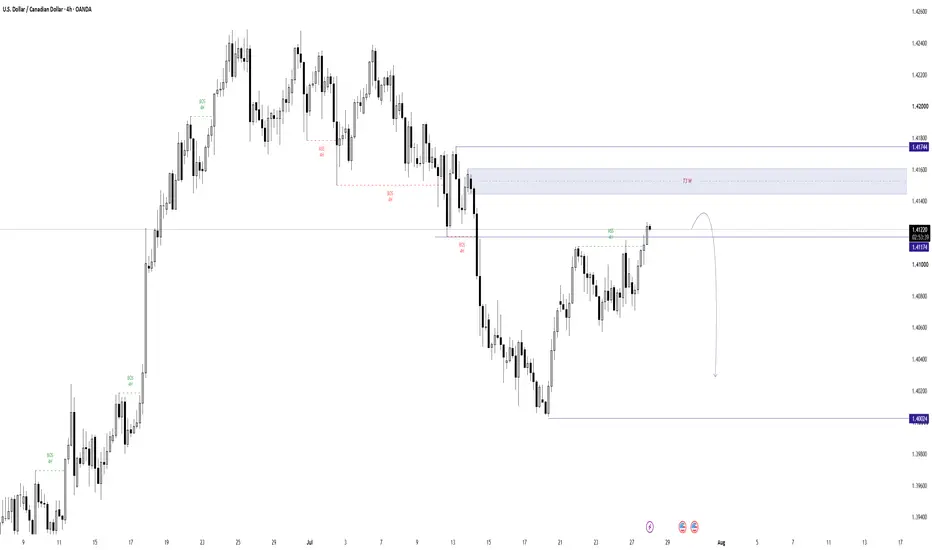
USDCAD | Weekly Supply Reactionmeframe: H4
Concept: Market Structure & Liquidity
USDCAD is retracing into a key weekly supply zone after recovering from recent lows. Price is approaching a premium area around 1.4145–1.4160, where higher-timeframe order flow and liquidity may attract selling interest.
Scenarios:
• Bearish continuation: Rejection from the weekly supply zone may drive price back toward 1.4000 liquidity.
• Bullish continuation: A sustained close above 1.4160 would invalidate the bearish outlook and expose 1.4180+ liquidity.
Bias: Bearish while price remains below the weekly supply zone.
Disclaimer: This analysis is for educational and informational purposes only and does not constitute financial advice. Trading involves substantial risk, and independent analysis with proper risk management should always be applied.
USDCAD: Demand zone at 1.4040 may sustain the uptrendUSDCAD is currently consolidating within a triangle pattern, yet the recovery structure originating from the 1.4000 level remains intact. The current pullback could see the price retest the 1.4040–1.4060 demand zone, a confluence point where the rising trendline meets a supportive Fair Value Gap (FVG).
The fundamental backdrop remains bullish; the USD is supported by expectations that the Federal Reserve will maintain a cautious stance, while weakening oil prices and trade concerns continue to weigh on the CAD.
The preferred scenario is for the price to react positively at 1.4040 and subsequently rebound toward the 1.4106 level. Should buying pressure prove strong enough to break the overhead bearish trendline, the upward momentum could accelerate significantly.
Current outlook: Favor long positions (BUY) if the price holds the 1.4040–1.4060 zone and a bullish confirmation signal emerges. Near-term target: 1.4106.
USDCAD Bullish Recovery from Support
USDCAD is trading near a key support zone around **1.4050** after a sharp bearish move. Price is attempting to stabilize above support, suggesting buyers are stepping in. The Ichimoku Cloud indicates that if price can reclaim the cloud and hold above the recent lows, bullish momentum could strengthen.
The highlighted consolidation area shows where price previously accumulated before rejecting lower. A successful recovery above the cloud could trigger a move toward the marked resistance level.
**🎯 Bullish Target:** **1.4091**
**Key Levels:**
* **Support:** 1.4005 – 1.4010
* **Current Price:** ~1.4053
* **Target:** **1.4091**
* **Major Resistance:** 1.4170
A sustained move above **1.4065–1.4075** would increase the probability of reaching the **1.4091** target. However, a break below the support zone would weaken the bullish outlook and could expose lower price levels.
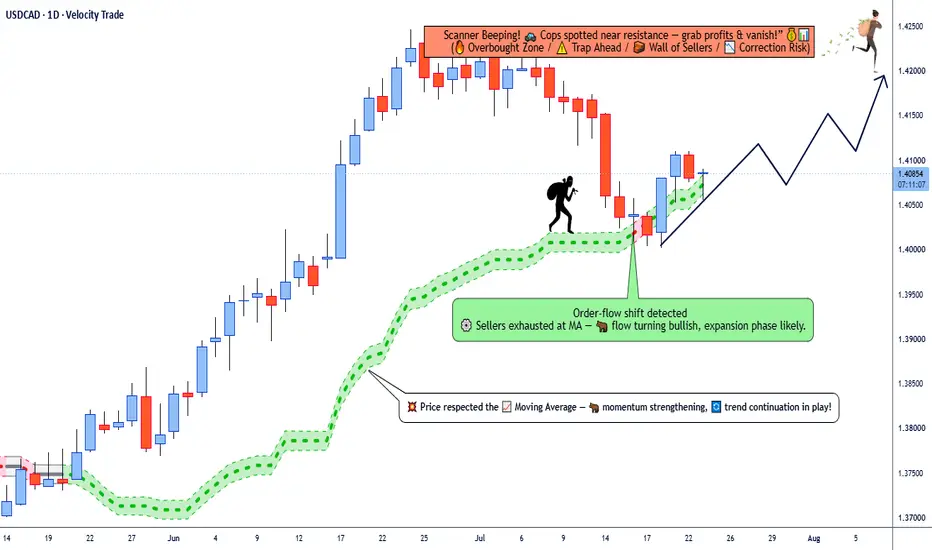
Don't Miss This USD/CAD Bullish Opportunity!🚀 USD/CAD "LOONIE": Master Plan to Profit Like a Pro!
🎯 Kijun-Sen Pullback + Trap Resistance 🎯
DESCRIPTION (Copy & Paste):
📢 Welcome back, Ladies & Gentlemen (Thief OG’s)!
Are you ready to trade like a seasoned professional? Today we are breaking down a high-probability day and swing trading setup on USD/CAD ( OANDA:USDCAD ), affectionately known as the "Loonie."
Here is the complete blueprint—combining Ichimoku Kinko Hyo structure, moving average dynamics, market psychology, and real-time economic drivers!
📊 TECHNICAL ANALYSIS & TRADE EXECUTION PLAN
Market Bias: Bullish (Day / Swing Trade) 🐂
Setup Confirmation: Price pullback & bounce off the Kijun-Sen (Base Line) and dynamic moving averages, confirming buyers are stepping back in to defend value.
Execution Strategy: Scaled entries across your preferred price zone as confirmation candles close.
📍 Suggested Entry Zone: Flexible entry upon bullish price action confirmation near current support levels / Kijun-sen confluence.
🎯 Profit Take Targets:
Target 1 (Day Trader TP): 1.41500 (Initial liquidity grab zone)
Target 2 (Swing Trader TP): 1.42000 (Key institutional barrier)
FINAL Target (The Great Escape): 1.42500 🚨
⚠️ The "Police Force" Resistance Notice: Watch out around 1.42500! This heavy zone represents strong dynamic resistance, overbought RSI conditions, and potential retail trap liquidity. When price hits this wall, lock in profits and execute a swift exit like a true OG! 💰
🛑 Stop Loss (Risk Shield): 1.40000 (Strict Thief SL below key structural support)
🌐 RELATED PAIRS & MACRO CORRELATION WORKSHOP
To trade the Loonie like a pro, you must keep an eye on the correlated matrix:
OANDA:USDCAD – Primary asset under evaluation.
TVC:DXY (US Dollar Index) – Strong positive correlation. Dollar Index stability above ~100.90 provides the fundamental engine for USD strength.
TVC:USOIL (WTI Crude Oil) – Strong inverse correlation. Oil fluctuations around $78.00–$80.00/bbl directly impact Canadian export revenues and CAD valuations.
OANDA:EURUSD – Inverse benchmark. Weakness in EUR/USD often reflects broad USD buying pressure, boosting PURPLETRADING:USDCAD.
OANDA:CADJPY – Cross-currency gauge. Useful for tracking raw CAD sentiment independent of the USD.
📰 REAL-TIME FUNDAMENTAL & ECONOMIC DRIVERS
Here is what global macro market feeds & central banks are broadcasting right now:
🏛️ Bank of Canada (BoC): Maintained its benchmark interest rate at 2.25%, signaling a neutral policy stance amid balanced growth and inflation metrics.
💵 Federal Reserve & Rate Differentials: The Fed target rate differential continues to give the US Dollar a slight yield advantage over the Canadian Loonie.
🛢️ Energy Sector Dynamics: WTI Crude Oil is holding steady near $79-$80/barrel. Any breakdown in oil prices will sap CAD strength and accelerate OANDA:USDCAD momentum toward our upper targets.
📈 Market Sentiment: Trade headline volatility and shifting rate expectations keep OANDA:USDCAD reacting sharply around technical moving averages (such as the 200-hour MA and Kijun-sen).
💡 THIEF OG DISCLAIMER & TRADER MOTIVATION
🎩 "A true Thief OG doesn't chase the market—they wait in the shadows for the market to deliver the loot!"
Drop a LIKE 👍, leave a COMMENT 💬 with your bias, and FOLLOW for more institutional setups! Let's secure these pips together! 🚀🔥
USD/CAD BEARS ARE GAINING STRENGTH|SHORT
Hello, Friends!
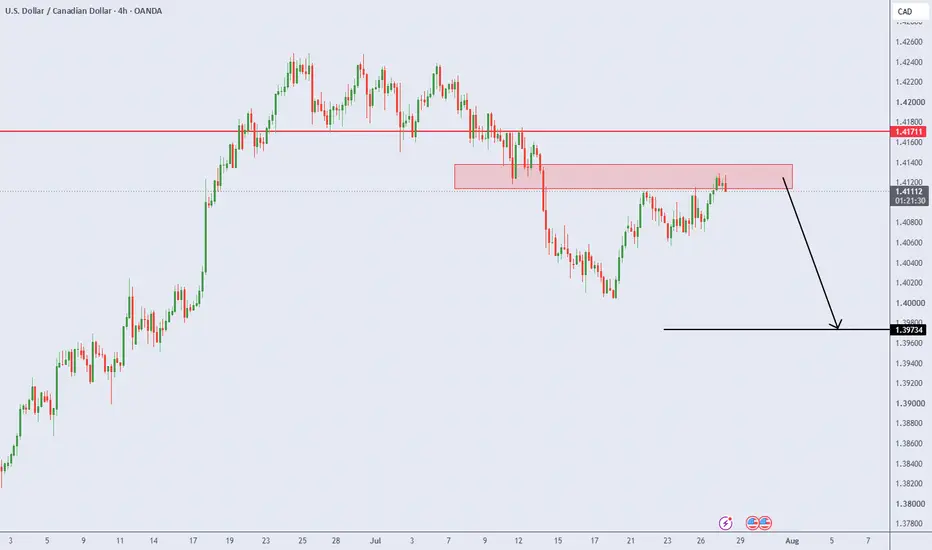
USD/CAD is trending down which is evident from the red colour of the previous weekly candle. However, the price has locally surged into the overbought territory. Which can be told from its proximity to the BB upper band. Which presents a beautiful trend following opportunity for a short trade from the resistance line above towards the demand level of 1.399.
Disclosure: I am part of Trade Nation's Influencer program and receive a monthly fee for using their TradingView charts in my analysis.
✅LIKE AND COMMENT MY IDEAS✅
USDCAD Market View: Bearish – Selling from a Key Resistance ZoneUSDCAD SELL SETUP | 1H TIMEFRAME
Market View: Bearish – Selling from a Key Resistance Zone
USDCAD remains under bearish pressure on the 1-hour timeframe. Price has retraced into a significant resistance zone around 1.41200, where sellers may regain control and continue the prevailing downtrend.
Entry Zone:
Sell around 1.41200 after bearish confirmation.
Technical Targets:
TP1: 1.40800
TP2: 1.40500
TP3: 1.40200 (Please confirm if this was your intended final target.)
Technical Analysis:
The overall trend remains bearish, and the current pullback into resistance offers a potential continuation opportunity. A bearish rejection candle or strong selling momentum from the resistance zone would strengthen the probability of price moving toward the projected targets.
Risk Management:
Place your stop-loss above the resistance zone according to your risk management strategy. Always wait for confirmation before entering the trade and manage your position with discipline.
«Follow the trend, respect your risk, and let price action confirm the setup.»
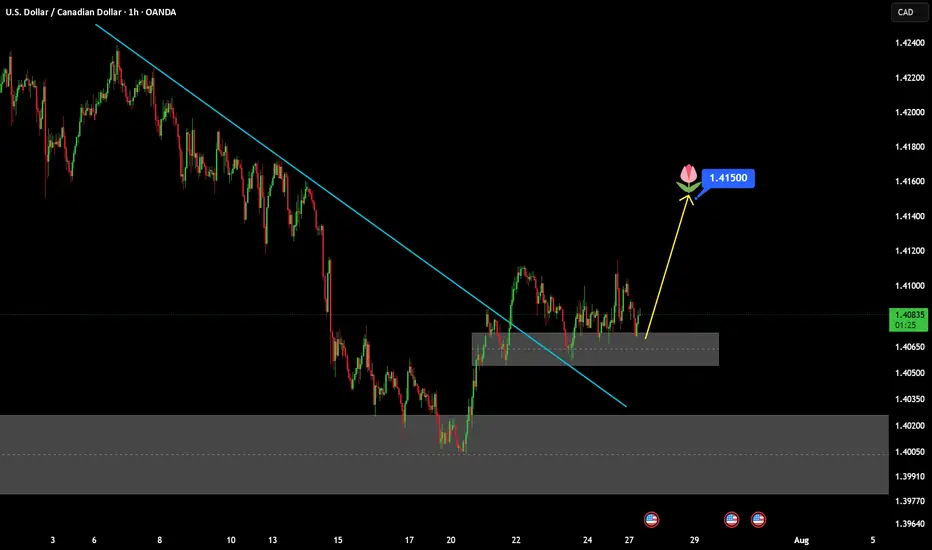
USDCAD: Watch this Key Support reactionPrice has remained in a steady downtrend for quite some time, repeatedly respecting the descending trendline. Every attempt to move higher was rejected until price reached a key support zone and reacted strongly.
We then saw a clear breakout above the trendline, providing the first meaningful sign that the bearish structure may be starting to shift.
Right after the breakout, price pulled back into the support area.
If buyers continue to defend this zone and bullish momentum holds, I expect price to push higher toward 1.41500.
If the support zone breaks with strong bearish momentum, the entire idea will weaken. For now, however, buyers are stepping in exactly where they need to.
USD/CAD Vulnerable to Selling Ahead of FOMCUSD/CAD moved within a narrow consolidation corridor around the 1.4100 level throughout Wednesday's Asian trading session. Global market participants refrained from placing aggressive directional bets ahead of the release of the Fed's FOMC Monetary Policy Meeting decision tonight.
---------------------------------------------------------------------------------------------------------------
✅ Geopolitical Escalation & Oil Rebound: IRGC Missile Attack vs. Joint US-Saudi Strike
The dynamics of upstream energy commodities and safe-haven assets are heating up again due to the eruption of a new military confrontation:
- IRGC Ballistic Missile Rain: Iran's Islamic Revolutionary Guard Corps (IRGC) launched another attack of several ballistic missiles targeting US military positions in the Middle East on Tuesday.
- Joint CENTCOM & Saudi Arabia Strike: US Central Command (CENTCOM) confirmed that US fighter jets and the Saudi Arabian air force launched a joint airstrike against an Iranian-allied militia network in Iraq.
- Trump's Infrastructure Warning & Oil Rebound: President Donald Trump further escalated the situation by issuing a statement that the US is ready to launch massive military action to destroy Iran's vital infrastructure if diplomacy fails.
---------------------------------------------------------------------------------------------------------------
✅ Technical Analysis
Technically, on the 4-hour (H4) chart, USD/CAD is consolidating its recovery gains from the monthly low around the 1.4100 level ahead of the FOMC catalyst:
- Pre-FOMC Wait-and-See Pattern: The USD/CAD pair's daily decline is currently contained above the 1.4060-1.4070 level. It would be prudent to wait for consecutive selling below this area before confirming that the USD/CAD recovery from the one-month low has lost momentum.
- Rebound Scenario: If Kevin Warsh delivers hawkish guidance tonight, USD/CAD is projected to immediately break through the 1.4150 level towards the primary target of 1.4200.
TRADING RECAPTraders in this video, I have shared some key lessons on the trade I took from last week and also some life wisdom, as I do believe that it's very important to share that. Honestly speaking, a lot is happening in our society, and we need to deal with that. Content below if you have been going through the same struggle, and don't hesitate to reach out to me if you need any Life advice.
USD/CAD 4H: Supply Zone Re-test & Bearish Reversal Setup!USD/CAD is approaching a clean supply mitigation setup on the 4-Hour chart.
📊 Quick Technical Breakdown:
• Liquidity Swept ("X"): Price swept internal sell-side liquidity before the strong drop into 1.4050.
• Supply Zone (Green Box): Strong 4H supply sits between 1.4150 – 1.4180.
• Resistance Level: Key structural resistance is holding around 1.4183 (Stop Loss zone).
• Target: Looking for a downside move back towards 1.3915 – 1.3900.
🎯 Trade Plan:
• Entry Zone: 1.4150 – 1.4180 (Supply Block Retest)
• Stop Loss: Above 1.4183 / 1.4200
• Take Profit: 1.3916
💬 Are you looking to short USD/CAD from supply or do you see a breakout? Share your thoughts below!
If this helps your trading, hit LIKE 👍 and FOLLOW for daily clean setups!
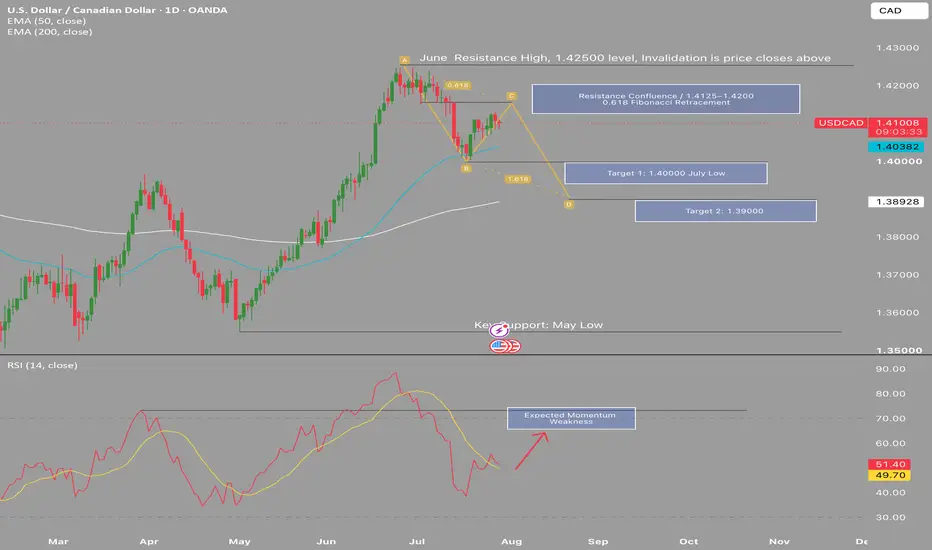
USDCAD- Resistance Confluence Signals Potential Bearish ReversalUSDCAD is approaching a significant technical inflection point following a corrective rally into a high-confluence resistance zone between 1.4125 and 1.4200. This area combines the June resistance high, the 61.8% Fibonacci retracement of the recent decline, and the projected completion of an ABCD harmonic pattern, creating a technically compelling area for sellers to regain control. Despite the recent recovery, price continues to trade below the 1.4250 June swing high, which remains the key invalidation level, with a sustained daily close above this resistance suggesting that bullish momentum has resumed. Should price reject from this confluence zone, initial downside objectives remain the psychological 1.4000 level and the July swing low, followed by 1.3900, where the 200-day EMA provides additional dynamic support and technical confluence. Momentum has also begun to recover following the recent rally, although I will be monitoring for expected momentum weakness and bearish price action before considering short exposure, as this remains a forecast rather than a confirmed reversal.
From a fundamental perspective, this outlook is supported by the potential for relative Canadian dollar strength should the current macroeconomic environment continue to favour CAD over USD. Softer US inflation, weaker labour market data, or a more accommodative Federal Reserve could reduce support for the US dollar, while resilient Canadian economic data, a comparatively hawkish Bank of Canada, and stronger crude oil prices may continue to underpin demand for the Canadian dollar. Market participants should also remain attentive to upcoming Federal Reserve and Bank of Canada policy decisions, inflation releases, employment reports, and developments in the energy market, as these events are likely to influence the next directional move. While price action will ultimately determine whether this scenario develops, the current combination of technical confluence and macroeconomic factors presents a compelling case for a bearish continuation should resistance between 1.4125 and 1.4200 be successfully defended.
USDCAD is approaching a significant technical inflection point following a corrective rally into a high-confluence resistance zone between 1.4125 and 1.4200. This area combines the June resistance high, the 61.8% Fibonacci retracement of the recent decline, and the projected completion of an ABCD harmonic pattern, creating a technically compelling area for sellers to regain control. Despite the recent recovery, price continues to trade below the 1.4250 June swing high, which remains the key invalidation level, with a sustained daily close above this resistance suggesting that bullish momentum has resumed. Should price reject from this confluence zone, initial downside objectives remain the psychological 1.4000 level and the July swing low, followed by 1.3900, where the 200-day EMA provides additional dynamic support and technical confluence. Momentum has also begun to recover following the recent rally, although I will be monitoring for expected momentum weakness and bearish price action before considering short exposure, as this remains a forecast rather than a confirmed reversal.
From a fundamental perspective, this outlook is supported by the potential for relative Canadian dollar strength should the current macroeconomic environment continue to favour CAD over USD. Softer US inflation, weaker labour market data, or a more accommodative Federal Reserve could reduce support for the US dollar, while resilient Canadian economic data, a comparatively hawkish Bank of Canada, and stronger crude oil prices may continue to underpin demand for the Canadian dollar. Market participants should also remain attentive to upcoming Federal Reserve and Bank of Canada policy decisions, inflation releases, employment reports, and developments in the energy market, as these events are likely to influence the next directional move. While price action will ultimately determine whether this scenario develops, the current combination of technical confluence and macroeconomic factors presents a compelling case for a bearish continuation should resistance between 1.4125 and 1.4200 be successfully defended.
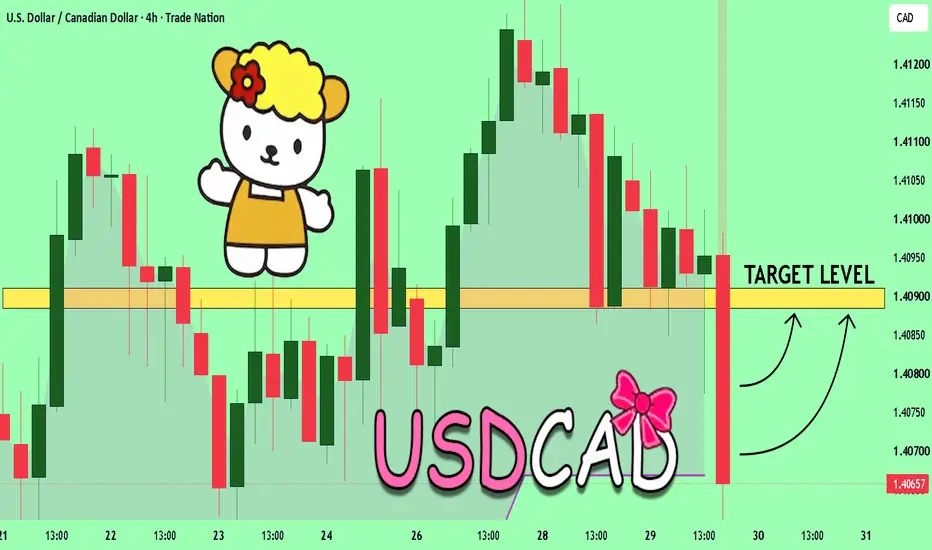
USDCAD The Target Is UP! BUY!
My dear friends,
My technical analysis for USDCAD is below:
The market is trading on 1.4072 pivot level.
Bias - Bullish
Technical Indicators: Both Super Trend & Pivot HL indicate a highly probable Bullish continuation.
Target - 1.4088
About Used Indicators:
A pivot point is a technical analysis indicator, or calculations, used to determine the overall trend of the market over different time frames.
Disclosure: I am part of Trade Nation's Influencer program and receive a monthly fee for using their TradingView charts in my analysis.
———————————
WISH YOU ALL LUCK
USD-CAD Free Signal! Sell!
Hello, Traders!
USDCAD is rejecting the horizontal supply area after a liquidity retest. Sellers are defending this zone, increasing the probability of a bearish continuation toward lower liquidity.
-----------------
Stop Loss: 1.4146
Take Profit: 1.4089
Entry: 1.4121
Time Frame: 6H
-----------------
Sell!
Comment and subscribe to help us grow!
Check out other forecasts below too!