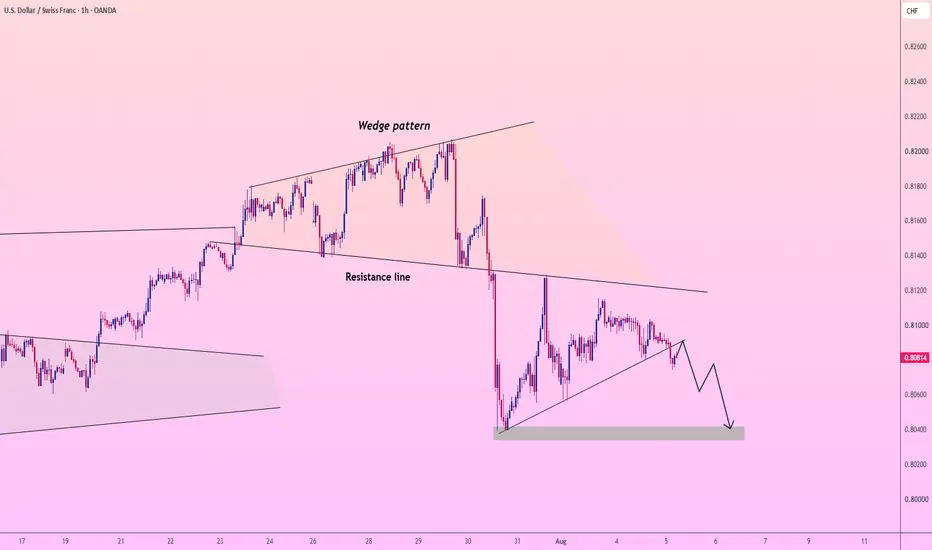
USD/CHF: THE 0.80400 SUPPORT FLUSH! 🛑
Breaking local trendline support at 0.80810! Are you blindly buying this minor pause, or positioning for the multi-wave drop to the 0.80400 demand zone? 🤔
USD/CHF is facing renewed selling pressure after failing to reclaim its higher-timeframe resistance structure. On this 1-hour OANDA chart, the pair has broken cleanly below its local ascending trendline and is accelerating lower around 0.80810, beneath its former **Wedge pattern** and **Resistance line**. 📉💥
Look closely at the black blueprint trajectory mapping out the upcoming sessions. The algorithm projects a multi-wave markdown sequence:
• A brief reflex push back toward 0.80900 - 0.80950 to retest broken support as resistance and sweep local liquidity. 🪤
• A sharp impulse decline pushing price down toward the 0.80600 zone. ⚡
• A minor reflex bounce up toward 0.80750 to absorb remaining retail buy orders. 🌊
• Final acceleration flush driving straight down into the primary gray support floor near 0.80400. 🎯🔻
Maintaining technical patience and resisting over-leveraged long entries is your ultimate advantage in this setup. Trying to force buy positions directly following a fresh trendline breakdown is a quick way to get caught on the wrong side of institutional distribution. Professional desks wait for the relief bounce to exhaust near local resistance before scaling into short positions alongside the primary flow. 🧘♂️⚡
🛠 Trade Parameters:
🛒 Short Zone: 0.80900 - 0.80950 🧱
🛑 Stop-Loss: 1h close above 0.81150 ❌
💰 Take-Profit: 0.80400 🩸
The retail crowd attempting to buy this local dip is driving price straight into institutional sell blocks resting above. Stay disciplined, keep your risk strictly managed, and let the algorithm carry the trade down to our target floor.
Maintain your composure through the waves, and we will see you down at the 0.80400 support floor! 🚀💎
U.S. Dollar / Swiss Franc
No trades
No trades
In-depth trading ideas
USD/CHF - Key demand zone could trigger the next upside move!The USD/CHF 4H chart is showing a constructive structure, with price holding above the rising trendline and developing a potential higher-low setup.
🔥The highlighted 0.8040–0.8055 key zone is the main area to watch. As long as price respects this demand/support region, the bullish scenario remains technically valid.
🔥A move higher could first target 0.8167, followed by 0.8206. These levels also align with the marked Fibonacci structure and previous price reactions.
Key zone: 0.8040–0.8055
Upside target 1: 0.8167
Upside target 2: 0.8206
Bullish condition: Price holds the key zone and develops higher highs
Invalidation: Sustained break below the key support structure
Disclaimer : This analysis is for educational and informational purposes only. It is not financial or investment advice and should not be considered a recommendation to buy or sell.
USDCHF H2 Institutional Liquidity Levels Bulls/Bears▪️ USDCHF — BOXED IN. BOTH EDGES ARE LOADED. 🩸
▪️ Swissy is rotating near 0.80864, fair-valued in the upper half of a tight, heavily-tested range. Price is pinned between a strong lid above and the single heaviest floor on the board below — the box holds until one edge breaks.
▪️ Primary outlook: range-bound, compression before expansion. — 0.80640 is the near defense; 0.80960 is the near lid. The broad range (0.80330 → 0.81200) is intact until a clean break resolves it.
▪️ Key resistance zone: 0.81150–0.81200 — a ★★★ 7.7/10 STRONG wall, leaned on 7 times. This is the ceiling both scenarios point to. Intermediate resistance: 0.80920–0.80960 — a ★ 5.6/10 WEAK shelf worn 29 times; a speed bump, not a wall.
▪️ Major defense line: 0.80600–0.80640 — a ★★ 6.5/10 MODERATE support at 21 retests, the first floor. True structural floor: 0.80330–0.80360 — a ★★★ 7.8/10 STRONG zone tested 74 times, by far the most respected level here and the deep magnet below.
▪️ Primary downside targets on a break: 0.80640, then 0.80330–0.80360 where resting demand is deepest.
▪️ Primary upside targets on a reclaim: 0.80960, then 0.81150–0.81200.
▪️ Bullish scenario (maroon path): Sweep the lows into 0.80330–0.80360, trap the breakout sellers, then reverse up through 0.80640 → 0.80960 → drive the 0.81150–0.81200 lid (Bullish Target). The floor giving a false break is where the highest-value long sets up.
▪️ Bearish scenario (yellow path): Pop into 0.81150–0.81200, get rejected off the strong wall, then flush back through 0.80960 → 0.80640 → into the 0.80330–0.80360 floor (Bearish Scenario). The lid rejection is the short trigger.
▪️ KEY LEVELS
▪️ Current Price: ~0.80864
RESISTANCES
▪️ 0.81150–0.81200 — ★★★ 7.7/10 STRONG · 7 retests · scenario ceiling / Bullish Target
▪️ 0.80920–0.80960 — ★ 5.6/10 WEAK · 29 retests · intermediate shelf
SUPPORTS
▪️ 0.80600–0.80640 — ★★ 6.5/10 MODERATE · 21 retests · first floor
▪️ 0.80330–0.80360 — ★★★ 7.8/10 STRONG · 74 retests · structural floor / Bearish Target
▪️ ZONE MAP
▪️ Overhead: 0.80960 (~0.09% / ~8 pips) → 0.81150–0.81200 (~0.38% / ~31 pips) — the weak shelf then the strong lid that has to be eaten before trend-up confirms.
▪️ Below: 0.80640 (~0.30% / ~24 pips) → 0.80330–0.80360 (~0.64% / ~52 pips) — the near defense then the 74-retest floor, the highest-value reversal zone on the board.
🔍 THE SCENARIO PATH
▪️ Bearish path (up-first, bearish resolve): from 0.80864, rotation up into the 0.81150–0.81200 wall → rejection → step down through 0.80960 and 0.80640 → settle into the 0.80330–0.80360 floor. Edge-sweep on the topside first, then the full range traverse lower.
▪️ Bullish path (down-first, bullish resolve): from 0.80864, flush down into the 0.80330–0.80360 floor → hold / bear trap → reversal back up through 0.80640 and 0.80960 → target the 0.81150–0.81200 lid. Rough full-rotation window ~2 weeks on H2, with the edge sweep landing in the first several sessions.
▪️ My read: Compressed range, price sitting mid-to-upper with a much deeper, better-defended floor (74 retests) than lid (7 retests). That asymmetry says a sweep into 0.80330–0.80360 that holds is the high-value long; a clean rejection at 0.81150–0.81200 is the clean short. The edges pay, the middle chops — don't get chopped up trading the 0.80640–0.80960 no-man's-land.
🔒 Levels and paths from the zone model. No signals, no repaint — a scenario, not a promise.
▪️ ProjectSyndicate Levels Desk — Overview of key S/R zones for metals, FX. indices, NVDA, NQ, ES & GC traders every week. Subscribe to stay up to date with the latest levels.
#USDCHF #Forex #Trading
USD/CHF Downside Pressure Ahead of Key U.S.Labor Data (05.08.26)USD/CHF has broken below a well-defined symmetrical triangl e after repeated rejection from a bearish order block near the upper trendline. The breakdown is supported by a loss of short-term structure and price moving into the Fair Value Gap (FVG), increasing the probability of further downside continuation. As long as price remains below the broken triangle and bearish order block, sellers remain in control, with the next focus on the major support levels shown on the chart. FX:USDCHF
(SELL)
🔴 1st Support : 0.80213
🔴 2nd Support : 0.79920
🟢 Resistance Zone : 0.81050 – 0.81140
✅ Traders are focused on today's ADP Employment Report and ISM Services PMI as leading indicators before Friday's Non-Farm Payrolls.
⚠️ Disclaimer: This analysis is for educational purposes only.
Support the idea 🚀 Boost | 💬 Comment | 🔁 Share
🔸🔸 Charts Don't Lie, Traders Don't Quit 🔸🔸
USDCHF: 0.8080 Holds Firm; Buyers Poised for a ComebackUSDCHF is approaching the 0.8130 level, a confluence point between horizontal resistance and a bearish trendline. As this is a key resistance zone, a short-term pullback is entirely possible before the price determines its next direction.
From a technical standpoint, I favor a bullish scenario following a pullback. The 0.8080 level is the immediate support to watch; if buying pressure successfully defends this area, USDCHF could retest 0.8130. In the event of a deeper correction, 0.8040 serves as a critical demand zone and a potential level for a rebound.
The bullish outlook would be further reinforced if the price breaks out above 0.8130 and sustains its position above the bearish trendline. Conversely, a decisive break below 0.8040 would invalidate the short-term bullish view.
The above analysis reflects a personal perspective and does not constitute investment advice.
USDCHF: Bullish Continuation Confirmed 🇺🇸🇨🇭
I see a valid bullish change of character on USDCHF on an hourly time frame
after the price tested a solid rising trend line on a daily time frame.
It indicates a highly probable coming bullish continuation.
Goal - 0.81
❤️Please, support my work with like, thank you!❤️
I am part of Trade Nation's Influencer program and receive a monthly fee for using their TradingView charts in my analysis.
USD/CHF: THE 0.80680 SUPPORT REJECTION & FLUSH!
Pushing up toward local resistance at 0.80942! Are you blindly buying into this red supply zone, or positioning for the sharp rejection down to support? 🤔
USD/CHF is approaching a critical overhead supply zone on this 2-hour OANDA chart. The pair is trading around 0.80942, pushing upward to test its descending Resistance line and red supply block where institutional sellers are waiting to defend price. 📉💥
Look closely at the black blueprint trajectory mapping out the coming sessions. The algorithm is setting up a classic resistance-rejection and markdown sequence:
• A final push up to retest the red supply zone and Resistance line around 0.81100 to trap late breakout buyers. 🪤
• A sharp, high-velocity rejection dumping price down toward the 0.80800 region. ⚡
• A minor reflex bounce up toward 0.80900 to absorb remaining retail bids and confirm lower-timeframe resistance. 🌊
• Final markdown acceleration driving straight down to test the primary Support line resting near 0.80680. 🎯🔻
Maintaining technical patience and discipline remains your ultimate edge in this setup. Chasing long positions directly into a verified overhead supply zone and trendline ceiling is an easy way to get caught on the wrong side of a sharp rejection. Professional desks wait for the rally to hit resistance and exhaust before scaling into short positions alongside the primary flow. 🧘♂️⚡
🛠 Trade Parameters:
🛒 Short Zone: 0.81050 - 0.81150 🧱
🛑 Stop-Loss: 2h close above 0.81300 ❌
💰 Take-Profit: 0.80680 🩸
The retail crowd attempting to chase this push into resistance is driving price straight into institutional sell orders. Stay focused, strictly manage your risk, and let the algorithm carry the trade down to our target floor.
Maintain your composure through the waves, and we will see you down at the 0.80680 support floor! 🚀💎
USDCHF Bearish Setup Hello Everyone
Monthly Liquidity has occurred so expect some huge swings up and down but bearish overall, red folder tomorrow as well
1. Monthly levels can be a big deal use proper sizing to stay in the move
2. light purple zone is the best possible entry.
3. Home run PT is for the runners, but i will be happy at Pt1
Always Use Proper Risk Management, I always scale into my positions to get best Optimal entry if possible to increase RR.
USDCHF Short: Possible bullish structure breakThe market ran eight straight days higher and higher into the Fed decision, printing higher highs and higher lows from the 0.8010 low all the way to the top at 0.8210. Then the release hit and price collapsed in one impulsive bearish wave, breaking back below the old highs at 0.8139-0.8152, and also the latest two higher lows. Price pulled back into this broken area and rejected over the low timeframes. That was my entry. Trade levels on the chart.
Short from 0.81410, stop above the zone at 0.8157.
Reasons:
- Failed breakout above the monthly highs.. price is back inside the old range.
- Old resistance band at 0.8139 broken during the rally, now retested from below and rejected on lower timeframe , short trigger.(holding below this level would increase my chances).
- The drop from the top looks impulsive, the pullback into my zone could be a just a retest.
- On the fundamental side, the Fed held rates with inflation still elevated, three members dissenting for a hike, and no clear forward guidance from the chair. The market read it as a credibility problem(Political influence "Trump") and sold the dollar across the board, while falling stocks give the franc its safe haven demand.
First target at 0.8115, just at the mid-July structure. Second target at 0.8070, just above the the next potential support area around at 0.8066-0.8060.
If price closes back above 0.81570 I'm out..
Lets see how the trade progress.
USD/CHF: External Expansion Target (1.414 – 1.618)
Price is seeking external expansion towards the target levels of 1.414 and 1.618. Expecting a push through the pullback leg heading straight into the upper POI zones.
🎯 Fix 100%: Around 0.81110 (1.414 external extension level).
🚫 Idea Invalidation: Candle close below 0.80560 (invalidation of the support zone).
🚀 Drop some rockets for this setup!
Subscribe and share your thoughts in the comments!
USDCHF Nears Resistance — Is the Bounce Running Out of Steam?USDCHF is showing a steady recovery, but the next challenge is becoming clear as price moves closer to a resistance area that has repeatedly attracted selling pressure in the past.
The recent bullish momentum is still intact, so I would not rush into a short position yet. What I want to see first is whether buyers begin to struggle once price reaches resistance. A clear rejection, fading momentum or a bearish reversal pattern would be the first sign that sellers are returning.
If that reaction appears and resistance continues to hold, USDCHF could turn lower toward 0.81000.
If buyers manage to push through the resistance and keep price above it, the bearish idea would no longer be attractive and the recovery could continue.
For now, the setup is more about patience than prediction. Let price reach the area, watch how it reacts, and only then decide whether sellers truly have control.
This is only my technical view, not financial advice. Always confirm your setup and manage risk carefully.
Watching price approach pullback support?Swissie (USD/CHF) is falling towards the pivot, which acts as a pullback support that is slightly above the 50% Fibonacci retracement and could bounce towards the 1st resistance.
Pivot: 0.8001
1st Support: 0.7913
1st Resistance: 0.8119
Disclaimer:
The opinions given above constitute general market commentary and do not constitute the opinion or advice of IC Markets or any form of personal or investment advice.
Any opinions, news, research, analyses, prices, other information, or links to third-party sites contained on this website are provided on an "as-is" basis, are intended to be informative only, and are not advice, a recommendation, research, a record of our trading prices, an offer of, or solicitation for, a transaction in any financial instrument and thus should not be treated as such. The information provided does not involve any specific investment objectives, financial situation, or needs of any specific person who may receive it. Please be aware that past performance is not a reliable indicator of future performance and/or results. Past performance or forward-looking scenarios based upon the reasonable beliefs of the third-party provider are not a guarantee of future performance. Actual results may differ materially from those anticipated in forward-looking or past performance statements. IC Markets makes no representation or warranty and assumes no liability as to the accuracy or completeness of the information provided, nor any loss arising from any investment based on a recommendation, forecast, or any information supplied by any third party.
Rising toward key resistance?USD/CHF is rising toward the resistance level, which is an overlap resistance that aligns with the 127.2% Fibonacci extension and could reverse from this level to our take profit.
Entry: 0.8148
Why we like it:
There is an overlap resistance level that aligns with the 127.2% Fibonacci extension.
Stop loss: 0.8206
Why we like it:
There is a pullback resistance level.
Take profit: 0.8065
Why we like it:
There is a pullback support level.
Enjoying your TradingView experience? Review us!
Please be advised that the information presented on TradingView is provided to Vantage (‘Vantage Global Limited’, ‘we’) by a third-party provider (‘Everest Fortune Group’). Please be reminded that you are solely responsible for the trading decisions on your account. There is a very high degree of risk involved in trading. Any information and/or content is intended entirely for research, educational and informational purposes only and does not constitute investment or consultation advice or investment strategy. The information is not tailored to the investment needs of any specific person and therefore does not involve a consideration of any of the investment objectives, financial situation or needs of any viewer that may receive it. Kindly also note that past performance is not a reliable indicator of future results. Actual results may differ materially from those anticipated in forward-looking or past performance statements. We assume no liability as to the accuracy or completeness of any of the information and/or content provided herein and the Company cannot be held responsible for any omission, mistake nor for any loss or damage including without limitation to any loss of profit which may arise from reliance on any information supplied by Everest Fortune Group.
Price near key support?Swissie (USD/CHF) is falling to the pivot, which is an overlapping support that aligns with the 127.2% Fibonacci extension and is also slightly below the 61.8% Fibonacci projection and could bounce towards the 1st resistance.
Pivot: 0.8011
1st Support: 0.7956
1st Resistance: 0.8103
Disclaimer:
The opinions given above constitute general market commentary and do not constitute the opinion or advice of IC Markets or any form of personal or investment advice.
Any opinions, news, research, analyses, prices, other information, or links to third-party sites contained on this website are provided on an "as-is" basis, are intended to be informative only, and are not advice, a recommendation, research, a record of our trading prices, an offer of, or solicitation for, a transaction in any financial instrument and thus should not be treated as such. The information provided does not involve any specific investment objectives, financial situation, or needs of any specific person who may receive it. Please be aware that past performance is not a reliable indicator of future performance and/or results. Past performance or forward-looking scenarios based upon the reasonable beliefs of the third-party provider are not a guarantee of future performance. Actual results may differ materially from those anticipated in forward-looking or past performance statements. IC Markets makes no representation or warranty and assumes no liability as to the accuracy or completeness of the information provided, nor any loss arising from any investment based on a recommendation, forecast, or any information supplied by any third party.
Falling toward 50% Fib support?Swissie (USD/CHF) is falling towards the pivot, which has been identified as an overlap support that aligns with the 50% Fibonacci retracement and could bounce toward the 1st resistance.
Pivot: 0.7994
1st Support: 0.7917
1st Resistance: 0.8128
Disclaimer:
The opinions given above constitute general market commentary and do not constitute the opinion or advice of IC Markets or any form of personal or investment advice.
Any opinions, news, research, analyses, prices, other information, or links to third-party sites contained on this website are provided on an "as-is" basis, are intended to be informative only, and are not advice, a recommendation, research, a record of our trading prices, an offer of, or solicitation for, a transaction in any financial instrument and thus should not be treated as such. The information provided does not involve any specific investment objectives, financial situation, or needs of any specific person who may receive it. Please be aware that past performance is not a reliable indicator of future performance and/or results. Past performance or forward-looking scenarios based upon the reasonable beliefs of the third-party provider are not a guarantee of future performance. Actual results may differ materially from those anticipated in forward-looking or past performance statements. IC Markets makes no representation or warranty and assumes no liability as to the accuracy or completeness of the information provided, nor any loss arising from any investment based on a recommendation, forecast, or any information supplied by any third party.
Bullish bounce for the Swissie?The price is falling to the support level, an overlap support and could bounce from this level to our take profit.
Entry: 0.8011
Why we like it:
There is an overlap support level.
Stop loss: 0.7957
Why we like it:
There is a pullback support that aligns with the 145% Fibonacci extension.
Take profit: 0.8092
Why we like it:
There is a pullback resistance level.
Enjoying your TradingView experience? Review us!
Please be advised that the information presented on TradingView is provided to Vantage (‘Vantage Global Limited’, ‘we’) by a third-party provider (‘Everest Fortune Group’). Please be reminded that you are solely responsible for the trading decisions on your account. There is a very high degree of risk involved in trading. Any information and/or content is intended entirely for research, educational and informational purposes only and does not constitute investment or consultation advice or investment strategy. The information is not tailored to the investment needs of any specific person and therefore does not involve a consideration of any of the investment objectives, financial situation or needs of any viewer that may receive it. Kindly also note that past performance is not a reliable indicator of future results. Actual results may differ materially from those anticipated in forward-looking or past performance statements. We assume no liability as to the accuracy or completeness of any of the information and/or content provided herein and the Company cannot be held responsible for any omission, mistake nor for any loss or damage including without limitation to any loss of profit which may arise from reliance on any information supplied by Everest Fortune Group.