US Dollar vs. Offshore Chinese Yuan
No trades
No trades
In-depth trading ideas
USDCNH: Buy Setup Based on Ending DiagonalLast month I posted my favorite pattern Ending Diagonal
which played out perfectly on USDCNH
Why I like it? Because it shows the reversal and hence the risk is minimum
against the peak or valley
This time I share with you the buy setup based on this pattern
Background: we see the first passing move to the upside
and the following correction, so this is the perfect time to consider the entry
Buy trigger: on the breakup of peak of first passing move above 6.8195
Stop after trigger: once entry triggered, consider setting the stop below the valley, it can be lower than we see now, now it's at 6.7806
Target: minimum target is at the beginning of Ending Diagonal at 6.9437
Risk/reward ratio is above 3, which is healthy
Market Overview — 30.06Good morning team
Let’s quickly go over the key news for today — the things that could actually impact today’s trading.
First of all, we need to pay attention to China. Overnight, they conducted another repo operation and injected more liquidity into the economy. As you can already see this morning, the yuan is strengthening quite sharply.
That creates opportunities in the short term. It’s very possible these operations will continue, and the People’s Bank of China will keep supporting both the economy and the national currency. That’s definitely something we can use in trading.
We’re expecting something similar from the Bank of Japan today as well. The Japanese yen is sitting at a 40-year low right now — around 162 yen per dollar, if I’m not mistaken. That’s extremely weak.
And in situations like this, as you know, the Bank of Japan often steps in with currency intervention. They enter the market, sell dollars and other foreign reserves, and support the yen.
I’ve traded these Japanese interventions many times before, and right now we’re watching closely for another one.
Meanwhile, the dollar continues showing very strong momentum.
At this point, many major analysts are starting to agree that Kevin Warsh may have gone too far with his rhetoric. He’s been signaling rate hikes very aggressively, and the market is now pricing in the possibility of significant tightening.
That’s giving strong support to the dollar.
But an overly strong dollar creates as many problems as advantages.
And the reality is, inflation in the U.S. isn’t so high right now that it clearly demands extremely aggressive action. So the market is still uncertain about what happens next.
Will rates actually be raised, or not?
That means any data related to inflation, economic activity, or the labor market in the U.S. will now have a huge impact on the dollar — and through the dollar, on nearly every major market.
Today, for example, we’re getting job openings data.
This is an important release.
And for markets right now, weaker data is actually better.
Let me explain.
If labor market data comes in weaker, the probability of rate hikes goes down.
But if the labor market remains very strong — strong job creation, low unemployment, tight labor conditions — that gives the Federal Reserve and Warsh more room to raise rates.
Because if the economy is strong and the labor market is strong, then they can justify tighter monetary policy.
So today, weaker labor data would actually be bullish for risk assets, because it reduces the probability of aggressive rate hikes.
Also on today’s calendar, we have GDP data from Canada.
Depending on the numbers, we may get some interesting trading opportunities in the Canadian dollar as well.
And one more story that isn’t moving markets right now, but is still very important.
According to reports from sources involved in the ongoing negotiations, Iran is pushing for the right to charge fees for ships passing through the Strait of Hormuz.
That would be a huge issue.
Under international trade law, natural straits are generally considered open transit routes, and countries are not supposed to charge tolls for passage.
Iran is trying to justify this by referencing the Suez Canal and the Panama Canal.
But that comparison doesn’t really work.
Those are artificial canals built with massive infrastructure, so it makes sense that transit fees exist there.
The Strait of Hormuz is a natural waterway.
Historically, natural straits have not been subject to transit fees under global trade rules.
And this is something Donald Trump simply cannot agree to.
No matter how badly he wants to end this conflict, allowing Iran full control over shipping through Hormuz would look like a clear strategic defeat for the U.S.
If Iran keeps insisting on this demand, negotiations could drag on significantly longer.
And that increases the risk of military escalation.
We’re already seeing more frequent exchanges of fire.
If Iran continues pushing impossible demands, the probability of military action resuming definitely rises.
So this is another key risk factor we need to monitor closely.
Overall, there’s a lot happening today across multiple currencies and markets.
There are plenty of interesting setups on the table.
I’ll share all trading ideas in the private community as usual.
Wishing everyone a great trading day.
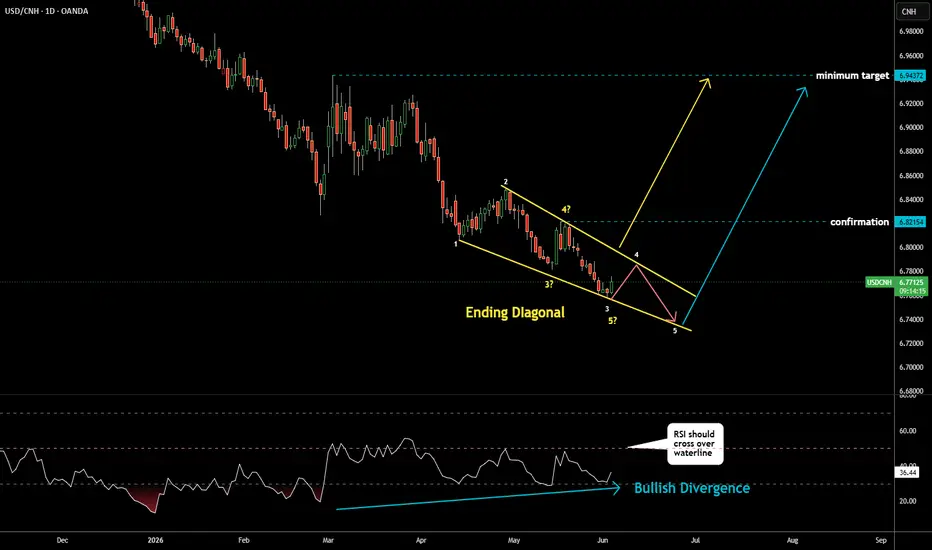
USDCNH: My Favorite Pattern Plays outAt the beginning of the month I posted my favorite pattern Ending Diagonal
that was in the making on USDCNH chart
Now it plays out as the price triggered the confirmation level
as well as the Bullish Divergence on RSI chart that supported the breakout
moving above the 50 "waterline"
6.9437 is the minimum target where this Ending Diagonal started
6.7538 is the invalidation level where this pattern bottomed
USDCNH: Ending Diagonal I spotted my favorite ew pattern - Ending Diagonal (yellow lines) on USDCNH chart
It is a harbinger of soonest trend reversal
In this case we can see the rally of dollar
RSI already shows Bullish Divergence
There are two options:
1) white marks show that we completed 3 waves and gonna see wave 4 and 5
(pink zigzag)
2) yellow marks consider the full completion of all 5 waves and we are about
to take off in the rally
both options are viable as meet requirements
Confirmation is above 6.8216
RSI should cross over the 50 "waterline"
Minimum target is set at the top of Ending Diagonal at 6.9437
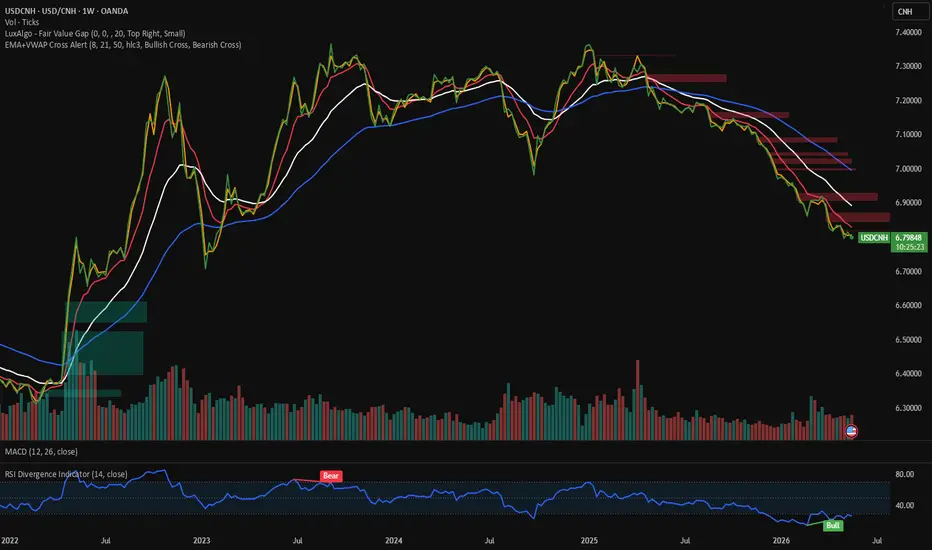
USDCNH Multi-Year Breakdown: The Petro-Yuan is HereThe weekly chart for USDCNH is telling the real macroeconomic story
of 2026, and most of the market is completely missing it.
While the DXY crushes allied currencies (with USDJPY pushing 159), the
Chinese Yuan has been steadily strengthening against the dollar for
nearly three years. We are now sitting below 6.80.
Look at the two key pivot points on this weekly chart:
1. April 2025: Tariff announcements sparked a brief panic spike to
~7.40. The market immediately rejected this, using the tariffs as
cover to accelerate Yuan internationalization.
2. February/March 2026: The downtrend accelerates violently, slicing
through support. This correlates perfectly with the Iran conflict.
This 8% move is an earthquake for a managed float. What we are seeing
is the real-time structural shift of the Petro-Yuan. China secured
exclusive Hormuz access, bypassed the dollar for energy settlement,
and is importing deflation while the West imports inflation.
Notice the RSI repeatedly flipping bullish at the bottom of this
downtrend—momentum is accelerating, not exhausting. The geopolitical
chess pieces are moving, and it is showing up directly in the forex
data.
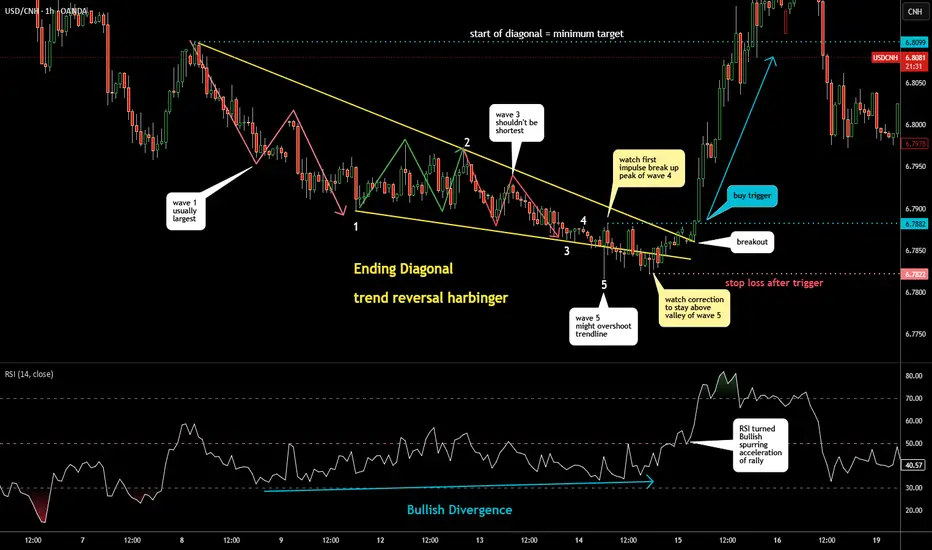
How to trade Ending Diagonal: Visualisationthis is my most favorite EW pattern
it is called Ending Diagonal
it appears at the very end before trend reversal
it consists of 5 waves down (white labels) but each of waves
are not regular 5-wave sequences but 3-wave ABC structures
zigzags of red and green colours show it
wave 1 is usually the largest - it is in the chart
wave 3 should not be the shortest - and it is not in the chart
wave 5 is the smallest and sometimes overshoots the trendline support like we see
in the chart
How to trade it?
Signals
watch RSI making a Bullish Divergence
for the initial signal, watch how first bullish impulse breaks up the peak of wave 4
then wait for retracement, which should stay above the valley of wave 5
Trigger
the final trigger is set at the peak of that first impulse which crossed over the top of wave 4
when the price surpasses it after retracement it is good to buy
Reward and Risk
target is set at the start of the Ending Diagonal (it's the peak of wave 4 of higher degree)
stop should be put a the bottom of retracement preceding the trigger
USDCNH Bottoming possibility Updating from 25 2025 November: breakdown from the triangle unfolded into wave c and have shown support and lack of downward momentum, The presence of a downward diagonal suggests high probable end of the current trend in the making.
The presence of a divergence from the MACD augments the probability and wave c @ 0.941% of wave a also provide support.
The market has not change trend as yet. we need to let the market unfold itself and certainly not take a bearish view at this point.
USDCNH - Short On Peace Hopes & BoJ Intervention TriggerNarrative: US suspended military campaign, hopes to solve the conflict through negotiations. The Fed is more restrictive than the PBoC, which supports USD yield advantage. But the PBoC is not aggressively cutting, and China’s stronger Q1 data reduces immediate depreciation pressure on CNY. However the focus now is on geopolitics, which drives the pair down.
Sentiment: BoJ Intervention and Peace talks triggered USD weakness
Pattern: TC(B)
Time: Tokyo Close
*Seasonally strong starting on May 8
USDCNH - Yuan Strength? Not Lovin' It.Narrative: Fed is more Hawkish vs PBoC (Fed: even some mentions of one hike; PBoC: conditional cuts due to possible infl. pressures, solid hold for a while)
Sentiment: Risk-off on Iran war (USD is a top safe haven asset now)
Pattern: TR(M)
Time: London opening
*Chinese authorities wouldn't be interested to keep yuan too elevated for an extended time - it hurts exports.
*China is quite exposed to oil imports through the Strait of Hormuz
*Seasonals support USDCNH upside
USDCNH Lower Timeframe Bullish Reversal | Counter-Trend PlayWhile the overall higher timeframe trend for USDCNH is undeniably bearish, we are seeing some compelling counter-trend opportunities developing on the lower timeframes.
Here is the breakdown for this short-term setup:
The Signal: We have spotted a clear bullish reversal pattern on the lower timeframes, signaling a temporary exhaustion in the downtrend.
The Expectation: We are anticipating a short-term bullish push to the upside as price retraces. There are two potential targets: the immediate retest area, or a higher structural retest area.
The Strategy: We are taking the conservative route. Rather than holding out for the higher resistance, we are targeting the immediate, most probable retest area.
Yuan looks overheated. Time for a pullback?The Yuan is currently oversold, and price is anticipating a technical rebound in OANDA:USDCNH toward the 6.955 . This move is likely to be driven by institutional profit-taking and the fundamental need to stimulate China's manufacturing sector
Technicals:
1. Fibonacci & Historical Support: After a prolonged, one-way move from 7.37 , the price has found support within the 1.272–1.382 Fibonacci extension zone. This area perfectly aligns with the key support/resistance levels established back in June 2019.
2. Local Reaction: We’ve seen a clear rejection from the local level of 6.84 . While this isn't enough to signal a full trend reversal yet, it is a sufficient catalyst for a localized correction.
3. Institutional Activity: There is evidence of mid-term position squaring by institutional players, which typically precedes a retracement.
4. TVC:DXY Correlation: A potential strengthening of the US Dollar Index (DXY), coupled with the Yuan's technical exhaustion, could sharpen the upward corrective move.
5. Target Zone: My primary target is the 0.236 Fibonacci retracement level, near the 2016 support/resistance zone. Once hit, I expect a price reaction and a potential resumption of the global bearish trend (Yuan strengthening).
Fundamentals:
1. Export Competitiveness: While a strong Yuan benefits imports (China's focus in 2025), it hampers the export-oriented manufacturing sector. Excessive inventories and overproduction relative to global demand could inadvertently push the economy toward stagflation if the currency remains too high.
2. Real Estate Drag: The property sector continues to underperform forecasts. This ongoing weakness threatens to depress consumer spending and slow overall economic growth, necessitating a slightly weaker currency to buffer the impact.
Risks:
1. The People's Bank of China (PBOC) may opt for more aggressive foreign exchange interventions to stabilize the yuan's exchange rate.
2. The US Dollar Index could exhibit weakness amid geopolitical instability instead of the anticipated strengthening.
Conclusion:
- Direction: Counter-trend Long (betting on Yuan weakening)
- Entry Point: 6.8594
- Target:
- Stop-Loss: Below the 1.382 Fib extension at 6.82
Upon reaching the target, I will monitor price action closely for signs of a reversal to rejoin the global downtrend
Scenario is invalidated if any of risks occur or or we see a weekly close below 6.8267
# - - - - -
Good Luck! ☺️
# - - - - -
DISCLAIMER: Not financial advice. Everyone must make trading decisions at their own risk, guided only by their own criteria and strategy for opening or not opening a trade
The 3-Step Rocket Booster Strategy -Short SellThe fed interest rate decision is this
week..
and i don't know whether they
will drop it or not.
But i think this is why
the dollar is crashing..
The rocket booster strategy
is a classic strategy
its combined of 3 steps:
1-The price has to be below the 50 ema
2- The price should be below the 200 ema
3- The price should gap down on positive volume thats your entry
even-though in this price action
there is no clear gap down
the price hit a new 52 week low.
This is a simple strategy
and thats why i enjoy sharing it
with you
Rocket boost this content to learn more.
Disclaimer:Learn risk managment
and profit taking strategies
also use a simulation trading account
before you trade with real money
Dollar or Chinese Yuan - Macro View1) What does “global reserve currency” actually require?
A currency becomes the main reserve when central banks, global companies, and investors want to hold it and use it, because it has:
-Deep, liquid safe assets (huge bond market people trust and can trade easily)
-Open capital markets (you can move money in/out freely)
-Rule of law + credible institutions (low “policy surprise” risk)
-Convertibility (easy to swap into other currencies)
-Network effects (everyone uses it because everyone uses it)
-Stable inflation + credible central bank
-Geopolitical and military power (matters for trust and enforcement)
The USD wins today mainly because the US has the world’s deepest “safe asset” market (US Treasuries), strong market infrastructure, and global network effects.
2) Disruptions in current USD holdings:
-China has reduced its US Treasury holdings over time (this is visible in US Treasury TIC data and frequently reported). But many countries still hold lots of Treasuries because there’s no other market as deep/liquid for reserves.
-US debt (total federal debt) has exceeded $34T and later moved higher; it changes constantly. The debt ceiling is a legal limit set by Congress, and it has been suspended/changed multiple times. So: “debt” ≠ “debt ceiling.”
-Interest repayment could pose a problem: That concern is real in the sense that rising debt + higher rates increases net interest costs. The CBO has repeatedly flagged net interest costs as a growing part of the budget over time.
-Russia and China are dealing more in CNY: Since sanctions and financial restrictions, Russia has shifted a lot of trade/finance toward yuan usage, including yuan-denominated financing and trade settlement.
-BRICS / Brazil used CNY instead of dollars to trade with China: There was a widely reported Brazil–China push to settle trade in local currencies (incl. yuan) and build mechanisms to do so.
3) Could the USD lose reserve status?
Yes, but it would likely be slow, unless there’s an extreme crisis.
Why USD is still hard to replace:
Even critics of US policy keep using USD because:
-Treasuries are still the biggest “safe collateral” system in the world
-Most global trade/finance is built on USD plumbing
-In crises, money often rushes into USD assets (liquidity + habit)
What could seriously weaken USD dominance:
-A long period of high inflation or fiscal instability
-Political dysfunction that threatens debt servicing credibility
-Weaponization of the dollar system via sanctions causing more countries to build alternatives (such as US dollars seized from Russia during the 2022 war with Ukraine)
-A credible competitor offering the same benefits (so far, no one does)
Important : high debt alone doesn’t automatically end reserve status, Japan has very high debt too. The question is whether markets believe the state can fund itself and keep inflation contained.
4) Could the CNY become the new global reserve?
It can grow as a regional / alternative reserve currency, but becoming the main global reserve is difficult under current conditions.
Why the CNY is growing
-China is a top global trading partner
-Some trade is being settled in yuan
-Some countries want to reduce USD exposure for political reasons
Barriers for CNY:
-Capital controls: China still manages cross-border money flows (reserve currencies usually require free movement).
-Convertibility + transparency: global reserve holders want maximum legal predictability and minimal intervention risk.
-Safe asset depth: the US Treasury market is uniquely large and liquid. China’s government bond market is large, but international “trust + access” is not the same.
China may not want it fully
-If the yuan became the top reserve, global demand could push it up, hurting exports. China would also lose some control over domestic financial stability if it opened everything up.
5) Could the Euro replace the USD?
It has structural limits:
-No single EU equivalent of “one unified Treasury market” like the US (fragmentation across member-state bonds)
-Political/fiscal integration is incomplete (shared budget + safe asset supply is limited)
-Past sovereign debt stress made some reserve managers cautious
6) What the data says right now:
-Reserve shares are still heavily USD-dominant: The USD remains the largest share of reported global FX reserves, with the euro second and the yuan much smaller.
-In payments, the RMB has grown but remains far behind USD and EUR.
This supports the idea that “de-dollarization” is happening at the margins, but not a full regime change yet.
7) So what’s the most realistic outcome?
More likely than a single new “king currency”:
-A multipolar system
-USD still #1, but with gradual diversification
-More trade in EUR/CNY/local currencies in specific blocs
-More hedging against sanctions and payment-system dependency
-USD loses dominance only under two conditions:
A)The US seriously damages confidence in Treasuries/dollar stability
B)A competitor offers comparable openness, trust, and liquidity (hard)
Disclaimer:
This analysis is for informational and educational purposes only and does not constitute financial advice, investment recommendation, or an offer to buy or sell any securities. Asset prices, valuations, and performance metrics are subject to change and may be outdated. Always conduct your own due diligence and consult with a licensed financial advisor before making investment decisions. The information presented may contain inaccuracies and should not be solely relied upon for financial decisions. I am not a licensed financial advisor or professional trader. I am not personally liable for your own losses; this is not financial advice.
USDCNH -Rising WedgeUSDCNH has shown a breakdown from a rising wedge and am waiting to see if an accelerated move to the downside can occur.
The guideline would be for prices to return to the widest part of the wedge.
The September 2025 breakdown from the lower line saw a rebound to the underside which is a classic textbook application, and it exhibits swing low reinforces the probability of further downside.
The 3 markings are possible projections. Watch how it unfolds to determine the support level.
USDCNH Wave Analysis – 31 October 2025- USDCNH reversed from key support level 7.0890
- Likely to rise to resistance level 7.145
USDCNH currency pair recently reversed from the support area between the key support level 7.0890 (which stopped the previous impulse wave 1 in the middle of September) and the lower daily Bollinger Band.
The upward reversal from this support area created the daily Japanese candlesticks reversal pattern Morning Star – strong buy signal for USDCNH.
Given the strength of the support level 7.0890, USDCNH can be expected to rise toward the next resistance level 7.145 (former support from July, which stopped earlier waves iv, a and 2).
USD/CNH Break Lower Could Target 7.0000Is a possible reset in relations between the world’s two most powerful nations about to see the Chinese yuan strengthen sharply? USD/CNH is coiling in a descending triangle formation, and the risk of a break lower is arguably increasing—even if the reset proves short-lived.
After breaking beneath the 50-day moving average on August 28, USD/CNH tried twice to reclaim the level earlier this month but failed to sustain the move. The pair has since resumed its push lower, leaving it teetering on support at 7.1000 today. The last time USD/CNH attempted to break beneath this level, it triggered a sharp reversal, printing a hammer candle on the daily chart that marked the start of a squeeze higher.
While that move failed, this one may have more success, arriving just before a likely trade deal between the U.S. and China on the sidelines of the APEC summit in South Korea later this week. There’s always the risk the framework could unravel quickly, but the backdrop screens as supportive for the yuan: the Fed is widely expected to cut rates again while retaining a dovish bias, and risk appetite is strong across Asia.
Given the triangle pattern, a close beneath 7.1000 may spark a fresh wave of selling, putting the pair on track for a possible move toward the psychologically important 7.0000 level, based on the height of the triangle.
Shorts could be considered below 7.1000 with a stop above, targeting the September 17 low of 7.0850 initially. Beneath that, price action at 7.0600 and 7.0400 may provide clues as to whether the ultimate target of 7.0000 is likely to be reached.
Momentum indicators are generating strengthening bearish signals. RSI (14) is trending lower below 50 but is not yet oversold. MACD has confirmed by staging a bearish crossover of the signal line in negative territory, indicating downside pressure is building.
Good luck!
DS
China Yuan Direction & Critical Dollar SupportThe US dollar is still the leading global payment currency, holding a significant share of 49% compared to all other currencies.
However, the Chinese yuan is on the rise. Although it currently accounts for only 3.5%, its growth over the past two years has drawn my attention.
The yuan’s share increased from 2% in 2023 to 3.5% this year, representing a 75% increase in just 2 years.
And for global commerce, the growth is even more striking:
“In trade, 6% of global commerce was financed in RMB last year, up from under 2% in 2023.”
This represents a 200% increase in the use of the yuan for trade in also just 2 years.
If the yuan continues to grow at the same pace — at a 75% increase every 2 years —
it would take roughly 11 to 12 more years to reach 49%, i.e., around the year 2036.
Video version for the statistics:
Offshore Chinese Renminbi Futures and Options
Ticker: CNH
Minimum fluctuation:
Outright:0.0005 per USD increment = 50 CNH
Disclaimer:
• What presented here is not a recommendation, please consult your licensed broker.
• Our mission is to create lateral thinking skills for every investor and trader, knowing when to take a calculated risk with market uncertainty and a bolder risk when opportunity arises.
CME Real-time Market Data help identify trading set-ups in real-time and express my market views. If you have futures in your trading portfolio, you can check out on CME Group data plans available that suit your trading needs www.tradingview.com