USDJPY Bullish Breakout | Support Holding Strong (1H)
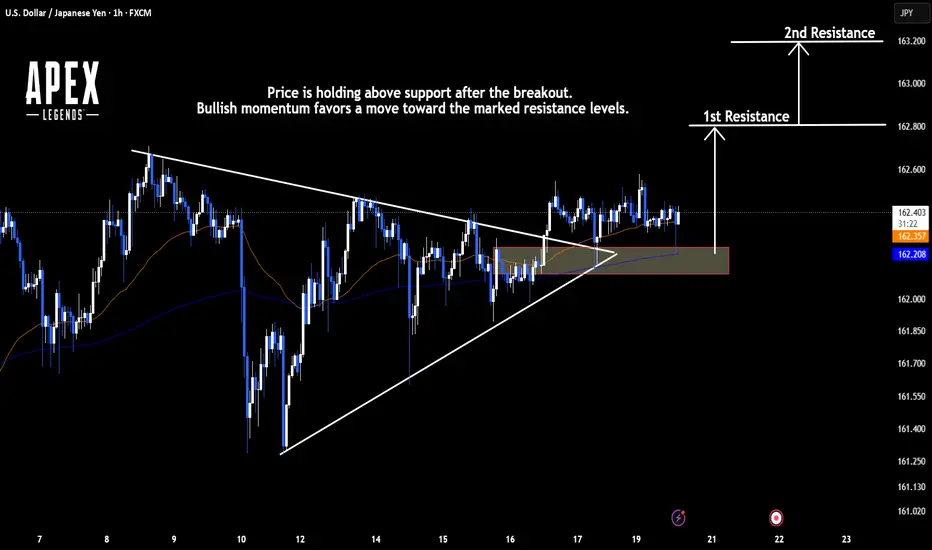
USDJPY is holding firmly above the highlighted support zone after breaking out of the triangle pattern. Buyers remain in control, increasing the probability of a continuation toward higher resistance levels.
The overall market structure remains bullish while price trades above support.
Key Levels:
* ๐ข Support: 162.10 โ 162.20
* ๐ด 1st Resistance: 162.80
* ๐ด 2nd Resistance: 163.20
* ๐ Bias: Bullish above support.
Analysis:
As long as price holds above the marked support zone, buyers could push the market toward the first resistance. Continued bullish momentum may extend the move toward the second resistance. A confirmed breakdown below support would invalidate the bullish scenario.
โ ๏ธ Educational purposes only. Always use proper risk management before entering any trade.
US Dollar / Yen Perpetual Quanto Swap Contract
No trades
No trades
In-depth trading ideas
๏ปฟUSDJPY - Bullish Trend Retesting Channel Support?USDJPY has remained overall bullish, trading within the rising channels marked in blue and red, with buyers continuing to maintain control of the broader trend. ๐
Price is now approaching a high-confluence support area, formed by the intersection of:
- The lower bound of the blue rising channel.
- The green demand zone.
๐ As long as this confluence continues to hold , we will be looking for trend-following long setups, expecting the broader bullish trend to resume and the next impulsive move higher to develop.
As always, rather than buying blindly into support, we will wait for bullish confirmation before considering any long positions.
Will buyers defend this key confluence and push USDJPY toward fresh highs? ๐ค
โ ๏ธ Disclaimer: This is not financial advice. Always do your own research and manage risk properly.
๐ Stick to your trading plan regarding entries, risk, and management.
Good luck! ๐
All Strategies Are Good; If Managed Properly!
~Richard Nasr
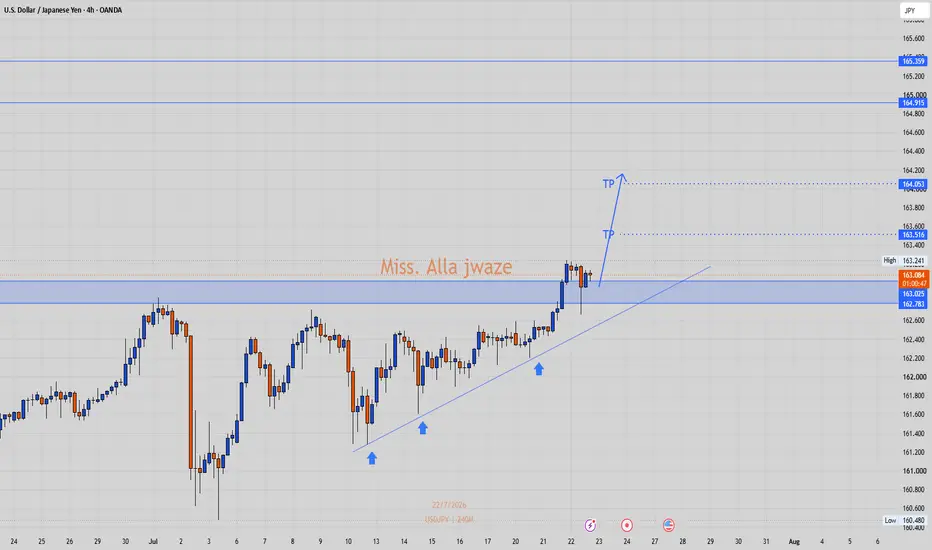
USDJPY pushing higherWe can see USDJPY continuing to push higher with clear bullish pressure.
After the latest impulsive move, price has broken above an important resistance zone. This attempt looks stronger than the previous tests, with cleaner momentum and larger bullish candles showing that buyers are acting with conviction.
From here, I would expect a brief pullback into the broken zone before the next leg higher. If buyers manage to defend it as support, USDJPY could continue toward the 164.000 target.
USDJPY 30Min Engaged ( Bullish Reversal Detected )HANZO MARKET LIQUIDITY REPORT
USDJPY
Timeframe: 30min (Volume Basis)
Scale: Higher Timeframe Context / Deep Volume analysis
โโโโโโโโโโโโโโโโโโโโโโ
Market Observation
This analysis is focusing on structural behavior, liquidity zones, Volume analysis
and key areas of interest within the current range.
โโโโโโโโโโโโโโโโโโโโโโ
Market Bias
Full liquidity Map
โโโโโโโโโโโโโโโโโโโโโโ
๐ฅBearish Reversal
Key Volume Zone : 163.120 Area
โโโโโโโโโโโโโโโโโโโโโโ
Structure Factors:
โข Higher timeframe Volume reaction level
โข High-volume / Hidden
โข Range Defend structure
โข Volume Stacking
โข Quarter Volume
USDJPY Tests Key Resistance โ Is 162.500 Next?USDJPY has rallied back into a major resistance zone, an area where sellers have repeatedly stepped in and capped previous advances. This is an important level because price has struggled to establish acceptance above it in the past.
The recent bullish momentum is clear, but chasing the move here doesn't offer a favorable risk-to-reward. Instead, I'll be watching closely for signs that buyers are losing strength. A bearish rejection candle, long upper wicks, or a failed attempt to break above resistance would all strengthen the case for a pullback.
If sellers successfully defend this zone, I expect USDJPY to retrace toward the 162.500 area. However, if price breaks cleanly above the resistance and holds there, the bearish idea would be invalidated and buyers could extend the uptrend.
This is simply my market view, not financial advice. Always wait for confirmation before acting and manage your risk carefully.
USD/JPY Bullish BOS Targets Weak High LiquidityMarket Thesis:
USD/JPY maintains a bullish intraday structure on the 15-minute timeframe, supported by successive bullish CHoCH and BOS signals. Price has broken above the recent consolidation and is now trading directly beneath the marked Weak High at 162.672, making that liquidity level the immediate objective.
The bullish bias remains valid while price holds above the 162.390โ162.420 demand area and the marked Strong Low near 162.400.
Visible Confluences โ 15-Minute Chart:
Current price: approximately 162.642.
Bullish BOS confirmed above approximately 162.590โ162.600.
Immediate buy-side liquidity: Weak High at 162.672.
Recent consolidation range: approximately 162.450โ162.540.
Primary marked demand zone: 162.390โ162.480.
Protected structural level: Strong Low near 162.400.
Secondary marked demand zone: approximately 162.100โ162.160.
Deeper support zones remain visible around 162.030โ162.090 and 161.890โ161.970.
Multiple LuxAlgo bullish BOS and CHoCH signals confirm improving upward order flow.
Repeated EQH/EQL markings inside the prior range indicate liquidity accumulation before the latest expansion.
Trade Scenarios:
Setup 1: Bullish Breakout Continuation
Direction: Buy
Entry Zone: 162.675โ162.690
Trigger: A confirmed 15-minute close above 162.672, followed by a successful retest or strong bullish momentum candle.
Stop Loss: 162.585
TP1: 162.750
TP2: 162.820
TP3: 162.900
This setup requires genuine acceptance above the Weak High. Avoid entering solely on an intrabar spike.
Setup 2: BOS Retest Buy
Direction: Buy
Entry Zone: 162.575โ162.605
Trigger: Lower-timeframe bullish CHoCH, rejection wick, or displacement candle after the former BOS level is retested.
Stop Loss: 162.495
TP1: 162.672
TP2: 162.750
TP3: 162.820
This is the preferred continuation setup because it uses the broken structural level as potential support.
Setup 3: Deep Pullback Into Demand
Direction: Buy
Entry Zone: 162.395โ162.445
Trigger: Liquidity sweep below the local range, followed by an LTF bullish CHoCH and recovery above 162.420.
Stop Loss: 162.345
TP1: 162.500
TP2: 162.600
TP3: 162.672
A sustained 15-minute close below 162.390 would weaken the immediate bullish thesis and expose the lower marked demand zones.
Refinement Tip:
For the best Risk/Reward, monitor the identified zones on the 1-minute to 5-minute timeframes. Execute only after a clear structural shift, such as an LTF bullish CHoCH, strong rejection, or momentum displacement. At the current price, chasing directly beneath 162.672 liquidity offers inferior positioning compared with a confirmed breakout or controlled retracement.
โ ๏ธ Disclaimer:
Trading financial markets involves significant risk, and no setup is guaranteed. This analysis reflects the visible 15-minute market structure and probability-based scenarios at the time of observation. It is provided strictly for educational and analytical purposes. Always apply independent confirmation, disciplined position sizing, and predefined risk management.
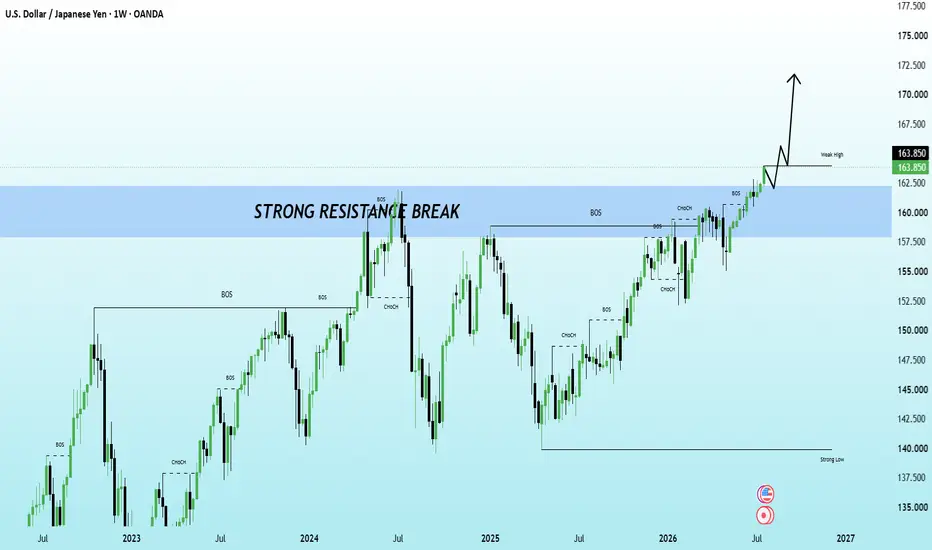
USDJPY: Strong Resistance Broken Is 170+ the Next Target? | SMC USDJPY has successfully broken a major weekly resistance zone, signaling strong bullish momentum. The market continues to print higher highs and higher lows, confirming the bullish structure.
๐ Key Levels:
* โ
Strong resistance flipped into support
* โ
Bullish Break of Structure (BOS)
* โ
Higher High confirmation
* ๐ฏ Potential upside targets: 166.00 โ 170.00 โ 172.00
As long as price holds above the breakout zone, buyers remain in control. A healthy pullback into the blue demand area could provide a continuation opportunity.
โ ๏ธ This is my personal technical analysis, not financial advice. Always wait for confirmation and manage your risk.
USDJPY Trade Setup | Potential SELL Opportunity | 1H TimeframeUSDJPY Trade Setup | Potential SELL Opportunity | 1H Timeframe
USDJPY is currently trading around the 162.500 price region, where the market is approaching a key technical resistance area on the 1-hour timeframe. Recent price action suggests that buying momentum is slowing, while sellers are beginning to show interest at higher levels. If bearish confirmation develops from the current zone, the pair could experience a short-term corrective move toward the downside targets.
Current Market Area: 162.500
Technical Targets:
Target 1: 162.300
Target 2: 162.200
Target 3: 162.100
Technical Analysis
The 1-hour chart indicates that USDJPY is testing an important market area where the next directional move may develop. Price is currently positioned near a resistance zone, creating a potential opportunity for sellers if rejection and bearish momentum appear.
A confirmed rejection from the current level, supported by bearish candlestick formations and increasing selling pressure, could strengthen the downside scenario. A break below nearby intraday support would provide additional confirmation and increase the probability of movement toward the projected targets.
Traders should remain patient and avoid entering positions without proper confirmation. Careful monitoring of price action, market structure, and momentum is essential for identifying quality setups. Professional trading requires disciplined execution, effective risk management, and a clear strategy in all market conditions.
Market Bias: Bearish (Subject to Technical Confirmation)
Timeframe: 1 Hour (1H)
This analysis is based on technical price action, market structure, and key support and resistance levels. It is provided for educational and analytical purposes only and should not be considered financial or investment advice.
USDJPY: Everyone Is Calling The TopโฆAfter reviewing the latest price action alongside the COT Report, seasonality and retail positioning, my higher-timeframe bias remains constructive in the short term.
From a technical perspective, USDJPY continues to print a sequence of higher highs and higher lows on the Daily timeframe. Price is respecting the ascending channel and continues to trade above the previous breakout structure, confirming that buyers are still in control.
That said, the pair is now trading deep inside a premium pricing zone while approaching the 1.5 Fibonacci extension. This is typically not an area where I look to initiate new long positions. Instead, I begin monitoring for signs of exhaustion and potential distribution.
The Daily Breaker located around the 160.00โ160.50 area remains, in my opinion, the most attractive objective should the market transition into a corrective phase.
COT Analysis
The Commitment of Traders data continues to support the broader bullish trend.
Large Speculators remain net long the US Dollar, while positioning in the Japanese Yen is still heavily net short, confirming that institutional money continues to favour USD strength over JPY.
Seasonality
Seasonality introduces an important note of caution.
Historically, the end of July and the beginning of August have produced weaker performance for USDJPY across multiple historical datasets.
Retail Sentiment
Retail positioning currently shows approximately 80% of traders holding short positions.
From a contrarian perspective, this continues to favour additional upside before any larger reversal occurs.
My Trading Plan
My preferred scenario is for price to engineer one final liquidity sweep above the recent highs around 164.20โ165.00, trapping additional breakout buyers and forcing late short sellers out of the market.
USDJPY: Buyers defend 163.20; target set at 163.90USDJPY continues to trade within a clear bullish channel on the H3 timeframe and remains above the Ichimoku cloud. Following a strong rally, the price is currently consolidating near short-term highs. As long as the 163.20 level holds, the bullish structure remains intact.
Fundamentally, the USD continues to be supported by expectations that the Fed will maintain higher interest rates for longer, keeping US bond yields elevated. Meanwhile, the BOJ has shown no immediate signs of aggressive tightening, so the US-Japan interest rate differential continues to favor USDJPY. A key risk is the potential for Japanese officials to interveneโeither verbally or through direct actionโshould the yen continue to weaken rapidly.
The preferred scenario is to await buying interest at the 163.20 level. If the price holds this support and a bullish confirmation signal emerges, USDJPY could continue its ascent toward 163.90, near the upper boundary of the bullish channel.
Invalidation scenario: A clear H3 close below 163.20 would undermine the bullish structure and open the door for a deeper correction.
USD/JPY | USDJPY Hits A 40-Year High And Keeps Climbing!By analyzing the #USDJPY chart on the Daily timeframe, we can see that price continued its strong bullish move and reached the 163.24 region, marking another multi-decade high.
After this move, USDJPY entered a minor correction, but buyers quickly stepped back in and price is currently trading around the 163.00 level. With the Japanese Yen still under heavy pressure and the U.S. Dollar remaining strong across the broader market, I continue to expect further upside.
The nearest demand zones are located around 162.20 โ 162.60, followed by stronger support between 161.40 โ 161.80. On the upside, the closest supply zone is around 163.20 โ 163.60, followed by stronger resistance between 164.20 โ 164.80.
If buyers manage to break and stabilize above the recent 163.24 high, the next upside targets to monitor are 163.60, followed by 164.20, then 165.00, and potentially 166.00 if bullish momentum continues.
For now, the broader structure remains bullish as long as price continues holding above the key demand zones.
Please support me with your likes and comments to motivate me to share more analysis with you and share your opinion about the possible trend of this chart with me !
Best Regards , Arman Shaban
Trend Continuation or False Break?๐บ๐ธ USDJPY | Daily Analysis | Trend Continuation or False Break?
๐ Hello TradingView Family!
I hope you're all doing great and your trades are going exactly as planned! ๐ฑ๐
Today, let's analyze one of the most influential currency pairs in the Forex market: USDJPY (US Dollar / Japanese Yen). This pair is always under the spotlight because it reflects the economic strength of the United States against one of the world's most important safe-haven currencies, the Japanese Yen.
๐ Fundamental Overview
USDJPY is heavily influenced by the monetary policies of the Federal Reserve (Fed) and the Bank of Japan (BoJ). ๐ฆ
๐ Higher U.S. interest rates generally strengthen the Dollar, while Japan's traditionally low-interest-rate policy often weakens the Yen.
In addition, rising U.S. Treasury yields, inflation expectations, and changes in global risk sentiment continue to support USDJPY over the long term.
As long as the interest-rate gap between the two economies remains significant, buyers are likely to maintain the upper hand.
๐ Daily Technical Analysis
Looking at the Daily timeframe, USDJPY remains in a strong bullish trend. ๐
Over the past several weeks, price has successfully broken multiple resistance levels, confirming strong buying momentum.
Now the market is trading around a very important area where previous resistance has turned into support while price is also respecting a rising dynamic trendline.
This combination makes the current zone one of the most critical technical areas on the chart.
๐ Bullish Structure Remains Intact
The market continues to print:
โ
Higher Highs (HH)
โ
Higher Lows (HL)
This confirms that buyers remain in control and the overall market structure is still bullish. ๐ช๐
As long as price stays above the dynamic support, the probability favors continuation toward higher price levels.
โ ๏ธ Don't Ignore the Possibility of a False Break
Although the bullish outlook remains dominant, traders should always prepare for alternative scenarios.
A temporary false breakout (Fake Break) below the dynamic support cannot be ruled out.
Markets often create liquidity grabs before resuming the primary trend.
Therefore, waiting for confirmation after any pullback is generally a safer approach than reacting immediately to the first breakout.
๐ฏ Possible Scenarios
๐ข Bullish Scenario
If buyers defend the dynamic support and price holds above this area, the next bullish wave could target new highs and continue the prevailing uptrend.
๐ด Alternative Scenario
If the current breakout proves to be false and price loses the dynamic support with strong bearish confirmation, a deeper corrective move could develop before buyers attempt another rally.
For now, however, the overall bias remains Bullish.
๐ญ My Market View
๐ Daily Trend: Strong Bullish ๐
๐ Market Structure: Healthy Higher Highs & Higher Lows
๐ Dynamic Support: Holding
๐ Risk: Possible Fake Break
๐ Main Bias: Bullish Continuation unless proven otherwise
Patience and confirmation remain the key ingredients for high-probability trading.
๐ Community Poll
What do you expect next for USDJPY? ๐ค
๐ข Bullish continuation toward new highs ๐
๐ก A deeper correction before moving higher ๐
๐ด Fake breakout followed by a bearish reversal ๐
Vote below and share your analysis in the comments! ๐
โ ๏ธ Disclaimer
This analysis represents my personal market view based on price action and technical analysis. It should not be considered financial or investment advice. Always conduct your own research, follow proper risk management, and never risk more than you can afford to lose.
๐ท๏ธ Tags
USDJPY Forex TechnicalAnalysis PriceAction SmartMoney SupportResistance TrendAnalysis DailyChart SwingTrading MarketStructure JPY USD TradingView RiskManagement
USDJPY H4 โ Bearish Outlook๐ USDJPY H4 โ Bearish Outlook
USDJPY is trading into a major supply zone after a strong bullish rally. The highlighted resistance area may attract selling pressure, with a potential move back toward the demand zone below.
๐น Price is testing a key supply zone.
๐น Sellers may step in if bearish rejection is confirmed.
๐น A rejection from resistance could trigger a decline toward the highlighted demand zone around **160.50โ160.70**.
๐น Wait for bearish confirmation before considering short positions.
**Bias:** Bearish while price remains below the highlighted supply zone.
USDJPY H1 | Smart Money Sell Setup from Supply ZoneUSDJPY is currently trading inside a high-probability premium pricing area, where price has approached a strong supply zone after a sustained bullish expansion. The market is now showing signs of slowing momentum, making this area worth monitoring for a potential bearish reaction.
Market Structure
The overall higher-timeframe trend remains bullish, but on the H1 timeframe price is testing a significant resistance area. I'm waiting for bearish confirmation before expecting a continuation to the downside.
Smart Money Confluences
* Strong Supply Zone (Institutional Selling Area)
* Premium Pricing Zone
* Order Block (OB) as the potential entry area
* Fair Value Gap (FVG) offering additional confluence
* EMA acting as dynamic resistance
* Liquidity resting above recent highs
Trade Plan
Entry: After bearish rejection and confirmation from the marked Order Block.
Stop Loss: Above the supply zone and liquidity highs to protect against liquidity sweeps.
Targets:
TP1: First intraday support.
TP2: Fair Value Gap / Mid-range support.
TP3: Higher-timeframe Order Block and Demand Zone.
Risk Management
I never enter based on a zone alone. Confirmation is essential before executing any trade. Position sizing and disciplined risk management remain the priority regardless of the setup quality.
What is your view on USDJPY? Do you expect a clean rejection from this premium supply zone, or will buyers break above liquidity before the next move?
This analysis is shared for educational purposes and reflects my personal view based on Smart Money Concepts (SMC) and price action. Always perform your own analysis before making trading decisions
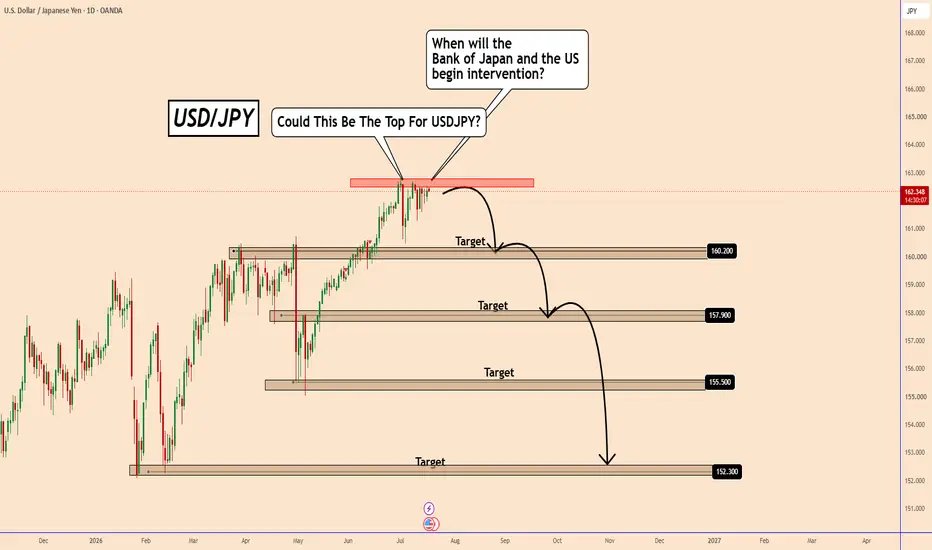
USDJPY Analysis: High-Risk Zone as BOJ Signals InterventionUSDJPY Analysis: High-Risk Zone as BOJ Signals Intervention
I know this is getting old and boring considering the BOJ is constantly sending out messages about possible intervention in Forex.
Yesterday they sent out another message warning about intervention in Forex. Many expect USDJPY to fly higher, but in my opinion we should be careful when the BOJ speaks.
It is impossible to know when they might act again, but considering that they have already intervened in the current zone, the chances are very high that this is the zone where they could make a small or larger intervention again.
The problem is that this will happen as soon as we give up and it carries a high risk.
Main objectives according to the strength of the intervention:
162.20
157.90
155.50
152.30
You can find more details on the chart.
Thank you and good luck! ๐
โ ๏ธPS: Do your own analysis and use your own strategy to join the trade.
โค๏ธ If this analysis helps your trading day, please support it with a like or comment โค๏ธ
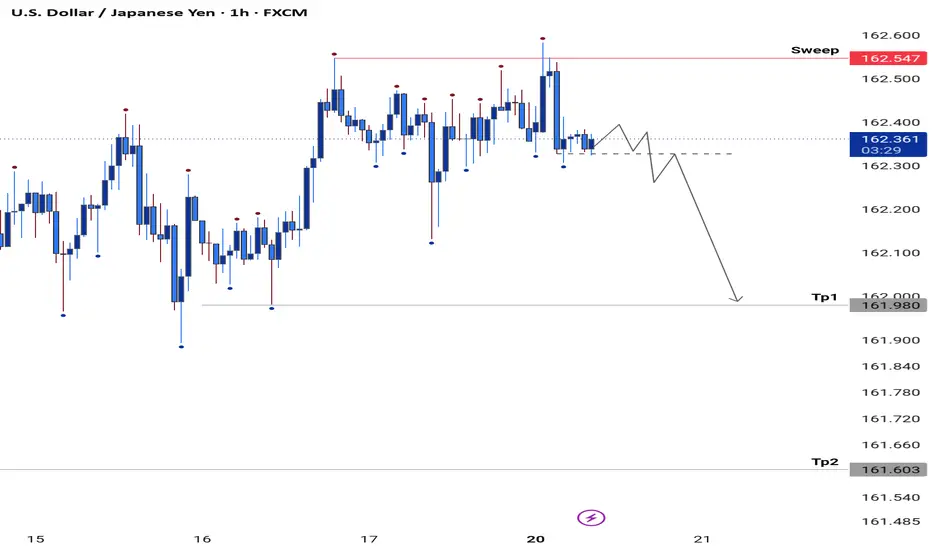
USDJPY Will Go Lower! Short!
Take a look at our analysis for USDJPY.
Time Frame: 1h
Current Trend: Bearish
Sentiment: Overbought (based on 7-period RSI)
Forecast: Bearish
The market is approaching a significant resistance area 162.359.
Due to the fact that we see a positive bearish reaction from the underlined area, I strongly believe that sellers will manage to push the price all the way down to 162.229. level.
P.S
The term oversold refers to a condition where an asset has traded lower in price and has the potential for a price bounce.
Overbought refers to market scenarios where the instrument is traded considerably higher than its fair value. Overvaluation is caused by market sentiments when there is positive news.
Like and subscribe and comment my ideas if you enjoy them!
USD/JPY Forex Opportunity | Ride the Trend, Protect the Profits๐ฏ THE HEIST PLAN โ Bullish Robbery in Motion
๐ Entry: OPEN ENTRY โ YOU CAN ENTER AT ANY PRICE LEVEL, Thief OG's choice ๐ฅท
๐ฆ THE VAULT (Targets):
๐ฅ Target 1 (First Loot): 163.200
๐ฅ Final Vault (Big Score): 163.500
๐จ POLICE FORCE ALERT (Resistance Zone):
The police are camping right near the vault โ strong resistance + overbought conditions + potential trap + possible trend reversal zone. Smart thieves grab their bags and ESCAPE with profits before the sirens go off. Don't get greedy near the vault door ๐๐ฐ
๐ ESCAPE HATCH (Stop Loss): 161.800 โ this is the Thief's Bullish Plan SL, your emergency exit if the heist goes sideways ๐โโ๏ธ๐จ
๐ RELATED PAIRS TO WATCH (Correlation Intel for Fellow Thieves)
๐น DXY (US Dollar Index)
๐ USD/JPY is a dollar-driven pair โ when DXY climbs, USD/JPY tends to follow the same trail. Watch DXY as your dollar-strength radar.
๐น EUR/JPY
๐ Moves in tandem with USD/JPY through shared yen weakness โ if EUR/JPY is also grinding higher, it confirms broad yen softness backing this heist.
๐น GBP/JPY
๐ Another yen-cross confirming the theme โ GBP/JPY strength alongside USD/JPY strength = yen is the common getaway car being chased across the board.
๐น EUR/USD
๐ Inverse dollar-strength gauge โ softness here often mirrors dollar firmness feeding into USD/JPY's climb.
๐ฐ FUNDAMENTALS & ECONOMIC FACTORS (Neutral Market Read โ No Bias)
๐๏ธ Bank of Japan: Lifted its policy rate from 0.75% to 1.00% at its June meeting (7-1 vote), the highest since 1995. Broad Policy Board support exists for continued gradual hikes as underlying inflation nears the 2% target, though no clear signal of another move before Q4.
๐๏ธ US Federal Reserve: Officials are in the blackout period ahead of next week's FOMC meeting, where rates are widely expected to stay unchanged. Market pricing on the next move has shifted modestly session to session.
๐ Geopolitics: Reports point to possible ceasefire progress on Middle East tensions, a factor markets are actively weighing for its impact on energy prices and safe-haven flows.
๐ด Yen dynamics: Japan reportedly spent roughly 11.7 trillion yen ($73.5B) on FX intervention in May, yet the yen weakened again afterward โ intervention risk remains a live wildcard for this pair.
โ๏ธ Neutral read: policy divergence, ceasefire headlines, and intervention risk are live swing factors cutting both ways โ not purely bullish.
โ ๏ธ RISK FACTORS THAT COULD FLIP THE SCRIPT
๐ธ Sudden yen-strength shock from verbal or actual BoJ/MOF intervention near multi-decade highs
๐ธ Middle East ceasefire headlines easing safe-haven dollar demand
๐ธ Any surprise/hawkish shift in Fed tone once blackout lifts
๐ธ Rejection at the "police force" resistance zone triggering a sharp pullback
THIEF TRADER WISDOM
"A real thief never waits for permission โ he reads the vault, respects the police, and escapes before the alarm rings." ๐ฅ
"Greed opens the cell door. Discipline opens the vault." ๐ฐ๐
๐ข CALL TO ARMS, THIEF OG's!
๐ BOOST this idea if the heist plan speaks to you
๐ฌ COMMENT your own vault targets below
โ FOLLOW Thief Trader for the next big score ๐ฅท๐
USDJPY: Bullish Trend Continuation ๐บ๐ธ๐ฏ๐ต
As I predicted earlier, USDJPY successfully violated a resistance
cluster based on the current all-time high.
The broken structure turns into a potentially strong support now.
We can expect that the pair will rise more and reach at least 163.5 level.
For entries, I will look for a pullback and an occasional retest.
โค๏ธPlease, support my work with like, thank you!โค๏ธ
I am part of Trade Nation's Influencer program and receive a monthly fee for using their TradingView charts in my analysis.
USDJPY: Confirmed BoS ๐บ๐ธ๐ฏ๐ต
A quick follow-up for my yesterday's analysis on USDJPY.
As I predicted, the price bounced from a key daily structure.
This morning, we see another bullish confirmation: a valid bullish bos
on a 4h time frame.
I expect a bullish continuation to 163.5
โค๏ธPlease, support my work with like, thank you!โค๏ธ
I am part of Trade Nation's Influencer program and receive a monthly fee for using their TradingView charts in my analysis.