USDJPY 1H: Triangle Breakout Signals Bullish ContinuationUSDJPY 1H: Triangle Breakout Signals Bullish Continuation
USDJPY has broken above the descending trendline of the triangle, strengthening the bullish structure. As long as price holds above the 157.70–158.00 support zone, buyers may target higher resistance levels.
📈 Bullish Scenario
🎯 Target 1: 159.68
🎯 Target 2: 160.70
📉 Bearish Invalidation
A 1H close back below 157.70 would weaken the breakout and increase the risk of a move back into the triangle.
Key Levels
Resistance 1: 159.68
Resistance 2: 160.70
Support: 157.70–158.00
Invalidation: Below 157.70
U.S. Dollar / Japanese Yen
No trades
No trades
In-depth trading ideas
USDJPYHello Traders! 👋
What are your thoughts on USDJPY?
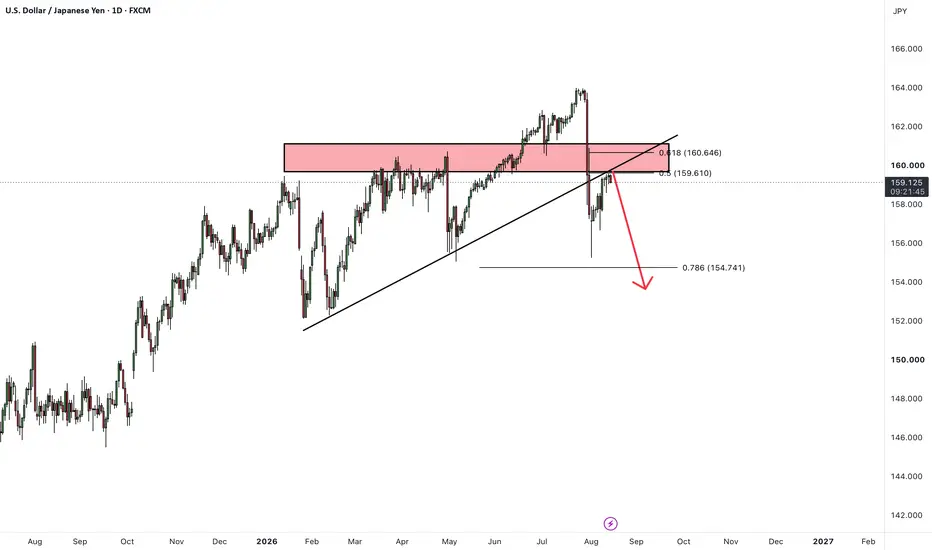
The USD/JPY pair experienced a sharp decline in recent weeks following intervention by Japanese authorities in the FX market, falling from around 164.00 toward 155.20. Since then, the pair has recovered part of its losses and is currently retracing back toward the 160.00 area.
From a technical perspective, the recent bullish move appears to be a pullback toward a major resistance zone between 159.60 and 161.00. This area is particularly significant as it combines previous price structure with Fibonacci resistance, including the 0.5 Fibonacci level around 159.60 and the 0.618 level around 160.65.
Price is currently testing this resistance zone, and we expect some volatility and consolidation around these levels before a potential bearish rejection develops.
As long as USD/JPY fails to establish a valid daily close above 161.00, the bearish scenario remains valid. In this case, we expect the pair to move back toward the 155.00–154.70 area, where previous support coincides with the 0.786 Fibonacci retracement around 154.74, creating an important technical confluence.
A break and sustained move below 155.00 could further strengthen the bearish structure and open the way for a deeper decline toward lower levels.
Meanwhile, the risk of renewed intervention by Japanese authorities remains an important factor for USD/JPY, particularly as the pair approaches the psychologically and technically significant 160.00 area again.
As long as price remains below the 161.00 area, we expect the pair to consolidate and complete its pullback within this zone before facing a bearish rejection and moving toward lower levels.
If you found this analysis helpful, please support it with a like and share your thoughts in the comments! Good luck with your trades!❤️
JPYUSD: The Road to Liquidity🔹 JPYUSD has shown a strong bullish displacement from the 0.00610–0.00615 demand area, followed by a Break of Structure and a move toward the 0.00640–0.00642 resistance zone. Price is now retracing from the upper range, with a bearish CHoCH visible around the 0.00634–0.00635 area. The current structure suggests a corrective phase, while the 0.006217 level and the lower 0.00610 area remain important liquidity zones.
🔸 From the current price action, JPYUSD could experience a corrective move toward the highlighted liquidity areas if bearish structure remains active. A reaction around 0.00621 or 0.00610 could support another bullish attempt, while renewed strength near 0.00635–0.00642 may indicate continued resistance. Traders may wait for clear price confirmation before considering any trade. If the lower support zones fail to hold, deeper downside liquidity could become relevant. Overall, the chart presents a developing market-structure transition with key liquidity areas worth monitoring.
This analysis is for educational purposes only and does not constitute financial or investment advice. Always conduct your own research before making trading decisions.
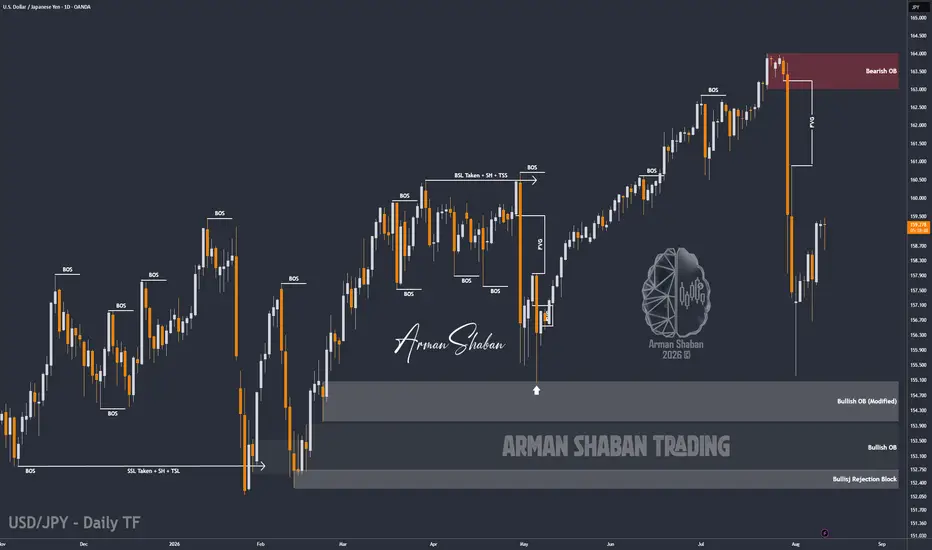
USD/JPY | USDJPY Rebounds After The Intervention Shock,FVG AheadBy analyzing the #USDJPY chart on the Daily timeframe, we can see that the market experienced an extremely aggressive move after Japanese authorities stepped in to support the Yen. USDJPY collapsed from the 163+ area toward the 157 region in a very short period of time, showing just how violent the intervention-driven move was.
Currently, price is trading around 159.25 and has already started recovering from the recent low. The most important thing on the chart right now is the massive FVG created during this sharp sell-off, roughly between the 160.90 and 163.20 regions.
In my view, this imbalance could become a major magnet for price in the medium term. If buyers continue defending the current recovery structure, the first upside targets to monitor are 160.00, followed by 160.90, then 161.50, 162.20, and potentially the upper side of the FVG around 163.00 – 163.20.
However, the 163.20 – 164.00 area is also a major Bearish Order Block, so even if USDJPY manages to completely fill the FVG, this zone could attract another strong wave of selling pressure.
On the downside, the first important support area sits around 157.10 – 157.60. If this area fails, the next major demand zone is located around 154.00 – 155.10, followed by deeper bullish zones around 152.40 – 153.50.
So the medium-term scenario I’m watching is relatively simple: recovery toward the large FVG first, then we reassess price reaction as USDJPY approaches the 163 area.
The intervention changed the short-term structure dramatically, but it also created one of the clearest imbalances currently visible on the Daily chart.
Please support me with your likes and comments to motivate me to share more analysis with you and share your opinion about the possible trend of this chart with me !
Best Regards , Arman Shaban
USDJPY 30Min Engaged ( Bullish Reversal Detected )HANZO MARKET LIQUIDITY REPORT
USDJPY
Timeframe: 30min (Volume Basis)
Scale: Higher Timeframe Context / Deep Volume analysis
━━━━━━━━━━━━━━━━━━━━━━
Market Observation
This analysis is focusing on structural behavior, liquidity zones, Volume analysis
and key areas of interest within the current range.
━━━━━━━━━━━━━━━━━━━━━━
Market Bias
Full liquidity Map
━━━━━━━━━━━━━━━━━━━━━━
🔥Bullish Reversal
Key Volume Zone : 158.300 Area
━━━━━━━━━━━━━━━━━━━━━━
Structure Factors:
• Higher timeframe Volume reaction level
• High-volume / Hidden
• Range Defend structure
• Volume Stacking
• Quarter Volume
Heading towards key resistance?Ninja (USD/JPY) is rising toward the pivot, which has been identified as an overlap resistance and could reverse toward the 1st support.
Pivot: 160.1
1st Support: 158.55
1st Resistance: 161.88
Disclaimer:
The opinions given above constitute general market commentary and do not constitute the opinion or advice of IC Markets or any form of personal or investment advice.
Any opinions, news, research, analyses, prices, other information, or links to third-party sites contained on this website are provided on an "as-is" basis, are intended to be informative only, and are not advice, a recommendation, research, a record of our trading prices, an offer of, or solicitation for, a transaction in any financial instrument and thus should not be treated as such. The information provided does not involve any specific investment objectives, financial situation, or needs of any specific person who may receive it. Please be aware that past performance is not a reliable indicator of future performance and/or results. Past performance or forward-looking scenarios based upon the reasonable beliefs of the third-party provider are not a guarantee of future performance. Actual results may differ materially from those anticipated in forward-looking or past performance statements. IC Markets makes no representation or warranty and assumes no liability as to the accuracy or completeness of the information provided, nor any loss arising from any investment based on a recommendation, forecast, or any information supplied by any third party.
USD/JPY Bearish Triangle Breakdown | Sellers Target 155.48
USD/JPY on the **1-hour timeframe** has confirmed a **bearish breakdown** from a symmetrical triangle pattern after multiple tests of converging trendlines. The rejection at the triangle apex signals weakening bullish momentum and increasing selling pressure.
The sharp move below the lower trendline confirms the breakout, shifting market sentiment in favor of the bears. If price remains below the broken support, the next downside objective is **155.48**, which aligns with the projected measured move from the triangle formation.
**Key Levels:**
* 📉 **Target:** 155.48
* 🔴 **Resistance:** 158.30–158.50 (former triangle support, now resistance)
* 🟢 **Support:** 156.50 followed by 155.48
**Trade Idea:**
* Bias: **Bearish**
* Look for pullbacks toward the broken trendline as potential selling opportunities.
* A sustained move below recent lows increases the probability of reaching the **155.48** target.
* A recovery back inside the triangle would weaken the bearish outlook and could invalidate the setup.
USD/JPY: Pullback Imminent, Time to Buy!The ⚠️USDJPY pair finally stopped falling.
For now, a key daily support that the price tested earlier holds.
To catch a pullback trade from that, pay attention to a horizontal resistance level on a 4-hour timeframe.
Wait for a bullish breakout of this horizontal structure. A 4H candle close above that will give you a strong bullish signal.
A pullback will be expected at least to the 159.00 level then.
USDJPY 30Min Engaged ( Bearish Reversal Detected )HANZO MARKET LIQUIDITY REPORT
USDJPY
Timeframe: 30min (Volume Basis)
Scale: Higher Timeframe Context / Deep Volume analysis
━━━━━━━━━━━━━━━━━━━━━━
Market Observation
This analysis is focusing on structural behavior, liquidity zones, Volume analysis
and key areas of interest within the current range.
━━━━━━━━━━━━━━━━━━━━━━
Market Bias
Full liquidity Map
━━━━━━━━━━━━━━━━━━━━━━
🔥Bearish Reversal
Key Volume Zone : 159.320 Area
━━━━━━━━━━━━━━━━━━━━━━
Structure Factors:
• Higher timeframe Volume reaction level
• High-volume / Hidden
• Range Defend structure
• Volume Stacking
• Quarter Volume
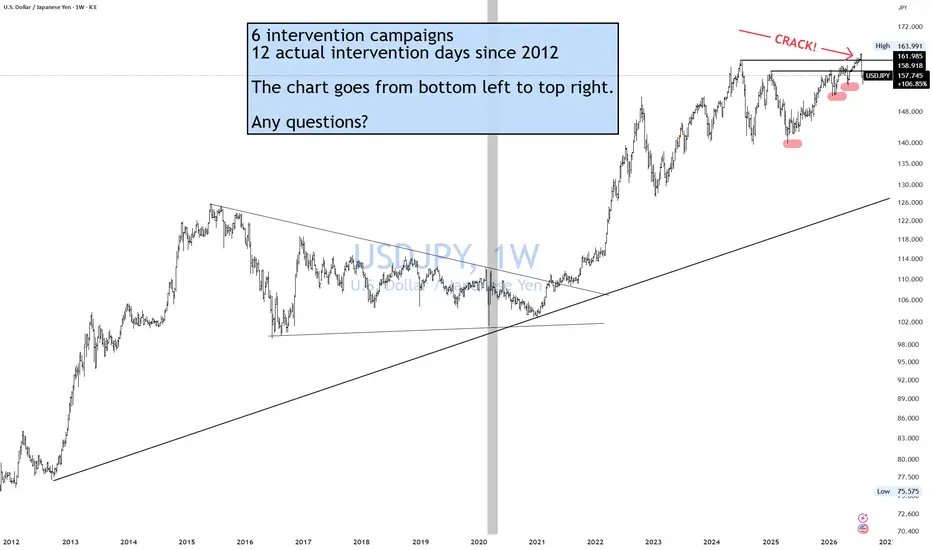
Japan 6 FX Interventions tells us what?Intervention doesn't change math! That's what it tells us.
6 intervention campaigns
12 actual intervention days since 2012
The chart goes from bottom left to top right.
Any questions?
See how much you can learn from a simple chart?
If you enjoy the work: 👉 Drop a solid comment. Let’s push it to 7,000 and keep building a community grounded in raw truth, not hype.
USDJPY 30Min Engaged (Bullish Reversal Detected )HANZO MARKET LIQUIDITY REPORT
USDJPY
Timeframe: 30min (Volume Basis)
Scale: Higher Timeframe Context / Deep Volume analysis
━━━━━━━━━━━━━━━━━━━━━━
Market Observation
This analysis is focusing on structural behavior, liquidity zones, Volume analysis
and key areas of interest within the current range.
━━━━━━━━━━━━━━━━━━━━━━
Market Bias
Full liquidity Map
━━━━━━━━━━━━━━━━━━━━━━
🔥Bullish Reversal
Key Volume Zone : 157.800 Area
━━━━━━━━━━━━━━━━━━━━━━
Structure Factors:
• Higher timeframe Volume reaction level
• High-volume / Hidden
• Range Defend structure
• Volume Stacking
• Quarter Volume
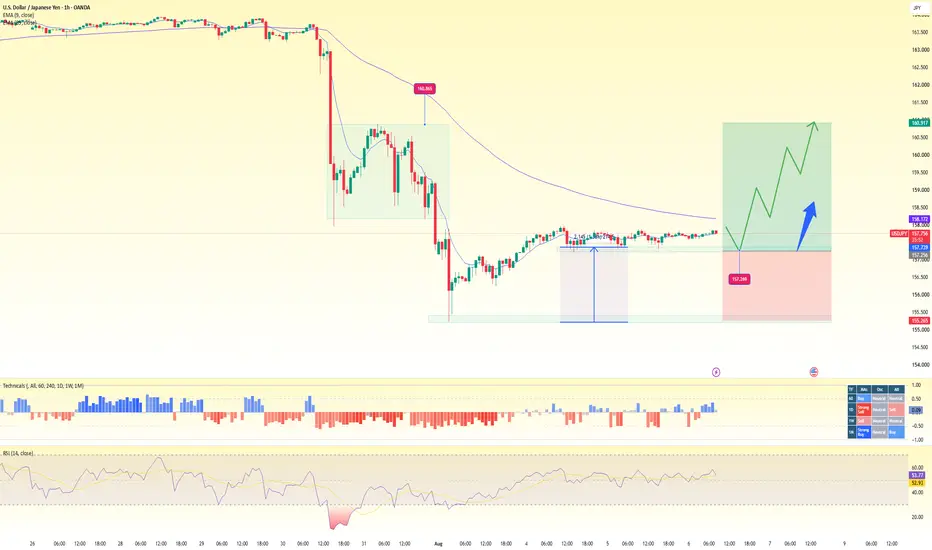
USD/JPY – Government intervention1. Trend Overview
Current Trend: Short-term Bullish Recovery
Key Signals:
After the sharp sell-off from 160.80 to around 155.30, USD/JPY has entered a consolidation phase and is gradually recovering.
Price is forming a base above the 157.25 support zone, indicating that sellers are losing momentum.
EMA 9 (≈157.74) has crossed above price and is turning upward, showing improving short-term momentum.
Price remains below EMA 89 (≈158.17), meaning the medium-term trend is still bearish despite the ongoing recovery.
RSI (14) ≈54 has moved above the neutral 50 level, suggesting buyers are gradually gaining control.
The histogram has turned positive, confirming improving bullish momentum.
👉 Conclusion: The H1 outlook has shifted to a short-term bullish recovery. As long as price holds above 157.25–157.30, the probability of extending the rebound toward 158.20–159.00 remains favorable.
-----------------
BUY USDJPY zone : 157.300 - 157.200
SL : 156.800
TP : 157.600 - 157.900 - 158.500
---------------
2. Current Price Structure
H1 Structure
Higher Low: around 157.25
Current Price: around 157.77
Price is consolidating near the recent highs after a gradual recovery.
The market has transitioned from a sharp decline into an accumulation phase, with buyers beginning to build higher lows.
Current Pattern:
Sharp Decline → Accumulation → Bullish Recovery
A sustained break above 158.20 would confirm a stronger bullish continuation toward the next resistance levels.
-------
Economic Factors Affecting USD/JPY
1. Federal Reserve (Fed)
Markets remain focused on the Fed's interest-rate outlook.
If U.S. inflation and labor market data remain strong, expectations for higher-for-longer rates could support the U.S. dollar and push USD/JPY higher.
2. Bank of Japan (BoJ)
The BoJ continues to normalize monetary policy cautiously.
Any indication of faster policy tightening or higher Japanese bond yields could strengthen the yen and limit USD/JPY gains.
3. U.S. Treasury Yields
USD/JPY remains highly correlated with U.S. Treasury yields.
Rising yields generally support USD/JPY, while falling yields tend to weigh on the pair.
4. Safe-Haven Flows
During periods of geopolitical uncertainty or risk aversion, the Japanese yen often benefits from safe-haven demand, which can cap USD/JPY rallies even if the U.S. dollar remains fundamentally supported.
USD/JPY continues to find dip buyersFollowing the CPI report we saw the US dollar initially take a bit of a dip and the USD/JPY fell to test the high of Friday's hammer candle at 158.57ish. That's precisely where it has since bounced back from. So despite coordinated intervention from both the US and Japan, and in line US CPI, traders are still happy to pick up the dips in the USD/JPY. This is owing to the fact that interest rates in the US are comparatively higher especially against Japanese interest rates and also Switzerland where interest rates are at 0. Hence we continue to see dip buyers are stepping in on any short-term downward moves in the USD/JPY and in the USD/CHF currency pairs.
So the 158.57ish level is a key level of support. Below that we have the 200-day moving average coming in at 158.20ish. That makes the 158.20-158.57 zone quite important from a technical standpoint. It will need to hold for this currency pair to remain in a bullish short-term trend.
By Fawad Razaqzada, market analyst with FOREX.com
USDJPY H1 — BUY SetupUSDJPY H1 — BUY Setup
Entry: 158.80–158.95
Stop Loss: 157.15
TP1: 160.00
TP2: 161.50
TP3: 163.90
Bias: 🟢 Bullish
Price is holding above the rising trendline and showing bullish structure. A pullback toward 158.00–158.30 can provide a better buying opportunity. If support holds, upside targets are 160.00, 161.50 and 163.90.
Trade with proper risk management.
USDJPY 30Min Engaged ( Bullish Reversal Detected )HANZO MARKET LIQUIDITY REPORT
USDJPY
Timeframe: 30min (Volume Basis)
Scale: Higher Timeframe Context / Deep Volume analysis
━━━━━━━━━━━━━━━━━━━━━━
Market Observation
This analysis is focusing on structural behavior, liquidity zones, Volume analysis
and key areas of interest within the current range.
━━━━━━━━━━━━━━━━━━━━━━
Market Bias
Full liquidity Map
━━━━━━━━━━━━━━━━━━━━━━
🔥Bullish Reversal
Key Volume Zone : 159.180 Area
━━━━━━━━━━━━━━━━━━━━━━
Structure Factors:
• Higher timeframe Volume reaction level
• High-volume / Hidden
• Range Defend structure
• Volume Stacking
• Quarter Volume
USD/JPY: Bulls Eye 159.40 BreakoutUSD/JPY has been pushing higher after a strong move from the 157.60 area. Price is now trading around 159.30 and has reclaimed the 200 EMA at 159.06, giving buyers a slight technical advantage.
The key level now is 159.40, where price has been struggling to break. A clean break and close above this resistance could open the door for another move higher.
If buyers break 159.40 and hold above it, the next major area to watch is around 160.60–160.80, where previous resistance sits.
#USDJPY: +500 PIPS Intraday Trading Opportunity! 🔺The USDJPY has declined since the US Treasury yield reached an all-time high and reached the level of the 2008 financial crisis. This prompted US intervention in the market, causing the Japanese Yen to rise sharply and become extremely bullish.
🔺We anticipate a bullish trend for USDJPY and a subsequent filling of the liquidity gap created by the recent sell-off. A target of approximately +500 pips can be achieved within days or weeks if strong bullish data is released on the NFP day. Traders should exercise strict risk management when trading USDJPY.
USDJPY 10-month Channel Up starting new rally.The USDJPY pair has been trading within a 10-month Channel Up, which made a Higher Low bottom on August 03 on its 1W MA50 (red trend-line). This is technically a major Support Cluster, strengthened also by the 1D MA200 (orange trend-line).
This is technically the start of the new Bullish Leg, this time on oversold 1D RSI territory also (amplifying the buying pressure). The minimum Target on the previous two Legs was the Resistance. This time it's on 164.000.
---
** Please LIKE 👍, FOLLOW ✅, SHARE 🙌 and COMMENT ✍ if you enjoy this idea! Also share your ideas and charts in the comments section below! This is best way to keep it relevant, support us, keep the content here free and allow the idea to reach as many people as possible. **
---
💸💸💸💸💸💸
👇 👇 👇 👇 👇 👇
USDJPY 1H SMC Analysis – Potential Retracement Into 4H FVG BeforThis USDJPY 1-hour chart presents a bearish Smart Money Concepts (SMC) scenario. Price previously experienced a strong bearish displacement, followed by several structure breaks (SB) and a CHOCH, confirming a broader bearish market structure.
After the sharp decline, price began retracing upward and is currently moving back toward a highlighted 4H Fair Value Gap (FVG). Above this FVG, a larger premium/supply area is marked as the main zone where a bearish reaction could potentially develop.
The projected scenario suggests that price may continue higher first, filling the 4H FVG and possibly reaching the upper supply zone. From there, the chart anticipates rejection and a continuation of the bearish move.
If sellers regain control from this area, the first downside objective would be the recent low and nearby sell-side liquidity. A continuation below that level could then target the deeper liquidity pool marked by the lower dashed line.
Why the Yen Carry Trade Can Crash Global Markets Overnight
On August 5, 2024, the Nikkei fell over 12% in a single day. The S&P 500 dropped. Nasdaq dropped. Bitcoin fell more than 15% in a matter of hours. A war, a crisis, or bad economic data did not cause this. It was caused by the Bank of Japan raising interest rates by a small amount.
Most traders had no idea why global markets were crashing that day. The reason was something almost nobody watches closely: the Japanese Yen carry trade unwinding all at once. This article explains exactly what that means and why it has the power to shake markets everywhere, not just in Japan.
What is a carry trade?
For decades, Japan has kept its interest rates near zero, even while other countries raised theirs. That means borrowing money in Japan is extremely cheap.
A carry trade works like this: an investor borrows Yen at close to 0% interest, converts it into another currency like the US Dollar, and then invests that money in something that pays more US stocks, US bonds, emerging market assets, even Bitcoin. As long as Japan's rates stay low and the Yen stays weak, this is close to free money. You borrow cheap, invest somewhere that pays more, and pocket the difference.
This isn't a small trade done by a few people. Estimates put the size of the global Yen carry trade in the trillions of dollars. Huge hedge funds, institutions, and banks have used this strategy for years.
Why this trade is riskier than it looks
The entire trade depends on two things staying stable: Japan's interest rates staying low, and the Yen staying weak against other currencies.
If either of those changes, the trade stops making sense. Worse, if the Yen suddenly strengthens, anyone holding this trade now owes more Yen than they borrowed, and their profits can turn into losses fast. When that happens, everyone holding the same trade tries to unwind it at the same time, sell their overseas investments, convert back into Yen, and pay off their cheap loan before it gets more expensive.
That's exactly what happened in August 2024.
What actually happened on August 5, 2024
The Bank of Japan raised interest rates from near 0% to 0.25%, a small move by most standards. But it was enough to break the carry trade.
The Yen strengthened quickly against the Dollar. Traders who had borrowed Yen to buy US stocks, tech shares, and even crypto suddenly saw their trade turn against them. To cut losses, they had to sell their overseas holdings and buy back Yen to repay their loans.
Because so many funds were doing the same thing at once, it triggered a chain reaction. Selling in US and Japanese stocks accelerated selling in other markets, which triggered more margin calls, which forced even more selling. Within days, global markets had one of their sharpest drops in years, all tracing back to one interest rate decision on the other side of the world.
Why this affects markets you'd never expect
This is the part almost no one connects. The Yen carry trade doesn't just touch Japanese stocks. Because the borrowed money flows into so many different assets, unwinding it hits:
US tech and growth stocks, since a large amount of carry trade money had been parked in high-growth names. Emerging market currencies and stocks, since carry trade money often flows into higher-yielding emerging assets too. Gold and commodities, as investors rush to safety and unwind leveraged positions everywhere at once. And crypto, particularly Bitcoin, which had also become a popular destination for cheap Yen-funded leverage in recent years.
This is why a small rate decision in Tokyo can knock billions of dollars off the S&P 500 and crash Bitcoin in the same afternoon; the connection isn't obvious unless you know the carry trade exists in the background.
Why almost no one sees it coming
Retail traders watch the Fed. They watch US inflation data, US jobs numbers, US earnings. Very few watch the Bank of Japan's policy meetings or the USD/JPY exchange rate closely, because Japan's rates have barely moved for over a decade.
The risk with a carry trade unwind is that it doesn't build up slowly like other market risks. It sits quietly for years, and then unwinds violently in days once the trigger hits, because leveraged positions all get forced to close around the same time.
How to actually watch for this
Keep an eye on USD/JPY. A sharp, fast strengthening of the Yen is the clearest early warning sign that carry trade unwinding could be starting. Watch Bank of Japan policy meetings, even if you don't trade Japanese assets. Any signal that Japan might raise rates or reduce bond purchases can be a trigger point.
Watch for unusual, sudden selling across unrelated assets at the same time US tech stocks, emerging markets, and crypto all drop together with no clear news is a signature sign of a carry trade unwind, not a normal correction.
Remember that the size of this trade means the unwind can move faster and harder than the news headlines suggest, because it isn't driven by fundamentals; it's driven by leveraged positions being forced closed.
My thought
Most market crashes get explained after the fact with a clear headline — a rate hike, a war, a bad earnings report. The Yen carry trade unwind is different. It builds quietly in the background for years, invisible to almost everyone, and then breaks fast enough to move the entire global market in a single day.
Next time USD/JPY makes a sudden, sharp move, don't ignore it. It might just be the first sign of trillions of dollars starting to unwind at once.
Thank you
@VertexQore
USDJPY Daily Trade Setup 13/8/26USDJPY remains structurally bullish on the weekly chart while holding above 152, but the H4 setup suggests downside risk if the current recovery stalls into resistance.
Weekly outlook:
Bullish above 152. Structure weakens below 146. Weekly POC near 147
H4 outlook:
Price is rebounding after a sharp decline. 160/161 is the key resistance zone. If sellers defend this area, price could rotate back toward 152
Why 160/161 matters:
Previous breakdown zone
Retracement resistance
Volume and mean-reversion resistance
Possible corrective wave completion area
Bearish scenario:
Rejection from 160/161 opens room for a move toward 152. A break below 152 would increase downside pressure. A confirmed weekly move below 146 would shift the broader structure bearish.
Key levels:
Resistance: 160/161
First downside target: 152
Bearish confirmation: below 147
The broader trend is still bullish above 152, but near-term rallies into 160/161 favour a sell-side bias. The cleaner setup is to fade strength at resistance rather than chase weakness lower.
USDJPY is at risk of another decline (2H)From where we placed the red arrow on the chart, a sharp decline occurred, indicating that a new bearish pattern has formed on USDJPY.
The first wave has been completed, and the price is currently recovering in the form of the second wave, which is wave B. We expect the third wave, which is bearish and labeled as wave C, to begin from the red zone and push the price lower again.
We have prepared a trading setup that you can use to enter a position.
Let’s see how it plays out.
If you have a coin or altcoin you want analyzed, first hit the like button and then comment its name so I can review it for you.
Do you think USDJPY is bearish?