USD/MXN continues to highlight a relevant sideways rangeThese have started to become difficult sessions for the Mexican peso. The currency has not managed to find consistent demand, and USD/MXN average movements are barely showing a variation close to 0.4% over the last 3 trading sessions.
This behavior reflects lower market activity, especially considering that previous weeks saw variations of up to 0.8% in a single session. For now, the Mexican peso has not managed to consolidate a stable sense of strength, while the stability of the U.S. dollar continues to pressure the market.
In addition, the U.S. inflation data released during the week has not been enough to eliminate the possibility of a potential interest rate hike in September by the Fed. This could be maintaining some strength around the U.S. dollar.
If this effect continues, a phase of indecision could remain relevant in short-term USD/MXN movements.
Sideways range remains relevant
For several months, USD/MXN average movements have maintained a medium-term sideways structure, with a ceiling near the 18 pesos per dollar area and a floor around 17 pesos per dollar.
For now, recent price movements have not been enough to break this neutrality. For this reason, the sideways range remains the most important technical structure to watch and could continue to affect the lack of direction in USD/MXN over the coming weeks.
RSI: The RSI indicator line continues to move around the neutral 50 area. This suggests that the average of buying and selling impulses remains balanced.
As long as this behavior continues, a neutral bias could remain relevant in short-term USD/MXN movements.
MACD: A similar dynamic can be seen in the MACD, as the histogram remains close to the neutral 0 level. This suggests balance in the average strength of short-term moving averages.
This reading also highlights relevant neutrality that could remain important over the next few sessions.
Key levels to watch:
18 pesos per dollar – Relevant resistance: This high zone remains the most important upper barrier at the moment. Price movements toward this level could start to leave the neutral bias behind and open room for more relevant buying pressure over the coming trading weeks.
17.58 pesos per dollar – Near-term barrier: This key retracement area corresponds to the most relevant neutrality level between the long-term moving averages on the chart. If price fails to move consistently away from this level, the neutral phase could remain in place and even open room for an extension of the dominant sideways range.
17 pesos per dollar – Key support: This area corresponds to the 2026 lows and remains the main bearish barrier to watch. Price movements below this level could bring back the selling bias seen in previous weeks and open room for a possible reactivation of the long-term bearish trend.
Written by Julian Pineda, CFA, CMT – Market Analyst
U.S. Dollar / Mexican Peso
No trades
No trades
In-depth trading ideas
USDMXN Reverses Lower After Completing 3-3-5 Flat CorrectionUSDMXN has reached the projected resistance target for wave C of a regular ABC flat correction and is now turning sharply lower with an impulsive decline. This strong reversal suggests that sellers have regained control, shifting the short-term outlook back to the downside. While the broader bearish move appears to be underway, traders should still be aware of short-term corrective pullbacks that may interrupt the decline.
From an Elliott Wave perspective, a regular flat correction follows a 3-3-5 structure. Wave A unfolds as a three-wave correction, wave B also forms a three-wave move and typically retraces close to or slightly beyond the start of wave A, while wave C develops as a five-wave impulse that often terminates near key Fibonacci resistance levels. Once wave C is complete and an impulsive reversal appears, it frequently signals that the dominant trend is ready to resume.
With wave C now likely complete and bearish momentum accelerating, the technical outlook favors additional downside in the sessions ahead.
Highlights:
USDMXN reached the projected resistance for wave C of a regular 3-3-5 flat correction.
A sharp impulsive reversal suggests bears have regained control.
Regular flat corrections consist of a 3-3-5 Elliott Wave structure (A-B-C).
Wave C often completes at Fibonacci resistance before the dominant trend resumes.
Watch for further downside, while allowing for short-term corrective pullbacks along the way.
USD/MXN — Bullish Setup Still DevelopingUSD/MXN continues to show a constructive bullish setup.
On the daily chart, the market is building a potential triple bottom around the 17.14 area. On the 4-hour chart, price action is also showing a series of higher reactions from the same support zone.
The key level to watch is 17.60. A clean break above that area could open the door for a move toward 18.03.
I still like the setup for medium-term long positions, especially while price continues to hold above the recent bottom area.
Target: 18.03
Key resistance: 17.60
Invalidation: strong close below 17.14
The chart is not screaming yet, but it is getting harder to ignore.
#USDMXN #Forex #FX #TechnicalAnalysis #TradingView #MexicanPeso #USDollar #RiskManagement #Hedging
USD/MXN — Short at Recovery Top, [Quantum Algo]USDMXN
Context:
USD/MXN had a clean directional play this month. The previous Buy signal at 17.29 delivered a rally up to 17.50 — over 200 pips of clean follow-through. After the rally topped, price has been in a downtrend, making lower highs and lower lows. Now, after a recovery bounce back to 17.34, a fresh Sell signal has fired as price tags resistance.
Why this setup works — three confluences:
Buy signal completed, counter-direction firing — the prior Buy played out its full move from 17.29 to 17.50. Now after the topping and downtrend, a Sell is firing at the recovery zone. Cycle complete, rotation confirmed
Lower high in established downtrend — since the 17.50 top, every bounce has made a lower high. The current rally to 17.34 is the latest lower high in the bearish sequence. Until structure shifts with a higher high above 17.44, the downtrend remains intact
Failed recovery into prior support-turned-resistance — the 17.34 zone acted as support during the early downtrend and has now flipped to resistance. Price climbed back to this level and immediately got rejected with the Sell signal. Classic polarity flip rejection
A Sell signal fired at 17.34607. We took it.
Trade management:
Entry: 17.34607
Stop Loss: 17.44000 — above the resistance zone and recent lower high
TP1: 17.25000 — mid-range support, 50% off, stop to breakeven
TP2: 17.21726 — extended target at the recent low for 100% exit
R:R: ~1:1 to TP1, ~1:1.4 to TP2. Tight risk with structure-defined invalidation above.
Invalidation: Close above 17.44000 — the lower high structure breaks and the downtrend ends.
The lesson:
When a directional signal completes its move and the market begins building counter-structure (lower highs after a Buy completion), the rotation is in progress. Most traders stay locked into the previous bias and try to long the dip — but the structure has already shifted. The disciplined approach is recognizing when a cycle ends and trading the new direction. Each phase of the market has its own setup. The Buy delivered. Now it's the Sell's turn.
Signal fired. We took it. Update coming.
⚠️ Disclaimer: This is not financial advice. Trade ideas shared here are for educational and informational purposes only. All trading involves risk — past performance does not guarantee future results. Always do your own research and manage your risk accordingly.
Is the Super Peso’s Strength Built to Last?The Mexican peso is holding firm near 17.20 per dollar in mid-2026, with the dollar down about 9.4% against it over the past year and the pair sitting near the strong end of a 17.09 to 19.35 range. The “super peso” label is earned rather than hype, resting on a real base of high carry, nearshoring flows, and deep trade ties to the US. The nuance worth keeping is that the peso is strong and range-bound rather than breaking to new extremes. The question is less whether it is strong and more whether that strength can persist.
The clearest support is the rate differential. The Bank of Mexico cut its key rate to 6.5% in early June, but that still towers over the Fed’s 3.50% to 3.75% range, leaving a gap of nearly three percentage points that pulls global carry capital toward peso assets. That said, the engine is slowly losing fuel. Banxico is easing while the Fed holds, with new Chair Kevin Warsh’s committee leaning away from cuts, so the differential narrows at the margin with each Mexican move. The carry trade still pays, but the spread is the slow-moving risk, not the safe harbor it appears to be.
The more durable pillar is structural. Nearshoring continues to redirect manufacturing capacity toward Mexico, and the country’s status as America’s largest trading partner anchors persistent commercial demand for the currency. This is the part of the bull case with real staying power. It is not unconditional, though. The 2026 USMCA review and a US tariff agenda that has repeatedly threatened Mexican goods sit directly on top of the trade flows the thesis depends on. The same integration that supports the peso is what leaves it exposed to a hostile turn in Washington.
The honest verdict is that the super peso is structurally supported but tactically stretched. Calling it a speculative bubble would be wrong, since carry and nearshoring are genuine foundations. But “breaking the dollar” overstates a currency that is strong, rangebound, and quietly losing carry advantage as Banxico eases. Trade policy is the swing factor. Treating dollar rallies as selling opportunities is reasonable only as long as the rate gap stays wide and the USMCA review and tariff threats resolve in Mexico’s favor. Strength, yes. A one-way break, not yet.
USD/MXN Stalls at Weekly Supply Zone⚠️ LOW CONFIDENCE / Educational — Forex is the engine's weakest directional class. Zone quality is exceptional; direction probability is not. Risk 0.5% max if trading.
USD/MXN has rallied back into a fresh weekly supply zone between 17.236 and 17.607 — an RBD (Rally-Base-Drop) origin where sellers previously overwhelmed buyers with an explosive leg-out that ran over 100 pips with no pullback. Price has arrived at this level for the first time since that distribution, showing rejection wicks and a bearish weekly close at the proximal edge. Three of the five fundamental factors align to the downside: the pair is in the upper portion of its weekly range (technically expensive), June seasonality points lower for USDMXN, and the weekly trend confirms lower highs and lower lows since the September 2024 peak. The setup favors a continuation move toward 16.494.
THE ZONE
Type: RBD (Rally-Base-Drop) — Original supply, flip-zone bonus Range: 17.236 — 17.607 Quality Score: 9.1/10 Departure 10/10 — explosive leg-out, body-dominant candle Freshness 10/10 — untested since formation Originality 12/10 — flip zone (prior demand level flipped to supply) Profit Margin 10/10 — clean runway to T1 and T2 with no speed bumps Arrival 10/10 — fast, clean impulse back into zone Base Duration 4/10 — 4-candle base (acceptable, not ideal)
FUNDAMENTAL CONSENSUS — 3/5 ALIGNED BEARISH
Location: Upper third of HTF range — technically expensive Seasonality: June lookbacks point lower for USD/MXN Trend: Downtrend — lower highs and lower lows confirmed since Sept 2024 COT: Neutral — no extreme positioning in MXN futures Valuation (DXY): Neutral — no opposing pressure, not contradicting
TRADE PARAMETERS
Direction: Short Entry: 17.236 (E3 — confirmation entry on shooting star pattern in zone) Stop Loss: 17.607 (zone distal — HTF weekly mode) Breakeven: Move stop to entry at 17.051 (half-distance to T1) T1: 16.865 (−1R) — move to breakeven T2: 16.494 (−2R) — take 50% partial, trail remainder T3: 16.122 (−3R) — trail with-trend only R:R: 1:2.0 to T2
Alternative E2 (zone midpoint 17.343) offers 1:2.9 R:R but may not fill if price only grazes the proximal edge.
INVALIDATION
The bearish thesis is invalidated if USD/MXN closes above 17.607 on the weekly. A surprise Banxico rate cut, a sharp DXY breakout above 105, or a broad EM risk-off event would also cancel this trade regardless of price level.
WHAT THIS SETUP TEACHES
The RBD flip zone marks a price level where prior buyers were completely overwhelmed — the base from which a large distribution move originated. When price returns to a fresh, untested supply zone with trend and seasonality aligned, you are entering alongside the same institutional sellers at their defined cost basis. The edge here is not the direction call (forex is statistically the weakest class in the engine) — the edge is the zone quality and the defined risk. A 9.1 composite means the zone structure is clean and institutional. A 0.5% risk cap means one loss costs half a percent. That is how you trade low-conviction setups responsibly: smaller size, same discipline.
Are you watching 17.236–17.607 on USDMXN? Drop your level below.
Educational analysis based on supply/demand methodology. Not financial advice. Always use proper risk management.
USD/MXN Back at Supply — Short Setup⚠️ LOW CONFIDENCE / Educational — Forex is the engine's weakest directional class. Zone quality is exceptional; direction probability is not. Risk 0.5% max if trading.
USD/MXN has rallied back into a fresh weekly supply zone between 17.236 and 17.607 — an RBD (Rally-Base-Drop) origin where sellers previously overwhelmed buyers with an explosive leg-out that ran over 100 pips with no pullback. Price has arrived at this level for the first time since that distribution, showing rejection wicks and a bearish weekly close at the proximal edge. Three of the five fundamental factors align to the downside: the pair is in the upper portion of its weekly range (technically expensive), June seasonality points lower for USDMXN, and the weekly trend confirms lower highs and lower lows since the September 2024 peak. The setup favors a continuation move toward 16.494.
THE ZONE
Type: RBD (Rally-Base-Drop) — Original supply, flip-zone bonus
Range: 17.236 — 17.607
Quality Score: 9.1/10
Departure 10/10 — explosive leg-out, body-dominant candle
Freshness 10/10 — untested since formation
Originality 12/10 — flip zone (prior demand level flipped to supply)
Profit Margin 10/10 — clean runway to T1 and T2 with no speed bumps
Arrival 10/10 — fast, clean impulse back into zone
Base Duration 4/10 — 4-candle base (acceptable, not ideal)
FUNDAMENTAL CONSENSUS — 3/5 ALIGNED BEARISH
Location: Upper third of HTF range — technically expensive
Seasonality: June lookbacks point lower for USD/MXN
Trend: Downtrend — lower highs and lower lows confirmed since Sept 2024
COT: Neutral — no extreme positioning in MXN futures
Valuation (DXY): Neutral — no opposing pressure, not contradicting
TRADE PARAMETERS
Direction: Short
Entry: 17.236 (E3 — confirmation entry on shooting star pattern in zone)
Stop Loss: 17.607 (zone distal — HTF weekly mode)
Breakeven: Move stop to entry at 17.051 (half-distance to T1)
T1: 16.865 (−1R) — move to breakeven
T2: 16.494 (−2R) — take 50% partial, trail remainder
T3: 16.122 (−3R) — trail with-trend only
R:R: 1:2.0 to T2
Alternative E2 (zone midpoint 17.343) offers 1:2.9 R:R but may not fill if price only grazes the proximal edge.
INVALIDATION
The bearish thesis is invalidated if USD/MXN closes above 17.607 on the weekly. A surprise Banxico rate cut, a sharp DXY breakout above 105, or a broad EM risk-off event would also cancel this trade regardless of price level.
WHAT THIS SETUP TEACHES
The RBD flip zone marks a price level where prior buyers were completely overwhelmed — the base from which a large distribution move originated. When price returns to a fresh, untested supply zone with trend and seasonality aligned, you are entering alongside the same institutional sellers at their defined cost basis. The edge here is not the direction call (forex is statistically the weakest class in the engine) — the edge is the zone quality and the defined risk. A 9.1 composite means the zone structure is clean and institutional. A 0.5% risk cap means one loss costs half a percent. That is how you trade low-conviction setups responsibly: smaller size, same discipline.
Are you watching 17.236–17.607 on USDMXN? Drop your level below.
Educational analysis based on supply/demand methodology. Not financial advice. Always use proper risk management.
Is USD/MXN the Ultimate Market Predictor?The USD/MXN currency pair dominates North American finance. Strong May 2026 US jobs data lifted the dollar but failed to crush the resilient Mexican Peso. USD/MXN currently trades around 17.30-17.35, near multi-year lows.
US nonfarm payrolls beat expectations dramatically. Payrolls rose 172,000 in May 2026, more than double the 85,000 consensus. The unemployment rate held steady at 4.3%, while March and April combined were revised up by 93,000 jobs.
The exchange rate sits at the lower end of the 52-week range of 17.0850 to 19.4452. USD/MXN has actually DECLINED 10.41% over the past year, marking sustained Mexican Peso strength against the dollar. This counterintuitive resilience signals massive underlying global shifts. Investors must look beyond simple interest rate differentials. Macroeconomic indicators tell only a fraction of this complex story. We must analyze the hidden forces driving this critical pair.
Geopolitics and Geostrategy
Geopolitics heavily dictates USD/MXN valuation today. Nearshoring physically redraws global supply lines and trade routes.
US corporations aggressively relocate factories from Asia to Mexico. The strategic pivot strengthens the Mexican economy fundamentally.
Geostrategic rivalries force this unprecedented North American industrial alignment. Trade agreements lock both nations into a shared financial destiny.
Furthermore, the US-Iran war that began February 28, 2026, created risk-averse market conditions. The Mexican Peso, traditionally vulnerable to risk-off moves, has remained remarkably stable against the dollar. The Peso actively absorbs every international geopolitical shockwave with growing resilience.
Macroeconomics and Industry Trends
Macroeconomic data directly triggers violent market reactions. May 2026 nonfarm payrolls of +172K versus 85K expected fueled Fed rate hike expectations. Markets now price approximately 60% probability of a Fed hike by end-2026.
The Federal Reserve under new Chairman Kevin Warsh maintains a hawkish stance. Average hourly earnings rose 0.3% month-over-month and 3.4% year-over-year. The DXY rose 0.5% in June after gaining 0.9% in May.
However, overarching industry trends support a resilient Mexican Peso. Massive cross-border logistics operations drive continuous corporate currency demand.
Moreover, supply chain localization represents a permanent industrial shift. The Peso has outperformed most emerging market currencies through the rate hike cycle, largely due to nearshoring foreign direct investment. Smart investors track these physical industry movements closely.
Technology and Cybersecurity
Cross-border financial transactions require elite cybersecurity protocols. Hackers constantly probe currency exchanges and digital remittance networks.
Advanced fintech startups actively disrupt traditional Peso conversion models. The recent CVE-2026-0300 PAN-OS firewall zero-day exposed ongoing infrastructure vulnerabilities.
High-tech manufacturing corridors explode across northern Mexican states. Companies pour billions into secure Mexican semiconductor facilities.
Furthermore, robust tech infrastructure physically underpins this currency pair. Cyber vulnerabilities directly threaten international currency stability, particularly around US-Mexico trade flows worth over $700 billion annually. Modern financial systems require absolute cyber resilience.
Science, Patents, and Innovation
Scientific collaboration fuels the modern US-Mexico industrial border. Electric vehicle production demands new localized patent registrations.
American firms protect their IP while leveraging Mexican talent. The vital intellectual property exchange stabilizes long-term currency flows.
Innovative engineering hubs now rival traditional Asian manufacturing centers. Corporate science directly drives physical capital into Mexico.
Moreover, Tesla, Ford, BMW, and other automotive giants continue expanding Mexican operations. Patent analysis reveals massive future cross-border investments across EV, semiconductor, and aerospace sectors. The IP migration anchors long-term Peso demand structurally.
Business Models and Management
Corporate executives constantly battle USD/MXN volatility. Smart management teams utilize dynamic hedging strategies to survive. Cross-border company culture demands extreme financial and operational agility.
Forward-thinking leaders build resilient, bi-national business models. They leverage a highly skilled, cost-effective Mexican tech workforce.
The operational innovation maximizes corporate profit margins significantly. The currency pair directly grades these executive leadership decisions.
Furthermore, the Mexican government’s stable monetary policy framework supports the Peso through volatility cycles. Banxico’s elevated rates remain attractive to carry traders despite Fed hawkishness. The institutional rate differential continues anchoring USD/MXN at multi-year lows.
Investor Catalysts and Risks
Key catalysts and risks investors must monitor include:
* US June NFP and Fed rate decision trajectory
* Mexican CPI data and Banxico rate path
* US-China trade framework execution
* USMCA review timing
* Iran war ceasefire developments
* Tesla/Ford/BMW Mexican investment milestones
* 2026 Mexican election year political stability
* Trump administration trade policy shifts
* DXY trajectory through Q3 2026
Decoding the Financial Matrix
The USD/MXN rate represents a complex global matrix. The 17.30-17.35 trading range reflects technological integration, cybersecurity strength, and geopolitical leverage of the Mexican economy. Smart investors never ignore these diverse operational domains.
You must analyze the entire cross-border ecosystem systematically. The Peso tracks much more than simple macroeconomic data. Despite the dramatic May 2026 NFP beat, USD/MXN remains anchored near 17.30, reflecting structural nearshoring demand for Pesos. Master this complex currency pair to capture sustained market alpha through 2026 and beyond.
USD/MXN — Double Bottom Still in PlayUSD/MXN continues to build a potential double bottom structure.
The setup remains constructive, and the 50-period moving average is starting to cross above the 200-period moving average, adding strength to the bullish case.
Target remains at 18.03.
I like current levels for medium-term long positions, especially as long as price holds above the recent bottom area.
This is the kind of setup where patience matters: the market is not screaming yet, but it is starting to talk.
#USDMXN #Forex #FX #TechnicalAnalysis #TradingView #MexicanPeso #USDollar #RiskManagement #Hedging
USD/MXN — Bullish Reversal SetupUSD/MXN is starting to build a potential double bottom.
Price action is gaining strength after breaking out of the falling wedge, and the setup is becoming more constructive for a medium-term long position.
First target: 17.45 / 17.55
Main target: 18.03
I believe current levels offer an attractive entry zone for medium-term long positions.
Invalidation would come with a strong close back below the recent bottom area around 17.15.
This looks like one of those setups where the risk/reward starts to make sense before the crowd gets comfortable.
#USDMXN #Forex #FX #TechnicalAnalysis #TradingView #RiskManagement #MexicanPeso #USDollar
USD/MXN Rejects Moving Average, Range Support in FocusUSD/MXN is showing renewed downside pressure on the daily chart after failing to sustain momentum near the 50-day SMA. Price recently pushed into the 17.50–17.60 region but was rejected, placing the pair back toward the lower half of its current range.
The broader structure remains cautious. Price is still trading below the 200-day SMA, and the 50-day SMA also remains below the 200-day SMA, reflecting a bearish longer-term trend bias. The 17.6214 level continues to act as an important resistance reference, with the latest rejection below that zone reinforcing its significance.
Momentum indicators are also leaning soft. MACD remains below the zero line, and while the lines have attempted to recover, momentum has not yet shifted decisively back into positive territory. RSI is near 39, showing weaker momentum and keeping the pair below the neutral 50 level.
From a price action perspective, the 17.1226 area remains the key range support visible on the chart. A continued hold above that zone would suggest consolidation remains active, while sustained weakness toward that level would keep sellers in control of the short-term structure.
Overall, USD/MXN remains technically vulnerable while trading below the 50-day and 200-day SMAs, with resistance near 17.6214 and support around 17.1226 defining the current range.
-MW
Is the Mexican peso rally built to last? Banco de México has maintained relatively high interest rates compared with the U.S. Federal Reserve, creating a notable yield differential in favour of the Mexican peso .
USD/MXN is down 14.79% this year. Potentially adding fuel to the fire is Banco de México’s private analysts’ poll, showing that most economists now expect inflation to finish higher this year and next year. Core CPI is projected to end 2026 at 4.17%, up from 4.11% in the previous poll.
Still, this carry trades carries risk. Banxico Deputy Governor Galia Borja said the central bank still has room to reduce rates, pointing to weaker consumer spending, and the appreciation of the Mexican peso, which is expected to help contain inflation pressures.
Momentum in currencies like the Mexican peso highlights a wider set of opportunities developing across global FX markets.
BlackBull Markets enables access to exotic pairs such as GBPMXN, GBPTRY, CHFZAR, GBPHKD, EURCNH, and NZDCNH, alongside a range of other emerging market crosses.
Trend reversal Feed by geopolitics in the middle-east, institutions / central banks moving from metals to the dollar for safety.
Possible upside trend beginning in a few dollar pairs like USDZAR and USDMXN.
Need to see strong support on $18 for confirmation.
TARGET - $19.5 to $20
STOP LOSS - Below Correction low or 65% retracement level
Checklist
Increasing volume YES
5 waves up YES
Correction complete (pull back) YES
Above DEMA 233 Day - Yes
PITCHFORK - Standard and Schiff Pitchfork fit current wave up
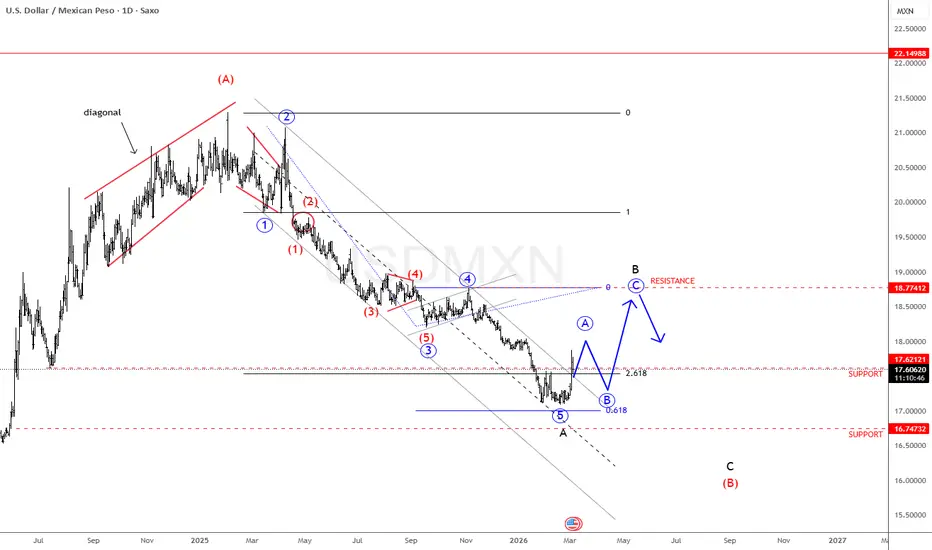
USD/MXN Elliott Wave Outlook: Corrective Recovery In FocusUSD/MXN has been in a well-defined downtrend since the beginning of 2025, when we identified a major top formation. The pair has since developed a clear five-wave impulsive decline, characterized by consistent lower highs and lower swing lows — confirming strong bearish momentum.
Recently, we observed the completion of wave 5, marking the end of wave A within a larger corrective structure. Following that low, price has staged a sharp recovery and broken back above the descending channel resistance, signaling a potential shift in momentum.
This breakout suggests that wave B of a higher-degree ABC corrective pattern is now underway. If this scenario unfolds as expected, the recovery could extend toward the 18.77 resistance area. Since corrective waves often develop in complex formations, this upward move may take time and unfold in multiple internal swings before completion.
Key Level to Watch:
Resistance: 18.77
Structure: ABC corrective recovery (wave B in progress)