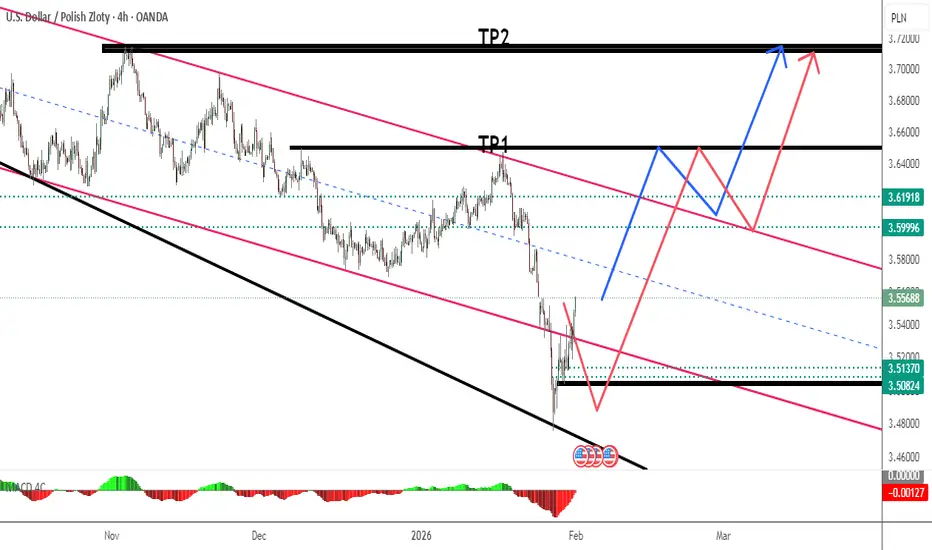
USD/PLN — Long at Demand After Pullback [Quantum Algo]USDPLN
Context:
USD/PLN has been carving out a recovery structure since the early-June lows around 3.62. Price rallied to 3.70 before pulling back over the past few days. Now, at the 3.658 demand zone where previous lows have held, a fresh Buy signal has fired as the pullback finds support.
Why this setup works — three confluences:
Pullback into structural demand — the 3.65–3.66 zone has been tested multiple times and held every time. Each successful test strengthens the level. When demand consistently absorbs selling at the same zone, it tells you institutional bids are stacked at this price
Higher low structure intact — despite the pullback from 3.70, the current low at 3.65 is well above the early-June low at 3.62. The broader ascending structure of higher lows remains intact. As long as 3.62 holds, the trend bias is bullish
Range pullback in established trend — the move from 3.62 to 3.70 was the impulse leg. The current pullback to 3.65 is a corrective retracement — not a trend reversal. Pullbacks into demand in established trends are the highest probability re-entry setups
A Buy signal fired at 3.65840. We took it.
Trade management:
Entry: 3.65840
Stop Loss: 3.63660 — below the demand zone and prior structure
TP1: 3.68953 — mid-range resistance, 50% off, stop to breakeven
TP2: 3.69629 — extended target for 100% exit
R:R: ~1:1.4 to TP1, ~1:1.7 to TP2. Tight risk with strong asymmetric reward.
Invalidation: Close below 3.63660 — the higher low structure breaks and the recovery trend fails.
The lesson:
In trending forex pairs, the pullback into structural demand is where the edge lives. Most traders chase breakouts and buy the highs. The disciplined approach is recognizing the impulse, waiting for the corrective pullback to a proven demand zone, and entering on the signal with structure-defined risk below. You give up the rush of catching the breakout in exchange for higher probability and tighter risk.
Signal fired. We took it. Update coming.
⚠️ Disclaimer: This is not financial advice. Trade ideas shared here are for educational and informational purposes only. All trading involves risk — past performance does not guarantee future results. Always do your own research and manage your risk accordingly.
U.S. Dollar / Polish Zloty
No trades
No trades
In-depth trading ideas
USD/PLN Defends Weekly Demand ZoneUSD/PLN has pulled back into a fresh weekly demand zone between 3.6011 and 3.6603 — an RBR (Rally-Base-Rally) origin where buyers previously stepped in with an explosive leg-out. Price has arrived back at this level with clean rejection wicks and three of the five fundamental factors line up to the upside: the pair is in the lower portion of its weekly range (technically cheap), the dollar is undervalued on a rate-of-change basis against the zloty, and seasonality for June points higher. The reaction inside the zone confirms buyers are defending. The setup favors continuation toward 3.7787.
THE ZONE
Type: RBR (Rally-Base-Rally) — Original demand, flip-zone bonus
Range: 3.6011 — 3.6603
Quality Score: 8.5/10
Departure 10/10 — explosive leg-out
Freshness 10/10 — untested since formation
Originality 12/10 — flip zone (prior supply flipped to demand)
Arrival 10/10 — fast, clean impulse back into zone
FUNDAMENTAL CONSENSUS — 3/5 ALIGNED BULLISH
Location: Lower third of HTF range — technically cheap
Valuation: USD undervalued vs zloty (ROC basis) — Rule #1 PASS
Seasonality: June lookbacks point higher for USD/PLN
COT: Neutral — no extreme reading
Trend: Sideways consolidation — not contradicting
TRADE PARAMETERS
Direction: Long
Entry: 3.6603 (E1 — proximal limit at zone edge)
Stop Loss: 3.6011 (zone distal — HTF weekly mode)
Breakeven: Move stop to entry at 3.6899 (half-distance to T1)
T1: 3.7195 (+1R) — move to breakeven
T2: 3.7787 (+2R) — take 50% partial, trail remainder
T3: 3.8379 (+3R) — trail with-trend only
R:R: 1:2.0 to T2
Alternative E2 (midpoint 3.6381) offers 1:3.8 R:R but may not fill on a shallow retrace.
INVALIDATION
The bullish thesis is invalidated if USD/PLN closes below 3.6011 on the weekly. A sharply hawkish National Bank of Poland shift or a broad dollar breakdown would also cancel this trade regardless of price level.
WHAT THIS SETUP TEACHES
The RBR flip zone marks a price level where prior supply was overwhelmed and flipped into demand — institutions defending a cost basis they now treat as support. When price returns to a fresh, untested flip zone with valuation and seasonality both aligned, you are entering alongside the same buyers at a defined-risk level. The edge is patience — let price come to the zone rather than chasing.
Are you watching 3.6603? Drop your target below.
Educational analysis based on supply/demand methodology. Not financial advice. Always use proper risk management.
USD/PLN Pivot: NBP Pause Meets Tech ResilienceThe Polish Zloty stands at a pivotal moment as the National Bank of Poland (NBP) prepares to halt its easing cycle.
While the market widely anticipates a hold at 4.0%, the underlying economic currents, ranging from geopolitical fortification to high-tech patent growth, suggest a complex future for the USD/PLN exchange pair. Traders must look beyond the headline rate decision to understand the structural forces supporting the Zloty.
Macroeconomics: The End of the Cut Cycle
The Monetary Policy Council (MPC) is poised to pause its interest rate cuts. After lowering borrowing costs by 175 basis points last year, Governor Adam Glapinski is signaling a "wait-and-see" approach. A Bloomberg survey confirms this consensus, with 29 of 32 economists expecting a hold. This hawkish pivot supports the Zloty by maintaining a yield advantage over the Dollar, provided the Federal Reserve continues its own easing trajectory. However, the recent drop in inflation below the 2.5% target creates a tail risk. A surprise cut would instantly depreciate the PLN, sending the pair higher.
Geostrategy: The "East Shield" Premium
Geopolitics plays a massive role in the valuation of the PLN. Poland’s "East Shield" initiative, a multi-billion zloty defense infrastructure project, is redefining the country's risk profile. By actively fortifying the eastern flank and investing nearly 5% of GDP in defense, Warsaw is assuring foreign direct investors of long-term stability. This geostrategic assertiveness reduces the "war risk premium" that previously weighed on the currency. Capital flows are returning, viewing Poland not just as a buffer state, but as a secured NATO stronghold.
High-Tech & Industry Trends: Beyond Outsourcing
Poland is rapidly transitioning from a service outsourcing hub to a primary innovator. The IT sector now drives significant export revenue, creating a natural demand for the Zloty. We are seeing a surge in high-value exports in AI and automation, which are less sensitive to currency fluctuations than traditional manufacturing. This structural shift provides a floor for the currency. Even if rates drop, the robust trade balance driven by the technology sector supports the PLN against the USD.
Patent Analysis & Innovation
A look at intellectual property trends confirms this economic maturation. Patent filings from Polish firms in fintech and cybersecurity have risen sharply. This "intellectual sovereignty" implies that future economic growth will be driven by proprietary technology rather than low-cost labor. For currency traders, this signifies long-term strength. An economy built on high-tech IP attracts stickier long-term capital compared to fleeting speculative flows.
Leadership & Governance: The Wildcard
The MPC’s internal dynamics introduce short-term volatility. The appointment of Marcin Zarzecki by President Nawrocki changes the voting calculus. Zarzecki is an unknown quantity, replacing the predictable Cezary Kochalski. His vote could tip the scales in a divided council where members like Ireneusz Dabrowski still argue for cuts. Traders hate uncertainty. Until Zarzecki’s stance becomes clear, the USD/PLN may experience heightened volatility around meeting dates.
Conclusion
The USD/PLN is caught between a hawkish central bank and a disinflationary economy. However, the broader view is bullish for the Zloty. Poland’s geostrategic hardening, combined with a pivot to high-tech innovation, creates a strong fundamental backdrop. Unless the NBP shocks the market with a cut, the path of least resistance for USD/PLN appears to be sideways to lower.
Bears Trapped as Sellers Return to Battlefield📊 To see my confluences and/or linework, step 1: grab chart, step 2: unhide Group 1 in object tree, step 3: hide and unhide specific confluences. 😊
The Market Participant Battle:
The bears who sold at point 2 have proven their strength, with price closing below point 1 at point 3. Now, at point 4, we're returning to this proven set of sellers after a bearish pullback. The bulls who tried to push higher are now trapped at resistance, and the sellers are ready to resume control. This is a classic case of trapped longs meeting a wall of proven supply - expect price to return lower from this battlefield.
Confluences:
Confluence 1: Proven Sellers Zone Return
The close below point 1 at point 3 validates point 2 as a strong supply zone. Point 4 represents our return to these proven sellers. This is a textbook setup where previous resistance has been validated and we're now testing it from below. The market structure clearly shows sellers in control with lower highs being established. The rejection at this level would confirm the continuation of the downtrend.
Confluence 2: Volume Profile Value Area High
Point 4 sits precisely at the Value Area High from the volume profile spanning points 0 to 3. This is significant as VAH often acts as strong resistance in downtrends. The majority of trading volume occurred below this level, suggesting limited acceptance above. Price pulling above the developing POC but stopping at VAH indicates sellers are defending this critical level.
Confluence 3: Anchored VWAP 1st Standard Deviation
The anchored VWAP shows price has pulled back to the first standard deviation at point 4. This is a high-probability mean reversion setup. Statistically, price tends to revert from the 1st standard deviation approximately 68% of the time. The alignment with other confluences strengthens this resistance level significantly.
Confluence 4: Technical Indicator Divergences
RSI and MFI are both showing oversold conditions, but critically, they're failing to make new highs while price attempts to rally. OBV is at the Bollinger Band high, suggesting buying pressure is exhausted. Most importantly, the bullish bar before the most recent bearish bar shows negative delta divergence - buyers couldn't sustain the move despite apparent strength. This is a classic exhaustion signal.
Web Research Findings:
- Technical Analysis: Multiple sources confirm USDPLN is in a strong sell trend across all timeframes (daily to monthly). Current technical ratings show "Strong Sell" signals dominating.
- Recent News/Earnings: Poland's Q2 2025 GDP growth accelerated to 3.4% y/y, beating expectations and showing economic resilience. This fundamental strength supports PLN appreciation.
- Analyst Sentiment: Consensus forecasts suggest USDPLN could decline to 3.57-3.62 range by year-end, with bearish sentiment prevailing through 2025.
- Data Releases & Economic Calendar: NBP cut rates by 25bp to 4.75% in September, but remains relatively hawkish. Fed also cut 25bp to 4.00-4.25%, but diverging economic performance favors PLN.
- Interest Rate Impact: Rate differential narrowing (Fed at 4.25% vs NBP at 4.75%) reduces USD carry advantage. Poland's stronger growth outlook supports further PLN strength.
Layman's Summary:
Simply put, Poland's economy is outperforming expectations while maintaining relatively high interest rates. The US is cutting rates due to labor market concerns while Poland cuts from a position of strength. This means Polish Zloty should continue strengthening against the Dollar. The technical picture shows sellers firmly in control, with multiple resistance levels converging right where price currently sits. It's like trying to break through a ceiling that gets stronger each time you hit it.
Machine Derived Information:
- Image 1: Volume Footprint showing delta divergences and volume clusters - Significance: Negative delta at resistance confirms seller absorption - AGREES ✔
- Image 2: 4H chart with numbered wave structure and volume profiles - Significance: Clear resistance zone identification with multiple touches validating supply - AGREES ✔
- Image 3: 4H chart with indicators showing divergences - Significance: Oscillator exhaustion signals align with resistance test - AGREES ✔
Actionable Machine Summary:
All three charts confirm the same story: We're at a critical resistance zone where multiple technical factors align. The volume analysis shows sellers absorbing buying pressure, the structure shows a clear downtrend with lower highs, and indicators show exhaustion of the current rally. This creates a high-probability short setup with clearly defined risk parameters.
Conclusion:
Trade Prediction: SUCCESS
Confidence: High
This trade aligns perfectly with both technical and fundamental analysis. The convergence of proven sellers, volume profile resistance, VWAP deviation, and indicator divergences creates a compelling short setup. Fundamentally, Poland's economic outperformance and narrowing rate differentials support continued PLN strength. Risk/Reward is excellent with stops above point 2 and targets toward point 3 lows and beyond. This is a textbook reversal setup at resistance.
USD/PLN Analysis (310 words) The current USD/PLN trajectory iUSD/PLN Analysis (310 words)
The current USD/PLN trajectory is shaped by a sharp clash between global and local forces. **Broad-based USD strength** remains the primary upward driver, as persistently delayed market expectations for Fed rate cuts keep dollar yields elevated, attracting capital flows and pressuring the pair broadly.
However, the USD/PLN’s distinct feature is the **resilience of the złoty**. This is largely attributable to Poland’s solid macroeconomic fundamentals, notably its **relatively high interest rates (currently 5.75%)**, which encourage carry trades and provide underlying support. Additionally, anticipated inflows of EU recovery funds have improved the fiscal outlook and bolstered market confidence.
Near-term volatility will heavily depend on the **monetary stance of the National Bank of Poland (NBP)** and shifts in **global risk sentiment**. A more hawkish-than-expected hold by the NBP against inflationary pressures could limit the złoty’s declines. Technically, the **4.00** level represents a critical psychological and technical resistance. A sustained break above could open the path toward the 4.05–4.10 zone. Conversely, should dollar momentum fade, the pair may retreat to consolidate within the 3.95–3.92 support band. Geopolitical uncertainty remains a latent risk factor.
USDPLN Long Swing trade FX_IDC:USDPLN Long Swing trade, with my back testing of this strategy, USDPLN is bullish
This is good trade.
Don't overload your risk like Greedy gambler!!!
Be Disciplined Trader, what what you can afford.
Use proper risk management
Looks like good trade.
Lets monitor.
Use proper risk management.
Disclaimer: only idea, not advice
USDPLN - getting to the Support (W1)Polish zloty has recently been a very popular asset to invest.
Probably is has been so because of high Interest Rates and weakness of USD overall
Now, however, like EUR, it is coming to a significant technical support at 3.5597, where we have FR 61.8 of the multiyear uptrend move (starting in April 2011 - Yes) confirmed with FR 161.8 of the latest significant correction. This level has been respected by the market many time before.
I have no idea what US administration is going to invent yet and ho it will impact the markets. Yet, if technicals count, this is the level to watch.
Just my humble opinion.
Recent outperformance of Poland nothing out of the ordinaryRecent outperformance of the Polish stock market against the global ex US stock market has been something not seen in a long time and many are afraid of over valuation or high sentiment on Polish stocks however the recent outperformance has been correlated with the performance of the Zloty against the US and in essence is close to the historic outperformance of the polish stocks during times of Zloty outperformance
The #1 Correction In Forex TradingThis is a late entry unfortunately the last
signal i was wrong again.
But this one i think am write on spot.
Because it is definitely following the trend
The price is below the 50 EMA
The price is below the 200 EMA
The price is trending downwards.
The problem with my last trade was that it was not
parabolic on the entry.
With this one i did not
screen the forex pair from the broker
instead i screened from the
Future markets which
has made a lot of difference
The forex brokers are known for manipulating
prices
This is why to screen forex its better
to screen from the futures markets.
Rocket boost this content to learn more.
Disclaimer:trading is risky please risk management and
profit taking strategies.
Also feel free to use a simulation trading account
before you trade with real money.
USDPLN RSI Bullish Divergence – Bounce Setup with 1:2 R:RI'm spotting a potential bullish reversal on USDPLN after a confirmed RSI bullish divergence on the daily chart. Price made a lower low while RSI printed a higher low, signaling fading bearish momentum.
I’m waiting for a confirmation candle (such as a bullish engulfing or hammer) to enter. This trade setup offers a clean 1:2 risk-to-reward ratio with tight risk control.
Setup Details:
Entry: 3.7600 (above confirmation candle)
Stop Loss: 3.7500 (below divergence low)
Take Profit: 3.7800 (conservative R:R target)
RSI is currently recovering from the 30 level, volume is picking up, and price is showing signs of exhaustion. I’ll exit early if the RSI shows weakness or price gets rejected near 3.7700.
This setup is part of my RSI Divergence strategy — perfect for catching early reversals before the market fully shifts.
USDPLN Retesting the break line and support zone LONGHello fellow traders,
Here is my idea for the pair USD PLN with major support level and retest of the break downtrend line. This is just an idea not a trading advise, always protect your capital, here I have a s/l below 3.76-3.65 when triggered I will manually react, with the T/P as indicated first at 4.2 and second 4.4 being Fob levels of usual reaction,
also, the tarrifs are now sorted, dollar has also dipped and with a chance for recovery following the tax relief for businesses settling in USA good chance for the prosperity of the country and their currency
all the best, good luck