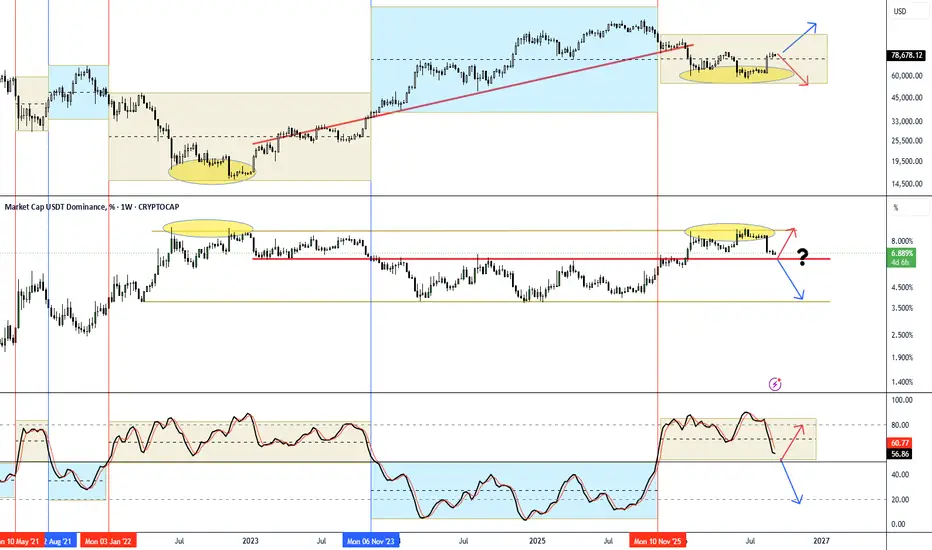
USDT Dominance (USDT.D)USDT Dominance is trading around 8.45% after facing rejection from the 9.4–9.6% major resistance zone. Price is now pulling back and testing a short-term support area.
Since USDT Dominance typically moves inversely to the crypto market, a decline in USDT.D is generally favorable for Bitcoin and altcoins.
📍 Current Level: ~8.45%
🟢 Major Support: 8.20–8.30%
🔴 Key Resistance: 9.40–9.60%
Bullish Scenario for Crypto (Bearish USDT.D)
If USDT Dominance breaks below the 8.20% support, it would indicate capital rotating out of stablecoins and back into crypto assets.
🎯 Next USDT.D Targets: 7.80% → 7.20%
➡️ Implication: Bullish for BTC, ETH, and Altcoins.
Bearish Scenario for Crypto (Bullish USDT.D)
If the current support holds and USDT Dominance rebounds, it could revisit the resistance zone.
🎯 Resistance Retest: 9.40–9.60%
➡️ Implication: Increased selling pressure across the crypto market.
⚠️ Key Level to Watch: 8.20%. A confirmed breakdown would strengthen the bullish outlook for the broader crypto market.
Market Outlook: Moderately Bullish for Crypto. USDT.D has been rejected from a major resistance area and is currently testing support. The next decisive move from this level is likely to influence overall market direction.
Market Cap USDT Dominance, %
No trades
No trades
In-depth trading ideas
USDT.D Retest in Progress | Altcoins at Risk?Well, as I can see here, USDT.D is now retesting the breakout trendline. If this retest plays out successfully, altcoins could see another leg to the downside.
So for now, keep your position sizes small and make sure your risk management stays tight.
DYOR, NFA
USDT Dominance The arrows only represent a possible scenario for the Tether Dominance (USDT.D) movement, not a certain prediction.
If USDT Dominance fails to break the 9.7–10 resistance zone, there is a possibility of an initial correction, followed by another attempt to retest the resistance.
In this scenario, a decline in USDT Dominance could mean liquidity flowing back into Bitcoin and altcoins, which may support the crypto market.
However, if the resistance is broken and USDT.D manages to hold above 10, this scenario becomes invalid, and we should expect more selling pressure across the crypto market.
$USDT.D Update & Overall Market UpdateCurrently moving sideways, overall the USDT.D is on a downtrend as you can see from above, which is accurate, couple of days ago we have broken from below a powerful horizontal support, (green rectangle)
So, here we might be going for a retest, or we will simply crash from here.
Which is BULLISH for the crypto-market, because if USDT.D Goes down, the market goes up.
USDT Dominance AnalysisCRYPTOCAP:USDT Dominance Analysis
USDT.D previously rejected from the range high, triggering strong relief rally across the crypto market. It has now found support at the range low, causing Bitcoin and the broader crypto market to retrace (dump).
Next key level → Mid-range resistance.
Rejection at mid-range → Likely to trigger another relief rally (upside move) in BTC and altcoins.
Breakout above mid-range → Confirms further strength in USDT.D and increases the probability of deeper corrections across altcoins.
Understanding:
USDT.D shows how much of the crypto market is held in USDT.
Rising → traders moving to safety (bearish sign)
Falling → funds flowing into crypto (bullish sign)
USDT.D - 1H - 24.07.2026🔎 Concise Takeaway
USDT dominance is pressing into a major resistance cluster (8.486%–8.550%) after a strong move up from support. This is a decision zone: either dominance rejects (bullish for crypto) or breaks out (bearish for crypto).
📈 Trend & Structure
Clear short-term uptrend: higher highs and higher lows.
Momentum is still strong — candles expanded on the move from the blue support zone.
Price is now stalling inside the resistance band, showing hesitation.
This is classic behaviour before either:
A pullback, or
A breakout continuation.
🟦 Support Zone (8.410%–8.418%)
This zone is important because:
It’s the origin of the last impulsive move.
Buyers stepped in aggressively here.
It’s the nearest “retest” level if dominance pulls back.
🧠 Non‑Obvious Insight
If dominance returns to this zone and holds, crypto may see short-term weakness again.
If it breaks, crypto gets to pump some more.
The chart shows compression inside resistance, which is often a precursor to a volatility expansion.
This means the next move is likely fast and directional, not slow and choppy.
USDT.D + USDC.D 1W | Stablecoin Dominance AnalysisThis is just my personal view of the current market.
In my opinion, the combined USDT + USDC Dominance is still following its uptrend, and at the moment I don't see a strong reason for that trend to change before liquidity is taken from the highs.
The current move is supported by a strong support zone, the EMA 21, and the SHA indicator, all of which continue to support the current trend.
For me, this chart is one of the most important indicators for the crypto market. If Stablecoin Dominance continues to rise, it would likely mean that more capital is moving into stablecoins, which could put additional pressure on the crypto market.
Based on the current market structure, I still believe there is room for further upside. The highlighted liquidity zones above are the areas I'm watching most closely.
Of course, the best outcome for crypto would be for Stablecoin Dominance to reverse from here, but I think one more move higher is still possible.
That could create even more bullish sentiment, encouraging more people to enter the market and believe that the bull run is continuing. From my perspective, the current uptrend has not ended yet.
As always, this is just my personal analysis, not financial advice. The market can change at any time, and no one knows the exact direction. The market can always prove us wrong, but I prefer to trust what my charts are telling me.
Good luck, everyone! 🍀📈
Stablecoin Dominance: ITS VERY IMPORTENT Stablecoin dominance CRYPTOCAP:USDT CRYPTOCAP:USDC CRYPTOCAP:DAI + DAI measures how much capital is sitting on the sidelines instead of being invested in crypto.
Today it stands at 11.8%.
For comparison, the rise from 6% to 11% coincided with Bitcoin losing roughly 50% since late 2025.
Historically, major crypto bottoms have formed when stablecoin dominance reached around 16%.
Right now, this chart is testing a critical support trendline that has held since the bear market began.
That gives us two possible scenarios.
📉 Bearish Scenario
Stablecoin dominance bounces from support and continues higher.
That means more money flows into cash, liquidity leaves crypto, and the broader market continues making new lows.
This remains my primary scenario.
📈 Bullish Scenario
Stablecoin dominance breaks below support and heads toward 9%.
That would signal capital flowing back into crypto, potentially triggering a summer rally that could even evolve into a new bull market.
⚠️ All Eyes on the Fed
In just two days, the FOMC meeting could decide which scenario plays out.
The market already expects no rate cut.
What really matters is the Fed's guidance:
• A dovish tone could trigger Scenario 2 (bullish) .
• A hawkish tone would likely support Scenario 1 (bearish) .
The reaction in stablecoin dominance will be one of the clearest signals to watch over the coming days📊
_____
👉 If you want to trade like a professional and not like a gambler — follow for real insights and strategies 🚀
USDT.D The Calm Before the Storm?This is my personal view of the current market structure.
I believe USDT Dominance is currently forming Wave 5 of the Elliott Wave structure. At the moment, USDT.D is sitting on a strong confluence of support:
🔹 Horizontal support
🔹 Bull Flag
🔹 SHA support
We've been consolidating in this area for around two weeks, suggesting that the market is still building energy before the next major move.
I expect July may still allow some upside for altcoins, meaning USDT.D could continue to range in this zone for a bit longer. However, I think August could mark the beginning of another move higher for USDT.D, which would likely put renewed pressure on the altcoin market.
The projected path and dates are only an approximation of how I currently see the structure developing; they're not meant to predict exact timing.
I decided to share this because lately I've been seeing "Altseason is here!" almost everywhere. Personally, I think many traders are getting ahead of themselves.
If USDT.D continues to rise, I'll keep DCAing into projects I strongly believe in, especially ETH and a few other long-term holdings.
Good luck, everyone! 🍀📈
USDT.D - Mixed Signal One idea that is contrary to my most recent BTC post is what I am currently seeing with Tether dominance. To understand what I mean, it is important to go back to my past two USDT.D posts:
I was predicting a local high forming around the 9.25% level, followed by a rejection from overbought conditions that would flip trend momentum to the downside and signal cash re-deploying back into the crypto markets.
This is exactly what played out. The high came in on June 25th at 9.35%, with all subsequent daily candle bodies closing below my yellow ray. Trend momentum began shifting on June 26th right from overbought conditions, confirming the rejection I was predicting. Since then, Tether dominance has declined over 1% as cash has been redeployed into the market, driving crypto prices higher.
Dominance has now reached a very interesting level, the 8.25% level I have outlined with a blue ray and labeled "Key Level." Even before dominance reached this level following the breakout, I had already been outlining this as a key future level to watch. You can view that past idea here:
This is now the second time dominance is attempting to form a low at this exact level, which is why it stands contrary to my bullish outlook for Bitcoin outlined in this recent idea:
If USDT.D forms a low here and begins rising, that would signal a risk-off shift for the rest of the crypto market, causing prices to decline as participants exit crypto assets and convert back to cash, which would not support the continued move to the upside I have been outlining.
Yesterday, USDT.D formed a daily reversal doji that has started pushing dominance higher and crypto prices lower. This also coincides with a double bottom forming right around the 8.25% key level. Adding to this, a hidden bullish divergence is forming on the RSI, a higher low or double bottom on dominance paired with a lower low on the RSI.
Because of this, it is imperative that we see dominance fail to climb and instead close below the key level with a confirmed daily close, in order for Bitcoin to break higher and dominance to fall back toward the top of the parallel channel.
This could actually be aligning with a rejection from the level that was previously holding dominance to the upside. As long as daily candle bodies continue closing below this trendline, the entire contrary idea just laid out is invalidated, and BTC should continue to the upside while dominance continues to decline:
I am sticking to my primary thesis that crypto is still likely to climb, which would mean dominance should start rolling over again from here. But given the early developments I just outlined, I wanted to flag this contrary signal so we are prepared in case this does turn out to be a local low forming for Tether dominance.
Mapping out the crypto market | The holy grail.USDT Dominance (USDT.D) & USDC Dominance (USDC.D) are approaching what I believe will be one of the most important decision points for crypto liquidity into year-end.
In this analysis, I'm combining **Smart Money Technique (SMT) divergence**, stablecoin dominance, and higher-timeframe market structure with time cycles to map out where I expect liquidity to shift and when those shifts are most likely to occur.
The focus of this study includes:
• SSMT divergence between USDT.D and USDC.D
• Time-based pivot windows into the end of the year
• Expected reaction zones rather than exact reversal points
Remember that **stablecoin dominance typically moves inversely to crypto prices**. A rejection from projected resistance on USDT.D/USDC.D may signal capital rotating back into risk assets, while continuation higher would suggest defensive positioning and potential weakness across the market.
The timing aspect is equally important. Instead of only identifying price targets, this analysis highlights the periods where I expect the highest probability of meaningful reactions based on confluence between structure, SMT, and cycle timing.
As always, these are **probability-based scenarios**, not predictions. The market will ultimately confirm or invalidate the thesis through price action.
If you find the analysis valuable:
👍 Boost the idea
💬 Share your view in the comments
⭐ Follow for more Smart Money, ICT, SMT, liquidity, and cycle-based market analysis.
#TradingView #Crypto #Bitcoin #Altcoins #USDT #USDC #USDTD #USDCD #SMT #ICT #SmartMoney #Liquidity #MarketStructure #CryptoTrading #TechnicalAnalysis #PriceAction #Dominance #BTC #ETH #Altseason #Trading
The Tether Funding Trade: Collect Yield or Bet on a DepegTL;DR
There's a trade on BitMEX that pays a delta-neutral yield of roughly up to 43% a year; the same structure could also turn into a cheap bet that pays off big if Tether ever loses its $1 peg.
Both come from one gap: the difference in funding (the “cost to hold”) between BitMEX's two Bitcoin perpetuals – XBTUSD (margined in Bitcoin) and XBTUSDT (margined in Tether). They track the same Bitcoin price, but the two charge different fundings, and that difference makes up the whole trade:
Trade 1 – Farm the Yield: Collect the funding difference between the two contracts. It's market-neutral (you don't care whether Bitcoin goes up or down) and has paid about 4% a year with no leverage, or ~13% at 10× leverage. The catch: this position quietly leaves you holding Tether, so you lose if Tether ever breaks its peg.
Trade 2 – Bet on a Depeg: Do the exact opposite. You pay that small funding difference as a running cost, and in return you get paid a lot if Tether ever falls below $1. Your loss is capped at the small cost but your payout is not.
Recap: XBTUSD <> XBTUSDT
BitMEX offers two distinct Bitcoin perpetuals, each serving a different trading crowd. The divergence in their funding rates creates the trading opportunities we've explored:
XBTUSD (Inverse): Margined in Bitcoin, PnL is in Bitcoin. Favored by long-term holders and hedgers who want pure Bitcoin exposure without the stablecoin risk.
XBTUSDT (Linear): Margined in Tether, PnL is in Tether. The industry-standard format favored by stablecoin traders who tend to lean long.
While both track the same Bitcoin spot price, they maintain separate order books and funding rates. Because the stablecoin crowd leans long, XBTUSDT typically commands a higher funding cost. This delta, the difference in the “cost to hold”, is the source of our yield farming and depeg hedging strategies.
It's a BitMEX Trade
Thanks to multi-asset-margin on BitMEX, you can execute this strategy seamlessly in one place:
Unified Margin: Open both positions (long/short XBTUSD and the inverse on XBTUSDT) using only USDT collateral within a single account.
Efficiency: Capture the funding spread directly. There is no need to move collateral between exchanges or manage counterparty risk.
This integrated environment allows you to manage the entire trade—whether you’re farming yield or betting on a depeg—with maximum operational efficiency.
Trade 1 — Farm the Yield
XBTUSDT has cost more to hold than XBTUSD for most of the last 4.6 years.
While returns are market-dependent—averaging 4.33% over the long term—recent windows have been tighter, with 1.33% over the last year and 0.53% over the previous quarter. Interestingly, XBTUSDT only carries a higher premium 46.5% of the time; the yield is driven by the magnitude of these spreads rather than their frequency.
That said, profits arrive in aggressive bursts rather than a steady stream. Execution involves a short on XBTUSDT paired with an equal long on XBTUSD. This delta-neutral structure eliminates Bitcoin price risk, allowing you to harvest the funding gap.
Amplifying Returns with Leverage
Because this trade is delta-neutral and insulated from directional price risk, you can apply leverage to amplify your funding capture. This strategy effectively transforms modest single-digit returns into substantial double-digit gains of 13%-43.2% with 10x leverage.
The Risk: Tether Depeg
Behind the attractive yield lies a hidden risk factor: once your Bitcoin exposure is neutralised, you are essentially holding a long position on Tether's stability. Think of the funding you harvest as compensation for absorbing Tether risk. Should USDT falter, this trade absorbs the blow—and leverage multiplies the damage.
Trade 2 — Bet on a Depeg
Execute the reverse: short XBTUSD and go long XBTUSDT. Your Bitcoin exposure is again neutralised, but you are now positioned to profit if Tether breaks its $1 peg.
The mechanics are simple: monitor the XBTUSD / XBTUSDT ratio, which represents the market's implied valuation of Tether. While the peg is secure, the ratio hovers near 1.00. Should Tether slip to $0.98, the ratio follows; your long on XBTUSDT appreciates relative to the short, capturing the spread as pure profit. This is effectively a direct wager against Tether's stability, executable via two standard BitMEX orders without requiring specialised accounts or additional counterparties.
The Cost:
You pay the funding divergence described in Trade 1—historically between 1.3% and 4.3% annually. View this as a modest, recurring premium for a high-convexity payout.
The Payout:
The payout mirrors Trade 1 in reverse – where every loss is now inverted into a gain.
Your loss is limited to the small fee you pay (plus minor moves if Tether trades slightly above $1). Your payout would be substantial if Tether becomes insolvent.
Tether Depegs in the past
In normal conditions, the depeg bet generates no returns. Payouts occur only under periods of intense stablecoin stress. To evaluate the trade’s viability, we analysed 1-minute historical data to capture the precise maximum spread during actual crises. Below is the record of the divergence between XBTUSD and XBTUSDT during three major market shocks. The depeg bet harvests this divergence; the yield farmer absorbs the corresponding loss.
Note that tick data may differ; these figures are used for illustrative purposes to demonstrate the concept.
Terra May 2022 (win) : The contracts diverged by +5.6% at the peak of the panic—XBTUSD traded at ~$25,900 while XBTUSDT hit ~$27,300, effectively pricing Tether at ~$0.95. This move delivered a +56% return at 10× leverage for depeg bettors.
FTX Nov 2022 (win): The spread widened to +2.0%, netting a ~20% gain at 10× leverage.
USDC / Silicon Valley Bank Mar 2023 (loss) : The gap inverted to -1.2% as capital rotated from USDC into Tether. Because this trade is a specific short on Tether, a flight to Tether’s perceived safety results in a ~12% loss at 10× leverage.
Crucially, this position is effectively a short on Tether’s stability. While systemic shocks to rival stablecoins can temporarily drive Tether to a premium, its long-term resilience is noteworthy; USDT has not slipped more than 0.4% below par over the last 4.6 years.
Farm the Yield, or Own the Tail
Farm the Yield if you believe the stablecoin crowd will continue paying a premium to maintain long exposure (a trend persisting for four years), while the funding divergence maintains its 4% average and Tether continues to weather systemic shocks. This delivers a consistent, equity-like yield without directional Bitcoin exposure—provided your leverage is calibrated to survive volatility.
Bet on a depeg to secure a high-convexity position with capped downside; you pay a nominal annual premium for a massive payout during a legitimate Tether solvency crisis. The primary caveats: yield compression occurs during stagnant periods. It may work against you if capital rotates into Tether during a rival stablecoin's collapse, as seen in the USDC depeg in early 2023.
USDT Dominance as a Key Indicator for Bitcoin Market AnalysisHi everyone,
I wanted to share an important observation on USDT Dominance (USDT.D) and how it provides valuable context for Bitcoin price action and broader crypto market trends.
Recently, following geopolitical developments between the US and Iran, Bitcoin experienced a sharp decline, reaching a new local low around $58,000 before bouncing. While we saw a relief rally, the overall structure remains in a downtrend. A primary driver behind this pressure appears to be the behavior of USDT Dominance.
On higher timeframes (daily and weekly charts), USDT.D has maintained a clear uptrend. This is significant because rising stablecoin dominance typically reflects a risk-off environment — investors are parking capital in USDT rather than deploying it into volatile assets like Bitcoin and altcoins. This dynamic often exerts downward pressure on BTC and the broader market.
After several years of a dominant bull market in crypto, we appear to be transitioning into a corrective bear phase. Based on current structure and the prevailing USDT.D trend, I anticipate Bitcoin could test deeper support levels in the $50,000–$45,000 range. A potential recovery and new bullish cycle may begin around the New Year, once this capitulation phase concludes.
This is not financial advice, and markets can always deviate from expectations — always do your own research and manage risk appropriately. However, I view this period as a buying opportunity rather than a reason for panic. Corrections are healthy and create the foundation for the next leg up.
USDT.D Dominance chart Analysis USDT.D (Tether Dominance) shows the percentage of the total crypto market held in Tether (USDT) there is proper bearish divergence perfom in daily TF if HL break we can expect upside movement in crypto specially btc and eth and on the other hand there is bullish divergence on btc and ETH as well this is a great indication now lets see market consolidate in this region or break structure my opinion is consolidation will brings huge rally on upside
USDT.D ↑ → Money moves into USDT → Bearish for crypto
USDT.D ↓ → Money flows from USDT into crypto → Bullish for crypto