BNB: A strong bullish surge indicating further growthBNB: A strong bullish surge indicating further growth
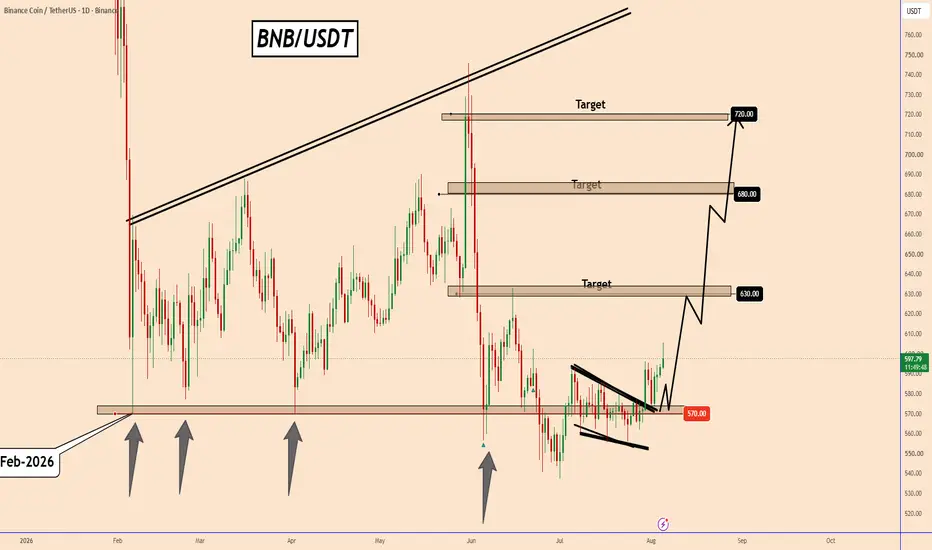
BNB Broke out from the bullish pattern I shared a couple of days ago.
The price seems to be holding very strong above the 570 support area. Also, during these difficult weeks for the cryptocurrency market, BNB found this strong support and is expecting to rise.
Considering that the price is still in a correction, a good idea to buy BNB will only be if it moves holds above the current Flag pattern, or above $570 - $580. If BNB makes this move, it should increase its chances of rising further.
Main targets:
🎯630
🎯680
🎯720
You can find more details on the chart.
Thank you and good luck! 🍀
⚠️PS: Do your own analysis and use your own strategy to join the trade.
❤️ If this analysis helps your trading day, please support it with a like or comment ❤️
In-depth trading ideas
BNB: Nothing Changed...Remains BullishBNB: Nothing Changed...Remains Bullish
Every day, BNB continues to respect our bullish position despite BTC’s movements.
The maximum correction was reached at 585. Although BNB remains in this corrective zone, the bullish momentum is accumulating every day before moving even higher. Nothing has changed from our previous analysis.
All that is required is to be patient and nothing more, because the bullish move should happen. I think it can make a strong move in early September with the increase in market volume.
You can find more details on the chart.
Thank you ! 🍀
⚠️PS: Do your own analysis and use your own strategy to join the trade.
❤️ If this analysis helps your trading day, please support it with a like or comment ❤️
BNBUSDT – Bearish Rejection Setup Toward 587📊 BNBUSDT – Bearish Rejection Setup Toward 587
🔍 Market Overview
BNBUSDT has recovered strongly from the recent lows, but price is now approaching a major resistance zone around 611–632, an area that previously attracted significant selling pressure.
The current rally is still constructive, but the market is moving directly into supply. If buyers begin to lose momentum inside this zone, the recovery could turn into a short-term bearish reversal and create a cleaner selling opportunity.
⸻
📉 Market Structure Insight
Market Bias: Bearish from resistance
Momentum: Bullish recovery approaching exhaustion
Current Phase: Rally into supply and potential rejection
The key factor is not how far price has already risen, but how BNBUSDT behaves once it reaches resistance. A clear failure to sustain above the zone would suggest that sellers are stepping back in.
⸻
🚀 Trading Scenarios
❌ Bearish Scenario (Primary Bias)
Conditions:
Price trades into the 611–632 resistance zone.
Buyers fail to establish a sustained move above resistance.
Bearish confirmation appears through upper-wick rejection, bearish candles, or weakening bullish momentum.
Trade Plan:
Look for selling opportunities only after price clearly rejects the resistance area. A confirmed rejection would increase the probability of a pullback toward the nearest support structure.
🎯 Target: 587
⸻
✅ Bullish Invalidation Scenario
Conditions:
Price breaks decisively above the resistance zone.
BNBUSDT holds above the previous supply area.
Buying momentum continues without meaningful bearish rejection.
A sustained breakout above resistance would invalidate the short setup and suggest that buyers remain in control.
⸻
📍 Key Levels to Monitor
🔴 Major Resistance Zone: 611–632
🟢 Downside Target: 587
⚠️ Invalidation: Sustained trading above the resistance structure
⸻
⚠️ Trading Perspective
BNBUSDT is still below the area where I would prefer to look for shorts. Selling too early while price is still recovering creates unnecessary risk.
The cleaner setup would be for price to enter the resistance zone first, show clear exhaustion, and then confirm that sellers are defending it.
⸻
🧠 Professional Insight
This setup is supported by:
A strong recovery into a previous supply zone.
Historical selling pressure around the highlighted resistance.
The possibility of bullish momentum fading after an extended rebound.
A clearly defined downside objective around 587.
Better risk-to-reward if the entry comes after rejection rather than before it.
The most important signal will be the reaction at resistance. A rejection strengthens the bearish case; a breakout removes it.
⸻
🛡️ Risk Management
Risk only 1–2% of trading capital per position.
Wait for bearish confirmation before entering.
Avoid shorting before price reaches resistance.
Keep invalidation above the confirmed rejection structure.
Respect a clean breakout above supply and protect capital.
No rejection, no trade.
Disclaimer: This analysis is for educational purposes only and should not be considered financial or investment advice.
BNB Trap Before the Big Move?Yello Paradisers! Are you prepared for a potential sharp move on #BNB, or are you still underestimating what’s quietly building behind the scenes? At first glance, this structure might seem like a simple and healthy pullback. But when we strip away emotions and analyse the chart objectively, a completely different narrative emerges. This is not random price action this is a high-risk, high-opportunity zone where discipline matters far more than opinions.
💎#BNB has broken out of the falling wedge pattern, while the overall market structure has gradually started shifting to the upside. On top of that, we can see a clear RSI divergence, which adds more strength to the bullish probability. As long as the price continues to hold momentum inside the order block zone, the structure remains constructive, with 664 acting as the first important resistance level to watch.
💎#BNB has recently printed a classic selling climax, followed by a climactic action candle supported by ultra-high volume. This is a textbook indication of accumulation. Historically, this exact behaviour appears when smart money begins positioning ahead of a larger move. While subtle to the untrained eye, this probability carries significant weight for experienced traders.
💎#BNB has also swept the liquidity below the selling climax with shakeout test and then broken above the upper trigger line with a strong momentum candle. This suggests that weak hands were pushed out before stronger buyers stepped in with conviction. If the prices sustain this momentum, the next upside path can open toward 729, which is currently acting as a major structural resistance level.
💎If #BNB fails to hold bullish momentum and a momentum candle closes below 502, the current bullish probability becomes invalid. In that case, we could see further downside pressure.
That is why Paradisers, we are playing it safe right now. If you want to be consistently profitable, you need to be extremely patient and always wait only for the best, highest probability trading opportunities only on confirmations.
MyCryptoParadise
iFeel the success🌴
BNB Bullish Retest, Head and Shoulders BNB is showing signs of a potential inverse head and shoulders pattern, a bullish reversal structure that often develops after a period of consolidation or weakness. Price action has successfully reclaimed the blue neckline resistance and is now retesting that same level as support, an important technical development that suggests buyers are attempting to confirm a change in market structure.
As long as BNB continues to hold above this neckline support, the probability remains in favor of another move higher. Successful defense of this region would indicate that previous resistance has flipped into support, increasing confidence that buyers remain in control. This type of retest is commonly seen before continuation moves as the market builds momentum for the next leg higher.
The first upside objective sits around the 616 resistance level, where price could encounter short-term selling pressure. A decisive breakout above that region would strengthen the bullish outlook and open the door for a larger rally toward the 718 target. Reclaiming these higher levels would also reinforce the broader trend and confirm the inverse head and shoulders breakout.
For now, the technical outlook remains constructive while price trades above the neckline support. Losing this level would weaken the bullish scenario and increase the probability of a deeper pullback before another attempt higher. Until then, BNB continues to favor upside continuation in the immediate short term.
BNBUSDT 15M | Bearish Breakout Setup with Crypto SignalsBNBUSDT has broken below its consolidation range on the 15-minute chart, signaling a potential bearish continuation.
The Crypto Signals indicator generated a SELL signal with a predefined Entry, Stop Loss, and three Take Profit levels to help manage risk.
If bearish momentum continues, the downside targets remain in focus. Always wait for confirmation and apply proper risk management before entering a trade.
📊 Indicator used: Crypto Signals — available for free and open-source on my Trading View profile.
NeuPortal | BNB 24h - core 588-600, and only 26 real windowsxxEvery number below is a quantile of what BNB has already done over the following 24 one-hour bars. Read from history, not from a formula, which is why the panel prints empirical, not sqrt-t along its bottom edge.
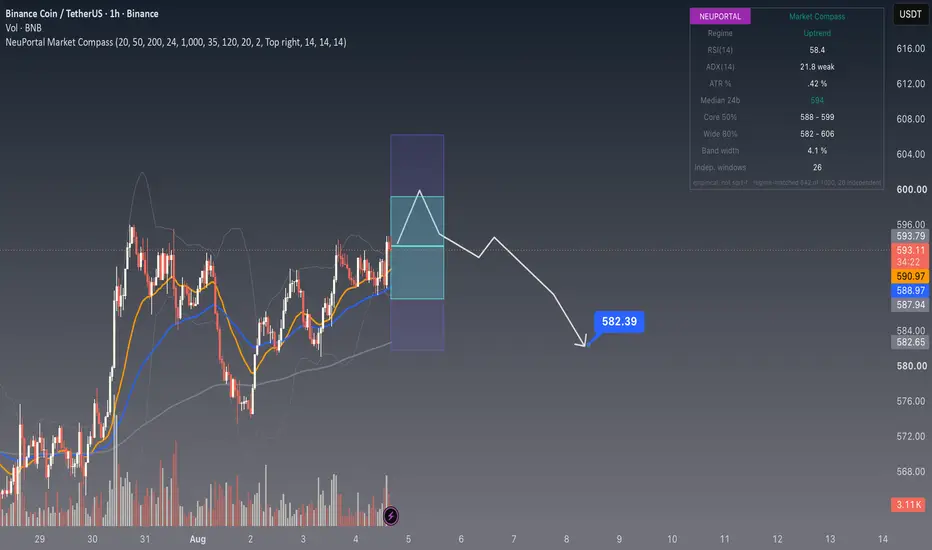
Median 594
Core 50% 588 - 600
Wide 80% 582 - 607
Band width 4.1% of spot
THIS ONE DID NOT FALL BACK
We ask the sample a narrow question: show me only the windows that opened in conditions resembling the ones on screen right now. Some instruments cannot answer it. Two we published earlier today had to revert to the full unconditional sample because too few windows matched.
Here 643 of 1,000 matched. The regime filter did the job it exists for, and the band above describes an uptrend with weak momentum rather than an average of every market state BNB has ever been in.
AND HERE IS WHAT THAT COST
Independent windows: 26.
Those two figures belong in the same sentence. Overlapping windows share 23 of their 24 bars, so 643 matched windows are nothing like 643 observations. Strip the overlap and 26 is what remains, and quantile error bars scale with 26 rather than with 643.
So the choice is not between a good band and a bad one. An unconditional read keeps roughly 125 independent windows and pays by importing every regime, calm and violent alike, into a single number. A conditioned read keeps today's regime and hands you 26 observations to estimate a tail from. We print both figures because picking one and hiding the other is how a band starts looking more authoritative than it is.
THE PANEL CONTRADICTS ITSELF, AND THAT IS WORTH SAYING
Regime reads Uptrend. ADX prints 21.8, which is weak by any conventional threshold. Those two do not agree, and I would rather point at it than let a reader find it.
RSI at 59.8 is mildly constructive and nowhere near extended. ATR is 0.42% per bar. A trend classification with weak trend strength behind it is a trend that has not proven anything yet, and when the labels disagree the width is the part of this chart worth reading.
NO DIRECTIONAL LEAN
Median 594 against spot 593.59 - seven hundredths of a per cent above, which is to say nothing. The regime label leans up, the momentum reading does not confirm it, and the distribution declines to take a side. Published that way rather than rounded into a story.
This describes a distance over a horizon, with its sample size printed next to it. No entry, no target, no stop.
Educational content - not financial advice.
BNB: Trendline Break Could Change the StructureCRYPTOCAP:BNB remains below long term Descending trend line and until further confirmation the structure is to remain cautious.
Holding above trend line could lead to potential stronger movement. Meanwhile $500-$550 Area remains the support zone.
DYOR, NFA
Binance Coin (BNB)Binance Coin (BNB)
Binance Coin is up 4% this week after buyers managed to take it above the support at $580. As long as this key level holds, bulls have the upper hand, and they may be aiming for $690 next, which is the key resistance.
At the time of this post, the ongoing uptrend is still early, and sellers could at any time reverse it. Therefore, best to wait for a confirmation of this breakout to avoid a bull trap scenario.
Looking ahead, BNB could continue to consolidate between $580 and $690. If so, the drop under $580 could be interpreted as a short-term deviation in the price action.
BNB/USDT – Bearish Rejection Setup from Trendline 📉 BNB/USDT – Bearish Rejection Setup from Trendline 🔥
🧠 Market Overview
BNB is trading below a well-respected descending trendline, showing that sellers remain in control. Price is approaching a key resistance area where a rejection could trigger the next bearish leg.
🔍 Technical Analysis
📉 Bearish Trendline: Price continues to respect the descending resistance, keeping the bearish structure intact.
⚠️ Resistance Zone: The 570–584 USDT area is a strong supply zone. A rejection here would favor sellers.
🔄 Possible Fake Breakout: A brief push above resistance is possible to grab liquidity before the market reverses lower.
📦 Order Block Target: The major demand/order block around 542–538 USDT is the primary downside objective.
🎯 Trade Plan
✅ Entry: Wait for bearish confirmation in the 570–575 USDT zone.
🛑 Stop Loss: Above 584 USDT.
🎯 TP1: 560 USDT
🎯 TP2: 550 USDT
🎯 TP3: 538 USDT (Order Block Support)
⚡ Conclusion
As long as BNB remains below the descending trendline and resistance zone, the overall bias stays bearish. A confirmed rejection could lead to a strong move toward the highlighted order block. Always wait for price confirmation and manage risk properly. 📊
BNB WEEKLY CHART USING SHAVYFXHUB STRATEGYBNBUSDT Weekly Chart Analysis – Shavyfxhub Strategy
Market Structure Overview
Major Supply Roof
Strong horizontal resistance zone around 790.
Multiple RS (Resistance Strength) points confirm this as a key supply area that has repeatedly capped price.
Key Demand Floors
405 – 358.75 – 345.67 → Important mid-range demand zone
203.66 – 196.17 → Stronger structural demand
24.77 → Deep long-term demand floor
Ascending trendline demand floor (green rising support) that has guided the entire multi-year uptrend since 2018–2020
Structure Notes (Shavyfxhub Style)
Clear long-term ascending structure with higher highs and higher lows.
Several RT/RS and BAR (Break and Retest) points marked, showing successful role transitions from resistance to support.
Price is currently trading in the upper portion of the long-term range, consolidating just below the major Supply Roof at ~790.
Projected arrows on the chart show two main scenarios:
Continuation higher toward the Supply Roof and beyond
Corrective pullback toward the mid-range demand zones (405–345 area) or the rising trendline
Summary:
BNB remains in a strong long-term bullish structure on the weekly timeframe. The major Supply Roof at ~790 is the key ceiling. As long as price respects the ascending trendline demand floor and the mid-range demand zones (especially 345–405), the structure favors continuation higher. A decisive break and close above the 790 Supply Roof would open the door for a new expansion leg.
BNB/USDT: Buyers Defend SupportBNB/USDT is currently testing a key support zone after the recent bearish momentum pushed price lower. This area has previously attracted buying interest, making it an important level for buyers to defend.
If buyers can hold this support and trigger a strong rebound, the recovery could extend toward the 570.0 target zone. A clear bullish reaction from this area would strengthen the probability of a short-term upside move.
The reaction here will determine whether BNB can build enough momentum for the next push toward 570.0.
BNBUSDT 1H — Head & Shoulders | Short-Term Pullback SetupBNBUSDT is showing a potential Head & Shoulders formation on the 1H timeframe, suggesting a short-term corrective move.
The important point is that this setup is short-term bearish only. Our medium-term view remains bullish, so any short position here should be treated as a smaller corrective trade rather than a bet on a full trend reversal.
The structure is clear:
Left Shoulder around the 606–607 area
Head near 612
Right Shoulder developing around the same 606–607 resistance zone
Price has already rejected the Right Shoulder area and moved lower
🟢 Short Scenario
The preferred setup is not to chase the current move lower.
I would rather see a pullback toward the 604 area, followed by bearish Price Action / rejection.
If the pullback provides confirmation, a small short position can be considered with:
BNBUSDT BinanceCoin (1h) (Futures)
⭕️ SL @ 609.0
🔵 TP1 @ 591.0
🔵 TP2 @ 584.0
🔵 TP3 @ 571.0
The first target is important because it can provide an opportunity to reduce risk and protect the position.
🔴 Invalidation
If price breaks and holds above the Right Shoulder / 606–607 area, the Head & Shoulders setup loses its validity.
The 609.0 stop-loss is the defined invalidation level for this short setup.
Important Context
This is a countertrend short-term setup while the broader medium-term bias remains bullish.
That distinction matters.
We are looking for a potential correction, not trying to predict a major bearish reversal.
Therefore, patience is important: Pullback → Confirmation → Entry → Risk Management.
Do not chase the downside if the market does not provide the expected retest.
This view is based on Price Action and Market Structure only. Always use proper risk management and wait for confirmation before entering a trade.
BNB Won't Give a Deep Pullback | VWAP Zone for ContinuationLooking at GETTEX:BNB and I see a pretty interesting zone to enter a probable trend continuation up.
The coin is moving up fairly confidently right now. Clean higher low and higher high formations and a reaction off the VWAP and volume zones. For myself I see 593.66 - 585.70 as the zone of interest.
Near 593.46 we've got the week before last's POC, and lower in that same range is where VWAP will line up in the future. There's also a bullish order block at 588.84 - 585.56. Price could easily do a squeeze into the OB rather than reversing right away near POC and VWAP.
Invalidation of the long scenario is a hold below 584.02.
BNB: Recovery Builds, but Resistance Still LoomsRecovery Continues to Improve
BNB has continued to recover from its July lows, reclaiming the $580 support zone and extending its recent sequence of higher lows. The latest advance suggests buyers are gradually regaining confidence after the sharp June decline.
Support Holding for Now
The former $580 resistance area is now acting as support, with price so far respecting this level on the latest pullback. Holding above this zone would keep the short-term recovery intact.
Next Resistance Comes Into View
The next important hurdle sits around $630, where previous rallies have repeatedly stalled. A decisive break and close above this level would strengthen the bullish case and mark another important improvement in market structure.
Moving Averages Turning Higher
The 100/50-Day EMAs remain bearishly crossed, but both averages have started to climb as price trades back above them. While encouraging, the broader trend has yet to fully shift in favour of the bulls.
In Summary
BNB continues to build on its recovery, with the successful reclaim of $580 providing an encouraging technical development. However, the more significant test still lies ahead around $630, where previous rallies have repeatedly failed. A break above that resistance would further strengthen the recovery, while a loss of the $580 support zone would be the first indication that sellers are beginning to regain control.
BNBUSDT Technical and Fundamentals analysisFundamental bias
Fundamental bias for BNBUSDT: slightly bullish (BNB stronger than USDT) with medium confidence.
Why (3–5 reasons):
Crypto regime: Bitcoin and broader crypto appear in an intact long‑term uptrend with temporary risk‑off volatility, not a full reversal.
BNB price expectations: Analyst ranges for August 2026 centre modestly above current price (average ~615–616, peaks near 647), suggesting mild upside expectation.
Regulatory trajectory: Key jurisdictions are moving toward structured regulation of crypto and stablecoins, integrating them into financial infrastructure rather than banning them outright.
Macro: US rates are high but stable, which supports USDT as funding and carry but doesn’t fully suppress risk assets when inflation is falling and markets anticipate future easing.
Given this, a beginner trader can frame BNBUSDT as: buy BNB (long the pair) on pullbacks in a supportive macro/crypto environment, but be ready to cut if risk‑off or negative regulation hits.
Bias risks and invalidation
What could invalidate or flip this mildly bullish bias:
Major negative Binance or BNB‑specific event: Lawsuit, enforcement, large outflows, or ecosystem breakdown.
Strong, sustained risk‑off episode in crypto: Bitcoin breaking key supports, heavy liquidations, or macro shocks that push traders into USD and stablecoins.
Hawkish surprise from the Fed: Renewed tightening or much slower disinflation, making USD yields more attractive and hurting risk assets.
Adverse regulation: New rules that specifically disadvantage exchange tokens or restrict crypto trading in major markets beyond current expectations.
If any of these happen, the bias could quickly turn neutral or bearish, especially in the short term.
What to watch next
For practical trading:
Next Fed events: FOMC meetings and minutes — watch for changes in language around inflation and growth.
US inflation prints (CPI, PCE): Strong downside surprises favour risk assets like BNB; upside surprises favour USDT/USD.
Bitcoin and Ethereum price action: If majors grind higher with healthy volume, it supports BNB; if they break down, be cautious on BNBUSDT.
Binance and BNB ecosystem news: New launches, chain upgrades, or major regulatory headlines can move BNB independently of the rest of the market.
Stablecoin regulation: Progress on US stablecoin frameworks (such as the GENIUS Act) and UK/EU rules will affect confidence in USDT and the broader market plumbing.
Stronger currency now: BNB
Weaker currency now: USDT
Pair bias: bullish
Confidence: medium
Main driver: Maturing crypto uptrend and constructive Binance/BNB narrative outweigh USD yield and stablecoin safety.
Key risk to this view: Regulatory or macro shocks that trigger risk‑off flows back into USDT/USD and away from BNB and other altcoins.
BNBG CHAIN GROWTHGETTEX:BNB Chain announced the "Build the Era" hackathon in Dubai, running from August 5 to September 9, 2026. The goal is to find and fund the definitive marketplace for AI agents on BNB Smart Chain (BSC), where over 60% of all ERC-8004 registered agents reside. The winning team could see their product adopted as the official BNB Agent Studio marketplace. This is bullish for BNB because it directly incentivizes developer activity and aims to solve a critical discoverability problem in its fast-growing AI agent ecosystem. A successful marketplace could drive more transactions and utility on BSC. BNB Chain reported leading weekly DEX volume at $19B and detailed its H2 2026 technical roadmap. Key achievements include reducing block time to 450ms and targeting 10,000+ TPS. The roadmap also reveals plans for a next-generation Layer 1 blockchain aiming for over 100,000 TPS by early 2027. This is neutral-to-bullish for BNB, demonstrating relentless execution on scalability. While these are long-term infrastructure plays, they solidify BNB Chain's competitive edge in hosting high-volume applications like RWAs and AI. The setup suggests traders are watching for a decisive breakout, but the direction hinges on broader market sentiment and Bitcoin's movement. BNB's latest developments reveal a dual focus: aggressively scaling its infrastructure while actively cultivating its next major use case in AI. The key question now is whether developer momentum from initiatives like the hackathon can translate into sustained on-chain activity to fuel its next leg up.
BNB: Bulls Face Their First TestPrimary trend still points lower
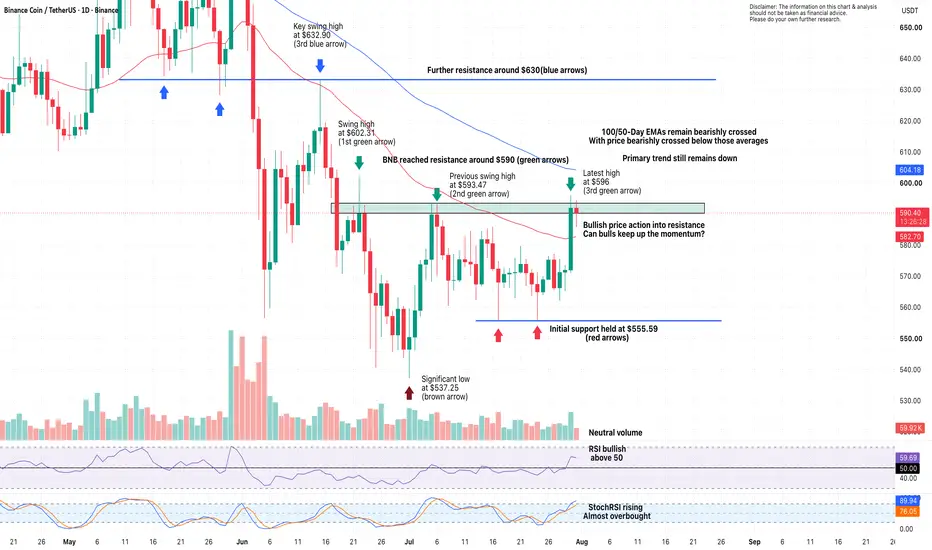
Despite the recent rally, BNB remains in a primary downtrend. The chart continues to respect lower highs, with buyers now facing the first major resistance zone around $590.
Moving averages remain bearish
The 100/50-day EMAs remain bearishly crossed, with price still trading below both averages. Until those EMAs are reclaimed, the broader technical picture continues to favour the bears.
Resistance overhead
The $590 area has repeatedly acted as resistance since June, making this an important test for the recovery. A convincing break and close above would shift the focus towards the next resistance around $630.
Support holding for now
Initial support around $555.59 has successfully attracted buyers on multiple occasions. Holding above this level keeps the current recovery alive, while a break below would increase the risk of a retest of the significant $537.25 low.
Momentum improving
RSI has moved back above the 50 level, suggesting momentum is beginning to favour the bulls, while StochRSI is rising towards overbought territory. Volume remains relatively neutral, meaning a breakout may require stronger buying participation.
In Summary
BNB has staged an encouraging recovery, but the first real test has now arrived at the $590 resistance zone. While momentum has improved and support at $555.59 continues to hold, the 100/50-day EMAs remain bearishly crossed and the broader trend is still down. Bulls need a decisive break above $590 to strengthen the recovery, with $630 becoming the next major upside objective.
Short idea on BNBI've plotted resistance levels calculated using my own method on the chart. The color and number of each level indicate its strength. Blue is a weak level, orange is an average level, and red is a strong level. Strength (numbers) also influences the level. Strength from 20 to 50 is an average level, from 50 to 100 is strong, and from 100 and above is very strong.
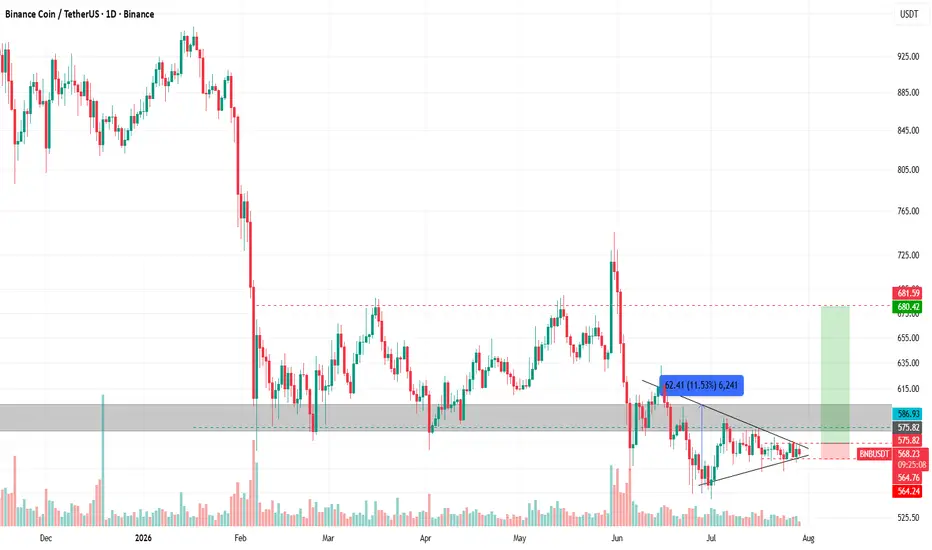
I expect the price to break out of the Falling Wedge and stop around 612$-626$, and from there, a correction to 590$ will begin. I plan to enter with three equal limit orders.
BNB: Bears Still Control the Bigger PictureFormer support becomes resistance
BNB continues to struggle beneath the $580 area, with this former support zone now acting as key resistance. Each rally into this region has attracted renewed selling pressure.
Moving averages remain bearish
The 100/50-day EMAs remain bearishly crossed, with price continuing to trade below both moving averages. Until this changes, the primary trend continues to favour the bears.
Momentum remains neutral
RSI is chopping around the 50 level, reflecting the current lack of direction. Meanwhile, StochRSI is climbing from mid-range, suggesting momentum is improving but has yet to become decisive.
Support remains important
The first level of support sits around $555.59, while a break below this level would increase the risk of another move towards the significant low at $537.25.
Bulls need to reclaim $580
A convincing break and close above $580 would be the first encouraging sign that momentum is shifting. Until then, rallies are likely to continue running into overhead resistance.
In Summary
BNB remains under pressure as price continues to trade below bearishly crossed 100/50-day EMAs and struggles beneath the important $580 resistance zone. Although momentum is broadly neutral, bulls have yet to regain control of the chart. Unless $580 is reclaimed, the risk remains skewed towards another test of $555.59 support, with a break below exposing the recent low around $537.25.