USDTHB Tracks DXY ReboundUSDTHB is expected to remain volatile with a slight bullish bias after the Fed kept interest rates unchanged as widely expected while maintaining a data-dependent stance on inflation and economic conditions. Although the U.S. Q2 GDP and some PCE components came in below expectations, inflationary pressure remains, as reflected by the stronger-than-expected GDP Price Index. Meanwhile, the U.S. Dollar Index (DXY) rebounded to 100.191, providing short-term support for the U.S. dollar.
Today, markets will closely monitor the Employment Cost Index (ECI), Chicago PMI, as well as the University of Michigan Consumer Sentiment Index and Inflation Expectations, which could provide further clues on inflation trends and the Fed's future monetary policy.
If the ECI comes in above expectations, accompanied by stronger consumer sentiment and higher inflation expectations, the U.S. dollar could extend its rebound, pushing USDTHB higher. However, if today's economic data disappoints, the dollar may weaken again, increasing the likelihood of a short-term decline in USDTHB.
Technical Analysis
On the 1-hour timeframe, USDTHB remains in a downtrend, with price trading below the Downtrend Line after failing to sustain its previous recovery. However, the pair has rebounded from a key support area following a period of accumulation. If price can reclaim both the Fair Value Gap (FVG) and break above the Downtrend Line, it could trigger a bullish recovery toward 33.50–33.54, the target of the Bullish Scenario.
Risk Scenario
Although selling pressure has started to ease, the broader trend remains bearish, with price still trading below the primary trendline. Failure to break above the FVG and Downtrend Line may attract renewed selling pressure. A break below 33.35 would confirm the bearish outlook and expose the next downside targets at 33.34–33.32, corresponding to the Bearish Scenario.
Key Levels
Target: 33.50–33.54
Support: 33.36
Cut Loss: 33.35
U.S. Dollar / Thai Baht
No trades
No trades
In-depth trading ideas
USD Awaits Key U.S. DataMarket Analysis: USDTHB is expected to fluctuate within a range after the Fed held interest rates steady at 3.75% as expected while signaling a hawkish stance to closely monitor economic data and inflation. Key US economic data releases tonight—including Q2 GDP, Core PCE Price Index, and Initial Jobless Claims—will be crucial: stronger-than-expected data could strengthen the USD and drive USDTHB higher, whereas weaker data may pressure the USD and cause short-term downside.
The USDTHB is shifting to a Sideways-to-Bullish bias after breaking above the downtrend line and holding above the previous resistance at 33.55. This breakout suggests that buyers are regaining short-term control, with the potential for the market structure to transition from a Lower High to a Higher High, provided the pair remains above the breakout level.
The RSI is currently at 58.67, indicating strengthening bullish momentum while remaining below the overbought threshold. Meanwhile, the MACD has crossed above the Signal line, and the Histogram continues to expand in positive territory, reinforcing the bullish outlook.
If USDTHB can maintain support above 33.55, the pair is likely to extend its gains toward 33.60 and 33.65, supporting the bullish scenario.
Risk
Although the pair has broken above the downtrend line, failure to hold above 33.55 could result in a false breakout, triggering renewed selling pressure. In that case, USDTHB may retreat to test support at 33.52 and 33.40. A break below these support levels would invalidate the short-term bullish outlook and shift sentiment back to bearish.
Bullish Targets
TP1: 33.60
TP2: 33.65
TP3: 33.70
Support Levels
33.52
33.40
Cut Loss
Below 33.52
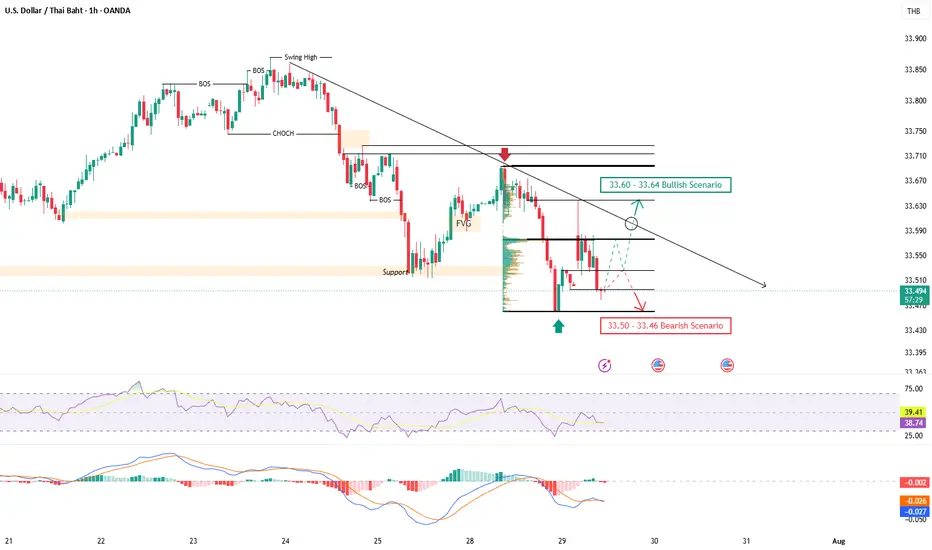
USDTHB Awaits FOMC DecisionMarket Analysis: The USDTHB pair is expected to trade bound in a range with light volume today as the Bank of Thailand and the Thai stock market are closed for Asarnha Bucha Day. Investors are sitting on the sidelines ahead of tonight’s FOMC meeting results and U.S. crude oil inventory reports. Rising U.S. Treasury yields and oil prices continue to provide underlying support for the U.S. Dollar, despite a slight dip in the DXY index.
Technical Outlook: The overall trend remains in a Down Trend, trading below the Down Trend Line. However, a rebound has emerged from support zones with consolidation around the High Volume Profile area. To confirm a short-term reversal, price must break and hold above the key resistance at 33.60, which would open the door toward the Bullish Scenario target. Conversely, failure to clear 33.60 risks a pullback toward 33.50 and 33.46.
Support Level : 33.50
Target : 33.60 – 33.64
Stop Loss / Cut Loss : 33.48
USDTHB Eyes US Confidence DataMarket Analysis: USDTHB is expected to trade range-bound today with lower liquidity due to the closure of the Bank of Thailand and Thai stock market for the King’s Birthday. Investors are closely monitoring US economic data, including CB Consumer Confidence and the Goods Trade Balance, ahead of this week’s FOMC meeting.
Better-than-expected consumer confidence and a narrower trade deficit could strengthen the USD and boost USDTHB in the short term, while weaker data may weigh on the greenback.
Technical Outlook:
The chart is attempting to extend its recovery after forming a Higher Low above the recent support zone. However, price has reached a key resistance area around 33.68–33.70, where selling pressure has emerged. As long as the price holds above 33.64, the short-term bullish structure remains intact with room to retest 33.68–33.70. A decisive break above this zone could open the way toward 33.71–33.72. Conversely, a break below 33.64 would weaken the recovery and increase the risk of a pullback toward 33.60–33.57.
Support Level: 33.64 – 33.62
Target: 33.68 – 33.70
Stop Loss: 33.61
USDTHB Eyes Durable Goods Data Market Analysis: Oil prices dropped by over 5% following a ceasefire agreement between the US and Iran, reflecting easing geopolitical concerns. Meanwhile, gold prices remained elevated at 4,108 due to safe-haven demand. This sent the US Dollar Index (DXY) lower to 101.181,
putting pressure on USDTHB to trade in a range with a bias toward short-term weakness. Investors are closely monitoring US Durable Goods Orders and the Atlanta Fed GDPNow estimate today; better-than-expected figures could support the US Dollar and drive a short-term rebound in USDTHB.
Technical Outlook: The overall USDTHB structure remains in a downtrend after a recent Break of Structure (BOS) and continues to trade below the downtrend line. The price is currently testing a key support zone at 33.55–33.51, where buying interest may emerge. If the price rebounds and breaks above the downtrend line, it could rally to test the 33.64–33.66 resistance zone under a bullish scenario.
Support Level : 33.55 – 33.51
Target : 33.64 – 33.66
Stop Loss : 33.54
USD Awaits PMI DataMarket Analysis: USDTHB is expected to fluctuate within a range. The DXY index has declined to 101.37, easing upside momentum for the U.S. Dollar in the short term. Market attention today is focused on U.S. S&P Global Manufacturing and Services PMI, as well as New Home Sales data. If these figures beat expectations, they could bolster the U.S. Dollar and drive a short-term appreciation in USDTHB.
Technical Outlook: The overall chart indicates a consolidation phase after failing to break above the Swing High resistance, remaining under a downtrend line. However, the primary structure remains intact; a breakout and hold above this trendline could trigger a test of the 33.83–33.84 resistance zone under a Bullish Scenario. RSI stands at around 49.64, signaling neutral-to-weak momentum, while MACD sits below its signal line with a negative histogram. This suggests selling pressure persists in the short term, with a potential dip expected before any recovery. Note that a slightly positive SET Index opening driven by high oil prices may support the Baht and limit USDTHB upside.
Support Level : 33.80 – 33.78
Target : 33.83 – 33.84
Stop Loss : 33.77
USDTHB Eyes Jobless ClaimsMarket Analysis: The USDTHB is expected to trade range-bound to slightly appreciating. The DXY sits at 101.060 while rising oil prices driven by Middle East tensions sustain safe-haven demand for the USD. Market attention today turns to the U.S. Initial Jobless Claims for interest rate and economic cues, alongside the ECB meeting decisions. Lower-than-expected jobless claims could further boost the Dollar, driving short-term gains for USDTHB.
Technical Outlook: The overall technical structure remains Bullish, despite a temporary pullback to test the Up Trend line and short-term support after failing to break 33.80. The primary structure remains intact; if price holds above the trendline and reclaims 33.80, it will likely test the next resistance zone at 33.82 – 33.84. However, weakening momentum on MACD and RSI presents downside risks—a breakdown below 33.74 opens targets at the Order Block (OB) and Fair Value Gap (FVG), while losing 33.72 signals a deeper correction. Additionally, a slightly higher opening in the SET Index driven by energy stocks could offer temporary support to the Baht.
Support Level : 33.75 – 33.74
Target : 33.82 – 33.84
Stop Loss : 33.73
USDTHB Eyes EIA Oil DataMarket Analysis: USDTHB is expected to trade with a steady-to-bullish bias in the short term. The DXY index rose to 101.21, accompanied by higher crude oil prices due to US-Iran tensions and Houthi blockade threats against Saudi shipping routes. These supply concerns sparked safe-haven inflows into the US Dollar. Today, market focus shifts to the EIA crude oil inventories report and MBA mortgage applications to evaluate energy demand and inflation pressures. A larger-than-expected crude oil drawdown could elevate energy prices and inflation expectations, dampening Fed rate cut prospects and supporting the greenback. Meanwhile, a slightly positive opening in the Thai stock market may provide mild support for the Baht, though its impact remains limited by broader USD strength.
Technical Outlook : Bullish Bias. The chart structure maintains a strong bullish outlook, supported by a sequence of Higher Lows (HL) and a Break of Structure (BOS) while trading above both EMA lines. The RSI stands at 69, reflecting dominant buying momentum as it approaches Overbought territory, while the MACD remains above the signal line with a positive histogram. A firm breakout and consolidation above 33.79 will confirm the bullish continuation toward the 33.81–33.84 target zone. Conversely, the elevated RSI indicates a risk of short-term profit-taking. Failure to clear 33.79–33.81 could prompt a pullback toward the Fair Value Gap (FVG) at 33.70–33.68, where a breach below 33.70 would signal fading buying power toward the lower Order Block (OB).
Support : 33.73 – 33.70
Resistance : 33.79
Target : 33.81 – 33.84
Cut Loss : 33.69
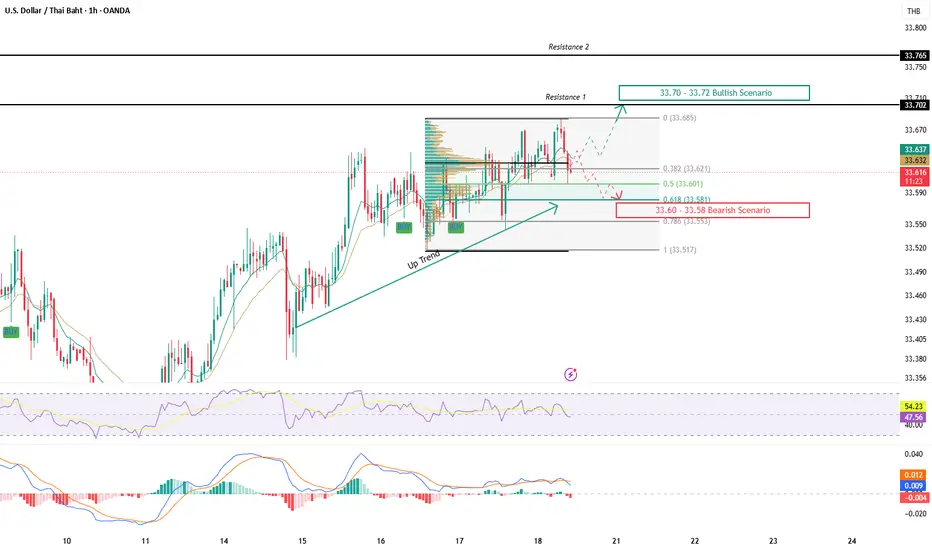
USDTHB Tracks DXY MovesMarket Analysis:USDTHB shows a steady-to-softening bias in the short term, weighed down by a lower opening in the DXY index. Today, market attention centers on the release of the June US Leading Economic Index (LEI) to gauge economic momentum. While stronger-than-expected figures could offer dollar support, the overall direction remains sensitive to US Treasury yield movements, DXY fluctuations, and global risk sentiment given the thin US economic calendar.
Technical Outlook : Bullish Trend (Short-term Consolidation). The primary technical structure maintains a bullish outlook after preserving its Higher Low sequence. Despite entering a narrow consolidation range, the broader structure favors upside continuity. The price currently holds above Fibonacci 38.2% (33.62) and near 50.0% (33.60). A decisive breakout above the 33.64–33.65 resistance zone and the previous Swing High will confirm a fresh buying wave toward 33.70–33.72. Conversely, failure to clear 33.66 could trigger profit-taking toward 33.60–33.58, with a break below 33.58 weakening buying momentum toward 33.55. A positive open in Thai equities also poses a potential downside risk.
Support : 33.60 – 33.58
Resistance : 33.64 – 33.65
Target : 33.70 – 33.72
Cut Loss : 33.57
DXY Weighs on USDTHBMarket Outlook
The US Dollar Index (DXY) opened lower, putting pressure on the US Dollar and leading USDTHB to trade sideways with a bearish bias in the short term. Market participants are closely watching the release of the US Leading Economic Index (LEI) for June, which will provide further insight into the outlook for the US economy. A stronger-than-expected reading could support the US Dollar. With a relatively light US economic calendar today, USD price action is expected to be driven primarily by US Treasury yields, DXY movements, and overall global market sentiment.
Technical Analysis
The overall trend for USDTHB remains bullish, as the pair continues to maintain its Higher Low market structure. Although price is currently consolidating within a narrow range, the broader uptrend remains intact. The pair is trading above the 38.2% Fibonacci retracement (33.621) and near the 50.0% Fibonacci level (33.601). If price can reclaim the 33.64–33.65 resistance zone and break above the recent Swing High, it would confirm renewed buying momentum and increase the probability of a move toward the 33.70–33.72 resistance area under the bullish scenario.
Risk Factors
Despite the bullish outlook, 33.66 remains a key short-term resistance level. Failure to break above this area could trigger profit-taking, leading to a pullback toward the 33.60–33.58 support zone. A decisive break below 33.58 would weaken bullish momentum and increase the likelihood of a deeper correction toward 33.55. In addition, a positive opening in the Thai stock market this morning could support the Thai Baht and put downward pressure on USDTHB.
Target Price:
33.70 – 33.72
Support:
33.60 – 33.58
Cut Loss:
33.57
USDTHB Awaits Key U.S. DataMarket Analysis: USDTHB maintains a steady-to-bullish bias in the short term. Market participants are shifting their focus to today’s heavy slate of US macroeconomic indicators, including Housing Starts, Building Permits, Industrial Production, and the Michigan Consumer Sentiment Index. These prints will serve as crucial gauges for both US economic resilience and the Fed’s monetary policy path. Solid, higher-than-expected data will reinforce the “higher-for-longer” interest rate narrative, supporting the greenback. Conversely, disappointing figures could exert near-term downward pressure. Concurrently, a negative opening in the Thai stock market this morning acts as a tactical local catalyst favoring the dollar against the Baht.
Technical Outlook: Sideway Up to Bullish. The short-term price structure preserves a positive trajectory, trading comfortably within a Sideway Up framework while testing immediate horizontal resistance at 33.64–33.65. The sequential generation of Higher Lows (HL) confirms ongoing accumulation. The RSI hovers around 61, safely positioned above the 50 neutral threshold to reflect prevailing bullish control. Concurrently, the MACD is securely sustained above the signal line with its histogram expanding in positive territory, validating a clean influx of short-term buying momentum. A decisive breakout above 33.65 will unlock a fresh buying wave toward the 33.66–33.68 target range. Conversely, failure to clear 33.65 may prompt profit-taking pullbacks toward the 33.59–33.58 support cluster. A structural breach below 33.58 would invalidate the Higher Low sequence and open the door for a deeper correction toward 33.54–33.52.
Support : 33.59 – 33.58
Resistance : 33.64 – 33.65
Target : 33.66 – 33.68
Cut Loss : 33.57
USDTHB Eyes Key US DataUSDTHB maintains a steady-to-bullish bias in the short term. Even though the June US PPI cooled to 5.5% YoY (below the 6.2% consensus), the US Dollar staged a resilient recovery fueled by intensifying US-Iran geopolitical frictions. Rising defense concerns surrounding the Strait of Hormuz—a vital global oil chokepoint—sparked safe-haven flows into the greenback. Tonight, market focus shifts to a heavy US data slate including Retail Sales, the Philadelphia Fed Manufacturing Index, and Initial Jobless Claims. Stronger-than-expected metrics will likely push the dollar higher by dampening Fed rate cut expectations, whereas a negative opening in the Thai stock market provides direct localized support for the pair.
Technical Outlook: Sideway Up. The short-term price structure preserves a positive trajectory, trading comfortably above the short-term EMA line and its established ascending trendline. The RSI hovers around 53, maintaining a foothold in bullish territory, while the MACD signals an influx of fresh buying interest as its histogram edges back into the positive zone. A decisive consolidation above the 33.60–33.62 resistance cluster will confirm the bullish scenario, paving the way for a continuation toward the 33.64–33.67 targets. However, if the price fails to breach 33.62, short-term profit-taking may prompt a mild retracement to the 33.58–33.56 support zone. A structural break below 33.56 would flag fading bullish conviction, risking a deeper slide toward 33.53.
Support : 33.58 – 33.56
Resistance : 33.60 – 33.62
Target : 33.64 – 33.67
Cut Loss : 33.55
USDTHB Awaits PPI DataUSDTHB is expected to maintain a steady-to-bullish bias in the short term. Even though the June US headline CPI cooled to 3.5% (below the market consensus of 3.8%), signaling a slowdown in consumer inflationary pressures, market attention shifts today to the US PPI and Core PPI data to gauge price trends in the manufacturing sector
. Concurrently, geopolitical frictions between the US and Iran—coupled with safety concerns surrounding the Strait of Hormuz—have driven crude oil prices higher, posing a long-term upside risk to inflation. A higher-than-expected PPI print could reinforce the narrative that the Fed will delay interest rate cuts, lending short-term support to the greenback. Meanwhile, a positive opening in the Thai stock market this morning could provide near-term dynamic support for the dollar against the Baht.
Technical Outlook: Sideway to Bullish. The short-term price structure exhibits a Sideway to Bullish characteristic after recovering from the 33.37 support and returning to the Fibonacci 0.618 level (33.48). However, the price remains capped below the critical 33.50–33.55 resistance cluster, requiring a fresh influx of buying volume to confirm a structural breakout. The RSI has eased to 49 after approaching the Overbought territory, showing a temporary deceleration in buying momentum. The MACD stays below the signal line with a negative histogram; though selling pressure is waning, a definitive bullish reversal signal has yet to materialize. A decisive move and consolidation above the 33.50–33.52 zone will open the upside to test the 33.54–33.56 resistance range. On the downside, failure to clear 33.50–33.52 may trigger profit-taking, risking a retracement to the 33.44–33.40 support zone.
Support : 33.44 – 33.40
Resistance : 33.50 – 33.52
Target : 33.54 – 33.56
Cut Loss : 33.39
USDTHB Awaits CPI DataMarket Analysis: USDTHB is expected to maintain a steady-to-bullish bias in the short term as market participants intensely focus on the upcoming release of June US CPI and Core CPI data. Concurrently, traders are monitoring a speech by Fed Vice Chair for Supervision Michael Barr to gauge inflation trajectories and the Fed’s monetary
policy path. Higher-than-expected inflation figures could significantly dampen interest rate cut expectations, reinforcing greenback strength. Additionally, any hawkish rhetoric supporting a “higher-for-longer” interest rate environment acts as an underlying tailwind, while a positive opening in the Thai stock market remains a near-term downside risk factor.
Technical Outlook: Bullish Bias. The short-term structure exhibits bullish characteristics after recovering from the 33.33 level and firmly reclaiming a position above the EMA line. However, the price is currently testing crucial resistance at 33.53 (the previous high), introducing the risk of a Double Top pattern if the breakout fails. The RSI sits at 72, entering the Overbought territory; while this confirms that buyers retain immediate control, it flags a rising risk of short-term consolidation. Meanwhile, the MACD remains above the signal line with a sustained positive histogram, affirming strong upward momentum. A decisive breakout above 33.53 will open the upside toward the 33.60–33.64 targets. Conversely, failure to clear 33.53 could trigger profit-taking, sending the price back to test the 33.45–33.42 support zone, with a breach below 33.36 risking a deeper retracement toward 33.33.
Support : 33.45 – 33.42
Resistance : 33.53
Target : 33.60 – 33.64
Cut Loss : 33.40
DXY Rebound Supports USDTHBThe USDTHB pair is expected to remain stable to slightly stronger as the DXY Index has rebounded to 101.21, supporting the U.S. dollar. Investors have begun adjusting positions ahead of this week's key U.S. inflation data (CPI), making the market relatively cautious at the start of the week.
Today, market participants will monitor FOMC members' speeches, the OPEC meeting, and the U.S. Treasury auctions for 3- and 6-month Treasury bills to assess the outlook for U.S. Treasury yields and the U.S. dollar. However, the primary focus remains on Tuesday night's release of the U.S. CPI and Core CPI, which could be the key catalyst determining the short-term direction of USDTHB.
Technical Analysis
USDTHB remains in a technical rebound phase after bouncing from the Order Block (OB) zone at 33.25–33.26 and successfully reclaiming the EMA. However, the pair is currently facing selling pressure around the 50% Fibonacci retracement level (33.394).
The MACD has crossed above the Signal line, while the Histogram has turned positive, indicating that bullish momentum is gradually returning. Nevertheless, further confirmation is needed through a decisive break above the key resistance level.
If the pair can sustain trading above 33.39, it has the potential to extend its recovery toward the next resistance levels at 33.43 and 33.47.
Risk Factors
Although short-term momentum has improved, USDTHB is still trading within a consolidation range. Failure to break above 33.39 could trigger profit-taking, leading to a pullback toward the 33.33–33.28 support zone.
A break below 33.28 would weaken the current recovery outlook and increase the likelihood of a retest of the previous support around 33.25. In addition, if the Thai stock market opens stronger during the morning session, it could provide additional support for the Thai baht and put further downside pressure on USDTHB.
Target Price: 33.43 – 33.47
Support: 33.33 – 33.28
Cut Loss: 33.27
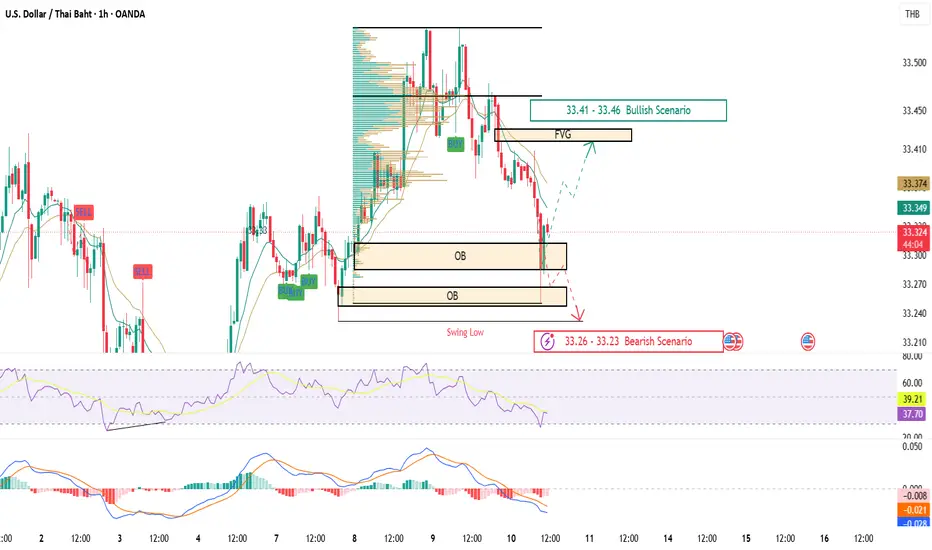
Weaker DXY Weighs on USDTHBMarket Analysis: The DXY index declined to 100.71, exerting downward pressure on USDTHB in the short term. Although the 30-year US Treasury yield came in higher at 5.058% (compared to 5.050% previously)—which typically supports the USD—buying pressure remained insufficient to reverse the price momentum. Meanwhile, the Fed’s balance sheet expanded to $6.736 trillion and commercial bank reserves parked at the Fed rose to $3.137 trillion,
reflecting increased financial liquidity. However, these factors failed to clearly bolster the greenback, leaving USDTHB vulnerable to technical selling with a tendency to trade within a weaker bias.
Technical Outlook: The overall USDTHB chart has shifted to a Bearish Bias after breaching a key support level and falling below the EMA line. The price is also close to closing below the Order Block (OB) zone at 33.29–33.30, indicating that sellers have regained short-term control. The RSI sits around 27 in oversold territory, suggesting a potential short-term technical rebound. Concurrently, the MACD has crossed below the signal line with the histogram expanding in negative territory, showing strong selling momentum despite potential intermittent rebounds. If supported by key news or a technical rebound that firmly pushes the price above 33.29–33.30, there is a chance it could test and close above the Fair Value Gap (FVG) at 33.41 and the key resistance at 33.46.
Risks: Although the oversold RSI may trigger short-term buying pressure, the primary momentum remains bearish. If a rebound fails to clear the 33.29–33.30 level, the price risks another sell-off. Additionally, a positive opening in the Thai stock market this morning could exert further downward pressure on USDTHB.
Support Level : 33.29 – 33.24
Target : 33.41 – 33.46
Stop Loss : 33.22
USD Awaits Trade BalanceMarket Analysis: The DXY index dropped 0.32% last night, extending its decline into this morning and likely causing volatility for USDTHB. Traders are focusing on tonight’s US Trade Balance for May (expected to widen to -78.50B from -55.90B). larger deficit could pressure the USD, while a smaller one may boost it. Investors are also monitoring consumer inflation expectations and the Atlanta Fed’s GDPNow to gauge the Fed’s monetary policy path; stronger data could strengthen the greenback.
Technical Outlook: The overall chart remains in a Sideway Up trend after rebounding from the 33.27 support and holding above the EMA lines. Currently, the price is testing the Fibonacci 0.50–0.618 zone (33.31–33.32), a key decision point for short-term direction. The RSI stands at 57 (above 50), showing that buyers still hold the upper hand, while the MACD remains positive despite slowing momentum. Sustaining above 33.31–33.32 opens the doors to test 33.34–33.35, and potentially 33.37.
Risk Warning: Short-term profit-taking is a key risk. Failing to hold above 33.31 could trigger a pullback toward 33.30–33.27. Breaking below 33.27 will invalidate the Sideway Up structure, risking further short-term corrections. Additionally, a positive opening in the Thai stock market this morning could exert downward pressure on USDTHB.
Support Level : 33.28 – 33.27
Target : 33.35 – 33.37
Stop Loss : 33.25
USDTHB Eyes US Services PMIsMarket Analysis: The DXY index rebounded to 100.95, keeping USDTHB biased towards sideways-to-strengthening. Key focuses today include the S&P Global Services PMI, ISM Services PMI, and Fed Governor Christopher Waller’s speech to gauge US economic strength. Better-than-expected PMI data or hawkish Fed commentary could briefly boost the USD.
Technical Outlook: The short-term structure is shifting to Sideway Up or Bullish after stabilizing above the Volume Profile POC and short-term EMAs, despite facing Fib 0.382–0.5 resistance (33.20–33.22). Price is testing the FVG zone (33.19–33.22); a clean breakout above 33.22 opens the door to 33.25 and potentially the 33.28–33.32 zone. Conversely, failing to clear 33.22 could trigger a pullback to 33.18–33.16, with a drop below 33.18 risking a retest of 33.14–33.12.
Support Level : 33.16 – 33.12
Target : 33.28 – 33.32
Stop Loss : 33.10
Weak NFP Pressures USDTHBMarket Analysis: USDTHB is expected to move sideways with a slight weakening bias today due to thin trading volumes as US markets close for Independence Day. While lower-than-expected US Nonfarm Payrolls (57,000 vs 114,000 expected) signal a cooling labor market and pressure the Greenback, the downside may be limited by the holiday environment.
Technical Outlook: The short-term view shows potential for a rebound as selling pressure fades, evidenced by a contracting MACD Histogram and an RSI nearing the oversold zone at 37.46. If the price can break and hold above the key 33.24 resistance, it will confirm a positive signal to test the next target zone.
Support Level : 33.15 – 33.12
Target : 33.27 – 33.31
Stop Loss : 33.10
USDTHB Awaits NFP ReportMarket Analysis: The DXY index is moving sideways within a range, causing USDTHB to stabilize in line with the US Dollar this morning. However, high volatility is expected tonight as the market closely watches the Nonfarm Payrolls (NFP) report for June at 19:30 UTC+7, which is forecasted to slow down to 114K from 172K. Unemployment is expected to hold at 4.3%,
with Average Hourly Earnings steady at 0.3% MoM. Stronger-than-expected jobs and wage data would bolster the USD and press the Baht to depreciate. Additionally, Initial Jobless Claims (exp. 220K vs 215K prior) will be monitored; lower-than-expected claims would signal labor strength and further support the USD.
Technical Outlook: USDTHB continues to trade sideways within a 33.27–33.42 range after a sharp rally that triggered a Change of Character (ChoCH). Price is currently consolidating around the Fibonacci 0.382–0.5 zone (33.33–33.30), which serves as a key short-term support. The RSI is at 53, indicating neutral-to-positive momentum, while the MACD remains above the zero line, though its histogram has turned slightly negative, showing a slowdown in buying pressure. If the price breaks above 33.39, it has a chance to rebound and retest the 33.42–33.47 resistance zone. Conversely, failing to hold above 33.30 could trigger a sell-off towards 33.27–33.22, with a positive opening in the Thai stock market acting as an additional drag.
Support Level : 33.30–33.27
Target : 33.42–33.47
Stop Loss : 33.25
Strong Yields Support USDTHBMarket Analysis: The 10-year US Bond Yield rebounded to 4.469%, providing support for a stable-to-bullish USDTHB. Today, markets are closely watching the June ADP Employment Change, which is expected to slow slightly to 118K from 122K, reflecting cooling in the US labor market. Additionally, the June ISM Manufacturing PMI is expected to drop to 53.7 from 54.0, while the ISM Prices Paid index is anticipated at 79.0 down from 82.1
Better-than-expected data could bolster the USD and weaken the Baht, whereas lower prints would compress the USD and support Baht strength. Investors are also keeping an eye on evening EIA crude oil inventory reports for short-term inflation cues, all while awaiting the key Nonfarm Payrolls release on Thursday.
Technical Outlook: The overall technical picture for USDTHB exhibits a sideway-up to bullish bias after bouncing from the demand zone and reclaiming the Fibonacci 0.5 level (33.297), indicating returning short-term buying pressure. The RSI has climbed into the overbought territory around 71, signaling strong upward momentum but raising the possibility of short-term profit-taking. Meanwhile, the MACD remains above both the signal line and the zero line, with an expanding histogram confirming the bulls hold the upper hand. If the price manages to sustain above 33.33, it has a good chance to test the immediate resistance target at 33.36–33.40, which would solidify a short-term uptrend.
Risks & Nuances: Despite the bullish momentum, the overbought RSI implies an ongoing risk of sudden profit-taking, particularly near the 33.33 zone where heavy selling volume (Volume Profile) and Fibonacci resistance cluster. Failure to break this ceiling could induce a pullback toward the 33.26–33.24 support area. Dropping below 33.26–33.23 would flip the short-term outlook bearish, opening the door for a retest of previous lows. Additionally, a positive open in the Thai stock market this morning could exert further downward pressure on USDTHB.
Support Level : 33.26–33.24
Target : 33.36–33.40
Stop Loss : 33.22
USDTHB Tracks DXY StrengthMarket Analysis: The DXY index rose to 101.27, reflecting support for the USD, while gold prices weakened. This keeps USDTHB stable to slightly stronger. Tonight at 21:00, the market is monitoring the May JOLTS Job Openings, expected to fall to 7.280M from 7.618M, signaling a cooling US labor market.
Concurrently, the CB Consumer Confidence index is expected to rise to 94.2 from 93.1. If both figures beat expectations, it could provide a short-term boost to the Greenback.
Technical Outlook: The overall USDTHB chart has turned positive after rebounding from the 33.24–33.27 support zone and reclaiming its position above the EMA lines. Price is now approaching a key resistance zone at 33.32–33.33 (Fibonacci 0.382), a critical juncture that will determine if this rebound evolves into a sustained uptrend. The RSI has moved above 55, indicating growing buying momentum, while the MACD has crossed above the Signal line with a positive Histogram, showing buyers are regaining control. However, failure to break the 33.32–33.38 resistance area (Fibonacci, FVG, and old supply zone) could trigger short-term profit-taking. A drop below 33.29 and 33.25 would turn the short-term outlook bearish, with potential pressure from a positive opening in the Thai stock market.
Support: Level 33.27 – 33.23
Target : 33.38 – 33.42
Stop Loss : 33.22
USDTHB Awaits DirectionMarket Analysis: The DXY index is moving within a tight range this morning, awaiting new catalysts to determine its direction. As a result, USDTHB is expected to fluctuate within a range as well. Market participants are closely watching the release of the Dallas Fed Manufacturing Index at 21:30, a key gauge of US manufacturing activity.
Meanwhile, the Baht’s direction remains primarily dependent on US Dollar movements and foreign capital flows.
Technical Outlook: The overall technical picture for USDTHB continues to show a “Sideway Up” pattern after successfully holding above the key support zone of 33.35–33.38. The price remains above short-term moving averages, consolidating near the Volume Profile’s Point of Control (POC), which represents the highest volume node, indicating the market is awaiting a breakout catalyst. Price action is holding above the Fibonacci 0.5 and 0.618 levels, while the RSI sits around 55, suggesting buying momentum is returning though not yet robust. The MACD has crossed above its signal line and the histogram has turned positive, reflecting weakening selling pressure and recovering buying momentum.
Trading Risks: Despite the shifting positive sentiment, prices remain within a consolidation zone, leaving room for short-term fluctuations before a clear trend emerges. The RSI is still at mid-levels, and MACD gains have yet to accelerate significantly. A break below the 33.38–33.35 support zone would increase the risk of a deeper correction toward 33.32–33.27. Additionally, a positive opening in the Thai stock market could apply further downward pressure on USDTHB.
Support Level : 33.38 – 33.35
Target : 33.48 – 33.51
Stop Loss : 33.32