$PEPE Is Testing A Critical Breakout Area CRYPTOCAP:PEPE Is Testing A Critical Breakout Area ๐
I've been watching PEPE on the 3D chart, and one thing stands out. Price has spent months moving inside a descending channel, but the recent structure is starting to look different. The lower area around 0.00000255โ0.00000208 has held as a reaction zone, while momentum is slowly improving from the lows.
The first level Iโm watching is 0.00000312. A clean break and hold above the channel would matter more than a quick wick through it. If buyers can build acceptance there, the next important resistance sits around 0.00000458, with 0.00000709 higher up. โ ๏ธ
I would not chase the first breakout. The better signal is a confirmed break, retest, and strong response from buyers. If PEPE gets rejected again, the lower demand area remains important.
#LEO524 #PEPE #Crypto #PriceAction #SMC
Analysis by LEO524
In-depth trading ideas
๏ปฟPEPE: local squeeze with $0.000003514 destinationPEPE has spent the summer rotating inside a wide range, and price is now coiling right at the mid-point. Equilibrium is pressing into a tightening squeeze โ the kind of compression that resolves with a directional move.
The Macro Picture ๐บ๏ธ
The broader structure is a range, not a trend. Local High / Decision sits overhead at $0.000004139, Macro Support anchors the base at $0.000002224, and price has spent weeks oscillating between them rather than picking a side.
The Setup โ๏ธ
Price is trading at $0.000002914, holding just above Local Low at $0.000002742. The squeeze into Equilibrium is the tell โ buyers and sellers are compressing, and the range floor is doing its job.
The Range Floor ๐ข
$0.000002742โ$0.000002914 is the zone that matters. This is where a range strategy accumulates โ buying the lower half of the band and scaling out into strength, letting the rotation pay while price works.
The Decision Point ๐ด
$0.000004139 is the level that flips the story. Reclaim it and the range breaks upward; lose $0.000002742 and price slides back toward the $0.000002224 macro base.
The Roadmap ๐ฃ๏ธ
Holding the range floor keeps the squeeze bullish and points price toward the $0.000003514 bull target. Invalidation is a daily close below $0.000002742 โ lose the floor and the range thesis flips toward the lower band.
A GRID bot is built for exactly this kind of rotation โ placing orders across the Range Floor and mid-band, banking every swing while price oscillates instead of waiting for one clean breakout.
#PEPE #Crypto #Bitcoin #Altcoins #GRID #TradingView #3Commas
PEPE Could Be Ready to Dropโฆ!Yello Paradisers! Are you prepared for a potential sharp downside move on #PEPE, or are you still calling this โjust a healthy pullbackโ while smart money quietly distributes above you? At first glance, the structure may look harmless. But when we remove emotions and read the chart objectively, the story changes completely. This is not a random retracement. This is a high-risk zone where discipline matters more than opinions.
๐#PEPE has continued to respect its descending resistance trend line and has once again failed to break above it. This rejection strengthens the probability that the broader bearish structure remains intact. During the latest retracement, the price returned to mitigate the nearby order block before losing momentum. This suggests that the recovery may have been corrective rather than the beginning of a sustainable bullish reversal.
๐ The RSI has also formed a clear bearish divergence. While the price tested the recent order block, momentum failed to confirm the move higher. As long as prices remains below this resistance area and bearish momentum continues, the probability favours further downside. The first important support is located around 2470. This level may act as the immediate downside magnet if selling pressure increases. A confirmed breakdown below it would strengthen the bearish scenario and expose lower liquidity zones.
๐From Volume Spread Analysis perspective, the sequence is even more revealing. We saw a buying climax followed by a climactic action bar. This combination typically shows distribution. In simple terms, institutions use these aggressive spikes to offload positions into retail enthusiasm. When the crowd feels confident, smart money distributes quietly.
๐#PEPE swept the upper trigger line of the buying climax but failed to sustain higher levels, followed by a candle breaking below the lower trigger line. This is a classic confirmation that supply is dominating. If bearish momentum continues, the next probability of major downside target sits around 2230 and it could be reached sooner than most expect.
๐If #PEPE manages to break above the key resistance at 3190 with a strong momentum candle, this whole bearish probability would be invalidated, and we could instead see a bullish continuation. As always, we let price confirm our bias.
Discipline is key, Paradisers! The charts may look volatile, but this is where professionals thrive and amateurs panic. Donโt let emotions guide your trades. Wait for clear confirmation and manage risk like a pro. Strive for consistency, not quick profits. Treat the market as a businessman, not as a gambler.
MyCryptoParadise
iFeel the success๐ด
Pepe Higher Low, Bullish Continuation ? Pepe continues to trade within a well-defined range between weekly and daily support, with price currently hovering around the Point of Control (POC) of the local range. This level is reinforced by the VWAP, creating an area of technical interest where buyers and sellers are actively competing for control.
While short-term volatility remains possible, there is still a probability of one final rotation lower toward the key swing low. This region is strengthened by the 0.618 Fibonacci retracement, adding another layer of technical confluence that could attract buyers. If price reaches and successfully holds this support, it would reinforce the likelihood of a higher low forming within the broader market structure.
From a technical perspective, this would maintain the current bullish outlook and provide the foundation for a rotation back toward the upper boundary of the range. The key is to see buyers defend the confluence zone and reclaim momentum after any final downside sweep.
As long as support remains intact, the current structure continues to favour accumulation rather than a trend reversal, with a higher low potentially acting as the launch point for the next move higher.
PEPE's Next Big Move?Yellow Paradisers! What if #PEPEUSDT has already completed its Wyckoff Accumulation and is preparing for a powerful markup phase?
๐#PEPEUSDT is respecting a textbook Wyckoff Accumulation structure. After printing a Selling Climax (SC) followed by an Automatic Rally (AR) and multiple Secondary Tests (ST), price completed a decisive Spring Shakeout, trapping late sellers below support before quickly reclaiming the trading range. The subsequent Last Point of Support (LPS) and Backup (BU/LPS) indicate that smart money continues to absorb supply, signalling that accumulation is nearing completion.
๐Price is now holding firmly above the demand zone around $0.0000270-$0.0000275 while forming higher lows, reflecting increasing buyer control. As long as this demand area remains defended, the bullish Wyckoff structure stays valid and the probability of entering the markup phase continues to increase.
๐The first upside objective is the resistance near $0.0000320. A confirmed breakout above this level could open the way toward the internal resistance around $0.0000385, while sustained buying momentum may eventually challenge the major resistance near $0.0000460, completing the projected Wyckoff markup.
๐However, if sellers regain control and push price below the major support around $0.0000224, especially with a confirmed close beneath the invalidation level near $0.0000214, the current accumulation scenario would be invalidated, suggesting that additional consolidation or a deeper markdown may occur before the next bullish trend develops.
๐Trade the confirmation, not the prediction. Patience and disciplined risk management always outperform emotional decisions.
MyCryptoParadise
iFeel the success๐ด
PEPEUSDT at a Critical Resistance โ Breakout or Major Rejection?๐ Technical Analysis
๐ต Coin: CRYPTOCAP:PEPE #PEPE
โณ Time Frame: 12H
๐ Pattern: Ascending Triangle + Key Resistance Retest
๐ฏ Market Structure: Neutral to Bearish (Awaiting Confirmation)
---
๐ Pattern Analysis
๐ Ascending Triangle
The chart is forming an Ascending Triangle, characterized by:
๐ A rising trendline connecting higher lows, indicating buyers are gradually building momentum.
๐ง A strong horizontal resistance zone (Key Resistance) that has rejected price multiple times.
โ ๏ธ Price is now approaching a decisive area where the next major move is likely to begin.
An Ascending Triangle is generally considered a bullish continuation pattern, but confirmation is only valid after a strong breakout accompanied by increased trading volume.
---
๐ข Bullish Scenario (40%)
โ
Buyers successfully break above the Key Resistance and secure a strong 12H candle close above it.
๐ Bullish Confirmation:
๐ A clean breakout above the resistance zone.
๐ Rising trading volume supports the breakout.
๐ Previous resistance turns into new support after a successful retest.
๐ฏ Potential Outcome:
๐ Bullish momentum accelerates as breakout traders enter the market.
๐ Price has the potential to establish higher highs and continue the upward trend.
๐ฐ A sustained breakout could trigger the next bullish expansion.
---
๐ด Bearish Scenario (60%)
โ ๏ธ Price gets rejected once again at the resistance zone and fails to break higher.
๐ Bearish Confirmation:
โ Multiple failed breakout attempts.
๐ Breakdown below the ascending trendline support.
๐ป Increasing selling pressure with bearish momentum.
๐ฏ Potential Downside Targets:
๐ก First Support: 0.258e-5
๐ก Second Support: 0.246e-5
๐ก Major Support: 0.225e-5
A breakdown below the ascending trendline would invalidate the bullish structure and could trigger a stronger correction toward the highlighted support levels.
---
๐ Key Levels to Watch
๐ง Key Resistance Zone
This is the most critical level on the chart.
A confirmed breakout is required before expecting a sustained bullish continuation.
๐ก๏ธ Ascending Trendline Support
As long as price remains above this trendline, buyers still have an opportunity to regain control.
Losing this support would significantly strengthen the bearish outlook.
๐ Volume Matters
A breakout without strong volume carries a high risk of becoming a bull trap.
Increasing volume is essential to confirm either a bullish breakout or a bearish breakdown.
---
๐ Conclusion
โ๏ธ PEPE is currently trading at a major decision point.
๐ข A confirmed breakout above the Key Resistance could initiate a fresh bullish rally and attract additional buying momentum.
๐ด However, another rejection followed by a break below the ascending trendline could lead to a deeper correction toward the marked support zones.
โณ Patience is keyโwait for confirmation before anticipating the next significant move.
---
#PEPE #PEPEUSDT #Crypto #CryptoTrading #TechnicalAnalysis #TradingView #Altcoins #AscendingTriangle #Breakout #Bullish #Bearish #Support #Resistance #PriceAction #CryptoSignals
memcoin PEPE price analysis๐ธ What if CRYPTOCAP:PEPE delivered another rally like it did in 2024? ๐
At this point, that still feels more like wishful thinking than a realistic base-case scenario.
For now, OKX:PEPEUSDT is approaching several important resistance levels. The first one sits around $0.0000035, followed by a much stronger resistance zone between $0.0000041 and $0.0000050. That's where buyers will face their first real test.
Even if CRYPTOCAP:PEPE manages to break through both resistance zones, the bigger picture wouldn't change much. The token would still be trading in the lower half of its long-term consolidation range, meaning a true bullish reversal would still require much more work.
Could CRYPTOCAP:PEPE eventually reach $0.0000140โ0.0000160? We wouldn't completely rule it out, but under current market conditions that scenario still feels... a little insane. ๐
For now, we're much more interested in how price reacts around these nearby resistance levels. They'll tell us whether this is just another relief rallyโor the beginning of something much bigger.
What do you think? Can OKX:PEPEUSDT repeat its legendary 2024 run, or has that chapter already been written?
______________
โ Follow us โค๏ธ for daily crypto insights & updates!
๐ Donโt miss out on important market moves
๐ง DYOR | This is not financial advice, just thinking out loud
PEPEUSDT 1D#PEPE is trading within a falling wedge pattern on the daily timeframe. The price is currently holding above the 50-day SMA, which supports the bullish outlook. A confirmed breakout above the wedge resistance could trigger a move toward the following upside targets:
๐ฏ $0.00000347
๐ฏ $0.00000418
๐ฏ $0.00000475
๐ฏ $0.00000533
๐ฏ $0.00000614
๐ฏ $0.00000718
โ ๏ธ Always use a tight stop-loss and apply proper risk management.
PEPE/USDT: Multi-Month Base Formation Could Fuel the Next PumpPEPE has spent the better part of the past year in a prolonged corrective phase, steadily retracing from its previous highs while forming what now appears to be a long-term accumulation base. After months of declining volatility and persistent selling pressure, price has returned to a historically attractive demand zone where downside momentum is beginning to fade.
The current structure resembles the final stages of an accumulation cycle. Extended consolidations at major support levels often precede strong impulsive moves, especially in high-beta assets like meme coins. As liquidity returns to the market, PEPE could be well-positioned to outperform if buyers regain control.
The highlighted support zone has acted as a floor throughout recent price action, and the recent stabilization suggests sellers may be losing momentum. While confirmation is still required, the risk-to-reward profile becomes increasingly attractive as price continues to build a base near long-term lows.
Bullish Targets
๐ฏ Target 1: 0.00001479 (~440%) โ First major resistance and initial breakout objective.
๐ฏ Target 2: 0.00002191 (~695%) โ Previous distribution zone where momentum will be tested.
๐ฏ Target 3: 0.00002822 (~925%) โ Prior cycle resistance and the primary long-term target.
A decisive break above the first resistance level would confirm a shift in market structure and significantly increase the probability of a sustained bullish trend.
Technical Outlook
Trend: Long-term accumulation with early signs of stabilization.
Support: Current multi-month demand zone.
Bullish Trigger: Higher lows followed by a breakout above nearby resistance.
Invalidation: A sustained close below the accumulation range would weaken the bullish setup.
Patience is often rewarded during accumulation phases. While sentiment remains subdued, history shows that meme coins can transition from extended consolidation to aggressive expansion in a relatively short period once momentum returns.
If this base holds, PEPE could be setting up for one of the strongest percentage moves of the next market cycle.
Are you accumulating at support, or waiting for breakout confirmation? Let me know your view in the comments.
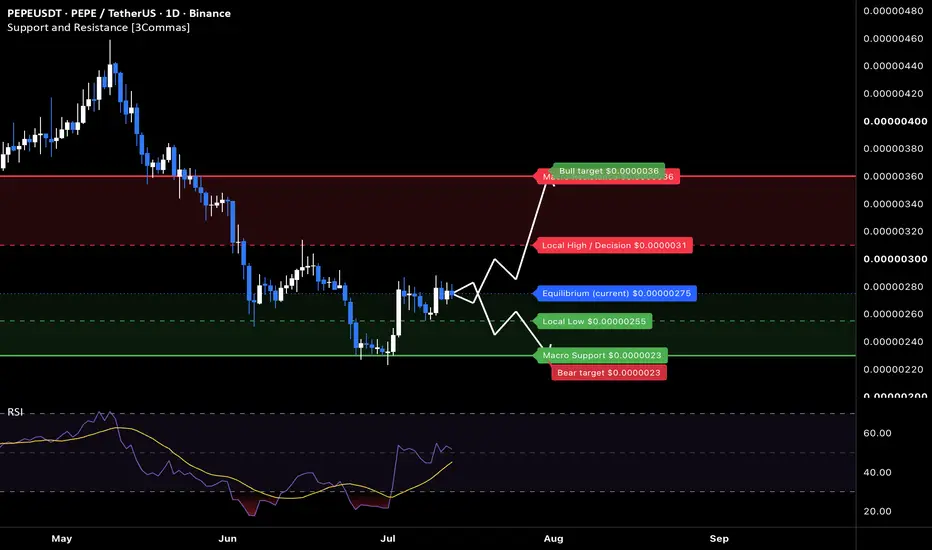
PEPE at macro floor: base recovery toward $0.0000036The Macro Picture ๐บ๏ธ
PEPE unwound its May $0.0000046 highs through a persistent descending structure, and the selling finally bottomed at $0.0000023 in early July. The tape has since changed character: price carved out a higher low, reclaimed the equilibrium, and dragged RSI back above the midline near 53. That shift from lower lows to a defended base is the first tell that supply pressure is exhausting. Price now sits at $0.00000275, holding above the flush low, and the path of least resistance is beginning to tilt back in favor of the bulls.
The Setup โ๏ธ
The Buy Area: The $0.00000255โ0.00000275 band has absorbed the recent dips. Bulls are defending the base, and as marked on the chart, price is holding above the $0.0000023 macro floor with momentum turning up.
The Accumulation Zone: A deeper retest toward $0.0000023 opens a textbook pocket for staggered, averaging-based entries โ the twice-defended floor makes this a high-confluence zone to build a position rather than chase.
The Ceiling: The $0.0000031 decision line is the first hurdle. A clean reclaim confirms the recovery structure and opens the path toward the $0.0000036 macro resistance above.
The Roadmap: Primary target sits at $0.0000036 โ the green roadmap points there as price works up from the base toward the next major shelf. Invalidation: a clean daily close below $0.0000023 would invalidate this bullish thesis and signal the base has failed.
More setups in profile.
#PEPE #CRYPTO #Memecoins #Altcoins #TechnicalAnalysis
Is PEPE the best memecoin in history? C & H- (4HR) LONG ๐โโ๏ธ๐โโ๏ธ๐กโญ๐๐ Hello all ๐๐โโ๏ธ๐โโ๏ธ๐ผ๐๐ก
Today I was just checking a few charts and PEPE couldnt help but catch my eye ๐๏ธ
I have had PEPE on my radar for a while now as I believe it has more potential than any other memecoin we have seen to date and no one is even aware yet.
Why?? โฌ๏ธโฌ๏ธ
Well let me tell you, the amazing frog๐ธ (pepe) has taken over the internet by storm, showing his face in almost every social network across the metaverse.
Places like casinos, discord, telegram, you name it. The frog always makes his way and shows his face with numbers in the thousands as far as different PEPE emojis available.
Although the coin itself has little to no utility I feel in the future this could possibly change as investors add this gem to their portfolio and allow it to soar.
This is a very speculative idea but I for one will not overlook this frog of an investment and what better time to enter than a possible CUP AND HANDLE pattern on the 4 hour view.
Lets see โฐ๐คธโโ๏ธ๐ณ
Thank you so much
Always have a stop loss โ๐๐ฒ set๐
This is not financial advice
Any thoughts ๐ญ๐ก, questions ๐โโ๏ธ๐โโ๏ธโ, good ๐, bad๐, happy ๐ or sad ๐ฅ, in the comments always welcome.๐
Jazerbay โฏ๏ธ
PEPE Testing Falling Wedge ResistancePEPE is currently trading within a potential falling wedge pattern, a structure that is often associated with bullish reversals but still requires confirmation before a breakout can be expected. Price is now approaching a significant resistance zone formed by the 0.618 Fibonacci retracement and a descending dynamic resistance trendline.
This confluence creates an important decision point for the market. If PEPE rejects from this resistance, the probability increases for a rotation back toward the daily support level. This support is critical, as it needs to hold to establish a higher low and preserve the potential for a bullish reversal. A successful defense would keep the falling wedge structure intact and improve the outlook for buyers.
However, if the daily support fails to hold, the bullish setup would weaken considerably and increase the likelihood of a deeper corrective move, extending the current bearish trend.
In the short term, traders should closely monitor how price reacts around the current resistance.
A decisive breakout above the 0.618 Fibonacci and dynamic resistance would confirm bullish momentum and increase the probability of a rally toward higher resistance levels. Until either support or resistance is broken, PEPE is likely to remain in a consolidation phase while the market waits for its next directional move.
PEPEUSDT at macro floor: bearish flush toward $0.00000220The Macro Picture ๐บ๏ธ
Since the May 2026 structural peak at $0.00000460, PEPE has executed a clean structural reset โ the multi-month $0.00000310 macro floor cracked in early June and the entire former accumulation range has now flipped into thick overhead supply. The mid-June reclaim attempt failed at $0.00000285, stamping a textbook lower high beneath the broken floor and confirming bears retain full control of the path. Price now sits directly on the $0.00000235 capitulation shelf โ the same level that absorbed the February flush โ with RSI buried near 22 and momentum still pointing south.
The Setup โ๏ธ
The Ceiling: The $0.00000310 level has cleanly flipped from multi-month macro floor to macro ceiling, and the mid-June failed reclaim at $0.00000285 confirms bears are defending the underside of the broken structure with conviction.
The Rejection: After the brief mid-June bounce attempt, price rolled over and carved a sequence of lower highs and lower lows through late June, with the smoothed RSI line refusing to push back above 30 โ momentum structure remains fully bearish.
The Sweep: The $0.00000235 macro floor desperately needs to be tested with force โ multi-month equal lows sit directly beneath it, creating a textbook liquidity pocket between $0.00000200 and $0.00000230 where sell stops from every prior holder of the range are parked.
The Roadmap: Primary target sits at $0.00000220 โ a clean break of the $0.00000235 shelf triggers the sub-capitulation liquidity hunt and clears out the equal lows before any sustainable reversal can take shape. Invalidation: a sustained daily close above $0.00000285 would invalidate this bearish thesis and open the path back toward a $0.00000310 macro ceiling retest.
PEPE Holds Key Supportm Bullish Bounce ?PEPE is currently trading at a critical daily support zone that could determine the direction of the next major move. Price action has pulled back into an area that combines two important technical factors: a significant daily support level and the 0.618 Fibonacci retracement. This confluence creates a strong reaction zone where buyers may look to step in and defend the market.
The importance of this region cannot be overstated. When a daily support level aligns with a major Fibonacci retracement, it often acts as a foundation for a reversal or continuation within the broader trend. As long as PEPE remains above this support area, the probability favors a bullish reaction rather than a continuation lower.
If buyers successfully defend the current level, the first upside objective would be a move back toward the Point of Control (POC), which represents the area of highest traded volume within the current range. A reclaim of the POC would signal improving market strength and increase the likelihood of a continued rally toward higher daily resistance levels.
From a technical perspective, PEPE is trading from a favorable location within its current structure. The market is effectively testing whether demand remains strong enough to support higher prices. Holding above the current support zone keeps the bullish outlook intact and opens the probability of a rotational move toward significantly higher price levels. For now, traders should monitor this region closely, as it may serve as the launch point for the next recovery rally.
PEPE Is Quietly Setting a Trapโฆ!Yello Paradisers! Are you prepared for a potential sharp move on #PEPE, or are you still underestimating whatโs quietly building behind the scenes? At first glance, this structure might seem like a simple and healthy pullback. But when we strip away emotions and analyse the chart objectively, a completely different narrative emerges. This is not random price action this is a high-risk, high-opportunity zone where discipline matters far more than opinions.
๐#PEPE has recently printed a classic selling climax, followed by a climactic action candle supported by ultra-high volume. This is a textbook indication of accumulation. Historically, this exact behaviour appears when smart money begins positioning ahead of a larger move. While subtle to the untrained eye, this probability carries significant weight for experienced traders.
๐#PEPE has also swept the liquidity below the selling climax with effort vs result test and then broken above the upper trigger line with a strong momentum candle. This suggests that weak hands were pushed out before stronger buyers stepped in with conviction. If the prices sustain this momentum, the next upside path can open toward 3800, which is currently acting as a major structural resistance level.
๐#PEPE is also respecting its descending support, while the market momentum has started shifting to the upside gradually. On top of that, we can see a clear RSI divergence on shorter time frame, adding more strength to the bullish probability. As long as the prices holds momentum within the fair value gap zone, the structure remains constructive, with 3300 acting as the first important resistance level to watch.
๐If #PEPE fails to hold bullish momentum and a momentum candle closes below 2450, the current bullish probability becomes invalid. In that case, we could see further downside pressure.
That is why Paradisers, we are playing it safe right now. If you want to be consistently profitable, you need to be extremely patient and always wait only for the best, highest probability trading opportunities only on confirmations.
MyCryptoParadise
iFeel the success๐ด
PEPEUSDT - Critical Support: Will the End with Massive Breakout?PEPE/USDT is currently trading within a large Descending Channel that has been forming since the late-2024 peak. This structure indicates that the medium- to long-term trend remains in a corrective phase, characterized by a series of Lower Highs (LH) and Lower Lows (LL) that clearly define the downward channel.
๐ฅ More importantly, price has now approached a historical demand/support area marked by the yellow zone between 0.00000195 โ 0.00000160.
๐ This area previously acted as an accumulation base before PEPE's explosive rally, making it a potential zone where buyers could once again step in.
---
๐ Pattern Formation
๐ Descending Channel
The primary pattern on this chart is a Descending Channel, defined by:
๐ด Descending resistance trendline (red line)
๐ก Descending support trendline (yellow line)
Pattern Characteristics:
โ
Price continues to move between two parallel descending trendlines.
โ
Represents a correction phase within a larger trend.
โ
The longer price remains inside the channel, the greater the potential for an explosive move once a breakout occurs.
โ
A breakout above the channel often signals the beginning of a trend reversal from bearish to bullish.
๐ At the moment, price is trading near the lower portion of the channel while approaching a major horizontal support zone, making this a critical area that could determine the next major market direction.
---
๐ข Bullish Scenario
For the bullish scenario to be confirmed, PEPE must hold the support zone:
๐ฏ Key Support: 0.00000195 โ 0.00000160
If this area successfully holds:
โ
A long-term Higher Low could be established.
โ
Buyers may begin accumulating at discounted prices.
โ
Price could rebound toward the channel midpoint first.
โ
The next target would be the channel's primary resistance trendline (red line).
๐ A breakout and strong close above the channel resistance would confirm a significant market structure shift.
๐ฏ Bullish Targets
๐ฅ 0.00000350
๐ฅ 0.00000500
๐ฅ 0.00000900
๐ 0.00001200
๐ 0.00001600
๐ฅ Under the most optimistic scenario, a major breakout from the channel could open the door for a move toward new all-time highs in the future.
---
๐ด Bearish Scenario
The bearish scenario becomes active if:
โ Price loses support at 0.00000195 โ 0.00000160.
โ Higher-timeframe candles close below the support zone.
โ Selling pressure increases and the Lower Low structure continues.
If support fails to hold:
๐ฏ Potential downside targets include:
๐ป 0.00000120
๐ป 0.00000100
๐ป 0.00000075
โ ๏ธ These levels could become the next downside objectives due to the lack of strong historical support between current prices and those areas.
---
๐ Conclusion
๐ธ PEPE is currently trading at one of the most important price zones since the beginning of its major uptrend.
๐จ The 0.00000195 โ 0.00000160 zone represents a key historical support area that may serve as a long-term accumulation region.
๐ As long as price remains above this zone, the possibility of a rebound toward the channel resistance remains valid.
๐ However, if support breaks down, bearish pressure could continue pushing price toward lower levels.
๐ฏ In other words, the current area may determine whether PEPE begins a new recovery phase or extends the correction that has been ongoing for more than a year.
๐จ Price action around this zone deserves close attention, as it could define PEPE's trend direction for the coming months.
---
โ ๏ธ Disclaimer
๐ This analysis is for educational purposes only and should not be considered financial advice.
๐ก๏ธ Always practice proper risk management, conduct your own research, and wait for confirmation before making any trading or investment decisions.
#PEPE #PEPEUSDT #Crypto #Cryptocurrency #Memecoin #Altcoin #TechnicalAnalysis #TradingView #PriceAction #DescendingChannel #SupportResistance #Breakout #Bullish #Bearish #Accumulation #SmartMoney #MarketStructure #ChartAnalysis #CryptoTrading #Altseason
PEPEUSDT: Key Support Test Before Potential Move Toward Liquidit๐ The Setup
PEPEUSDT is currently trading on the 1D timeframe after a longer corrective/downtrend structure. Price is sitting near a lower support area, while two major upside liquidity/target zones are marked above the current market price.
The setup is mainly based on a potential support reaction + liquidity sweep recovery, with upside targets placed near previous resistance/liquidity areas.
๐ง The Logic
Price has been moving in a broader downtrend, forming lower highs and lower lows.
Current price is testing an important support/demand area around the lower part of the recent range.
The long setup becomes more interesting if price starts to show a bullish reaction from this zone.
The first major resistance/liquidity area is around TP1, near the previous consolidation and supply zone.
The second target, TP2, is placed higher, near a stronger liquidity zone from the previous market structure.
Volume has not yet shown strong bullish confirmation, so this setup still needs price action confirmation.
๐ก Important: No RSI/MACD confirmation is visible on this chart, so the analysis is based mainly on price action, support/resistance, and liquidity zones.
๐ The Plan
โ
Entry
Potential long entry around the current support area:
Entry zone: 0.00000270 โ 0.00000280
A safer confirmation would be a daily candle close showing bullish rejection or a reclaim of the local structure.
๐ก๏ธ Stop Loss
SL: around 0.00000190
The stop loss is placed below the current support zone. If price breaks and closes below this level, the bullish recovery scenario becomes invalidated.
๐ฏ Take Profit Targets
TP1: around 0.00000480 โ 0.00000500
This is the first major resistance/liquidity area and could be a reasonable place to secure partial profits.
TP2: around 0.00000720 โ 0.00000730
This is the higher liquidity zone and a more ambitious target if bullish momentum returns.
โ๏ธ Risk/Reward
The setup offers a potentially attractive Risk/Reward Ratio, especially if the entry is taken close to the current support zone. TP1 already gives a favorable reward compared to the stop loss, while TP2 offers a much stronger upside scenario.
โ ๏ธ Disclaimer
This is not financial advice. This analysis is for educational purposes only. Always manage your risk and do your own research before entering any trade.
๐ฌ What do you think?
Do you think PEPEUSDT can hold this support and move toward TP1, or is another downside move more likely? Let me know your thoughts in the comments.