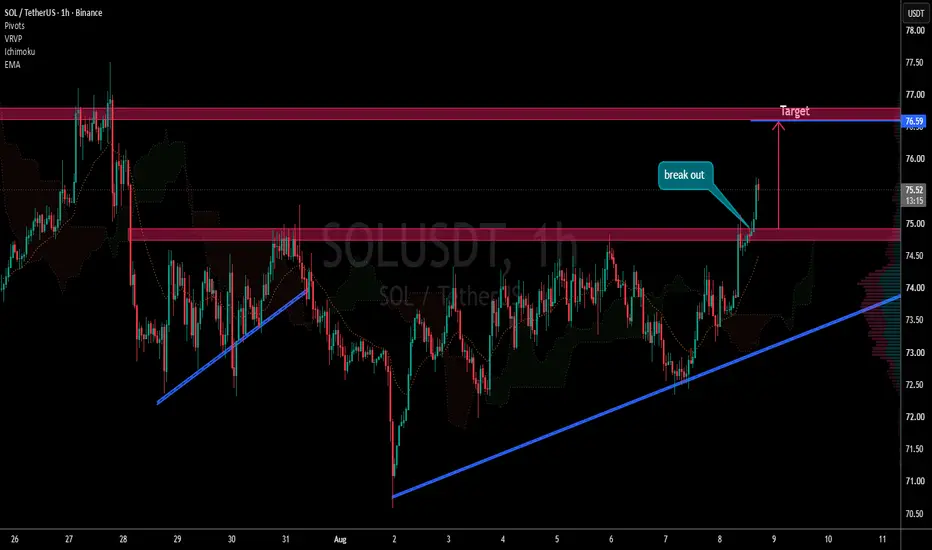
SOL/USDT 1H — Breakout Setup Toward $76.59The chart shows **SOL/USDT on the 1-hour timeframe** breaking above a clearly defined **resistance zone around $74.80–$75.00**. The breakout is supported by rising momentum, with price currently trading around **$75.48**.
### 🎯 Key Levels
* **Breakout zone:** $74.80–$75.00
* **Current price:** ~$75.48
* **Target:** **$76.59**
* **Target zone:** approximately **$76.50–$76.70**
* **Trend support:** Rising blue trendline around $73.5–$74.0
### 📈 Trade Setup
A sustained move above **$75.00** confirms the breakout structure and opens the path toward the marked **$76.59 target**.
**Breakout → $75.00**
⬆️ **Target → $76.59**
If SOL fails to hold the breakout zone, the setup could weaken and price may retest the **$74.80–$75.00** area before making another attempt higher.
### 🏷️ Suggested Chart Title
**“SOL/USDT 1H — Resistance Breakout | Target $76.59”**
**Bias:** 🟢 **Bullish above $75.00**, targeting **$76.59**.
In-depth trading ideas
SOL/USDT Bullish Breakout Setup Toward Resistance
SOL/USDT is trading within a recovery phase after rebounding from the major support zone near **71.00**. Price has reclaimed the Ichimoku cloud and is attempting to build bullish momentum. The highlighted resistance area around **75.27** remains the key level to watch, as it has previously acted as a strong supply zone. If buyers maintain control and price breaks above the cloud with sustained volume, the pair could extend its rally toward the marked target. However, rejection from the resistance zone may lead to another pullback before a larger move develops.
**🎯 Target:** **75.27 USDT**
Solana Breaks Falling Wedge — Is the Next Move $85–86 or $94–96?The market does not reward traders for being early. It rewards those who know when the market has finally confirmed its direction.
BINANCE:SOLUSDT Solana has gone through a relatively long correction after its previous bullish impulse. During this correction, price formed a falling wedge, gradually compressing the market and creating a clear battle between buyers and sellers.
Now, the structure is starting to change.
Price has broken above the falling wedge, and on the lower timeframe we are already seeing early signs of bullish market structure.
This is the first important improvement in the setup.
However, I don't want to chase the breakout.
🟢 Bullish Scenario
The key area I am watching for a potential long setup is around the $74 support zone.
If price holds this area and gives us a clear bullish confirmation on the lower timeframe — such as a bullish rejection, strong candlestick pattern, or a continuation of higher highs and higher lows — the probability of further upside increases.
The first major objective is:
$85–86
This area combines an important resistance zone with the 61.8% Fibonacci expansion level, making it a natural area to expect the first serious reaction from sellers.
If SOL can break and hold above this resistance, the larger target becomes:
$94–96
This is the major mid-term resistance zone and the next important objective from the Fibonacci expansion structure.
So the bullish roadmap is:
$74 support → $85–86 resistance → $94–96 major resistance
🔴 Bearish Scenario
The bullish setup is not unconditional.
If price loses the $74 support zone and starts showing bearish market structure on the lower timeframe, I would no longer be interested in forcing a long position.
The major invalidation level is $70.
A decisive break below $70 would invalidate the current bullish structure and suggest that the falling-wedge breakout may have failed.
In that situation, I would step aside and wait for a new structure rather than trying to predict the bottom.
What I am watching now
The most important thing is not the next green candle.
I want to see how price behaves around the $74 area.
If SOL pulls back into this zone and buyers defend it with strong price action, that could provide a much better risk-to-reward opportunity than chasing the current move.
On the other hand, if price continues higher without giving a proper pullback, I would rather miss the first part of the move than enter with poor risk management.
The breakout gives us a direction. The retest gives us an opportunity.
Targets remain $85–86 first and $94–96 as the major mid-term objective.
Risk should always be defined before entering. A lower-timeframe bearish structure or a break below $70 would invalidate this bullish thesis.
Major 10X LONG with 3,890% potential on SOLUSDT (Solana)My God! It is incredible and at the same time it is amazing. This is a chart setup that we have been tracking for months. Still, six months later (gone already) and Solana continues to trade within the extreme opportunity buy-zone.
When was the last time you saw Solana trading at the same price, sideways, neutral for six months straight, after more than a year of a bear market?
Yes, the year was 2022 and this was the bottom and the best possible opportunity to trade, to accumulate, to invest, to buy and hold.
Six months at the bottom? Where is the downtrend? What about lower lows?
The lack of these signals reveals the end of the bearish cycle. The end of the bearish cycle opens the opportunity to go LONG. This is a perfect chart setup, the build-up process is reaching its end.
It looks good...
We have another opportunity at a very strong, high leverage (with high risk) trade. What will it be?
Profits are coming within days.
Will you take action? Will you let the market and all these opportunities just vanish?
What are you reading for?
How are you feeing in this wonderful day?
Full trade-numbers below:
_____
LONG SOLUSDT
Leverage: 10X
Potential: 3890%
Allocation: 5%
Entry zone: $70 - $76
Targets:
1) $88.8
2) $97.7
3) $112
4) $121
5) $135
6) $158
7) $188
8) $200
9) $244
10) $280
11) $362
Stop: Close weekly below $69
_____
Thank you for reading.
(Follow is optional but recommended—support highly appreciated.)
Namaste.
SOL - Correction Before the Next ImpulseAfter a strong bullish impulse, SOL entered a healthy correction phase, currently trading within a falling channel. 📊
📌 As long as price remains inside this channel, the correction is still in progress. However, once the upper boundary of the falling channel is broken to the upside, we will be expecting the correction to end and the next bullish impulse to begin.
Rather than trying to predict the breakout, we will wait for price to confirm the shift in momentum before looking for buy opportunities.
Will SOL complete its correction and resume the uptrend, or will sellers keep control a little longer? 🤔
⚠️ Disclaimer: This is not financial advice. Always do your own research and manage risk properly.
📚 Stick to your trading plan regarding entries, risk, and management.
Good luck! 🍀
All Strategies Are Good; If Managed Properly!
~Richard Nasr
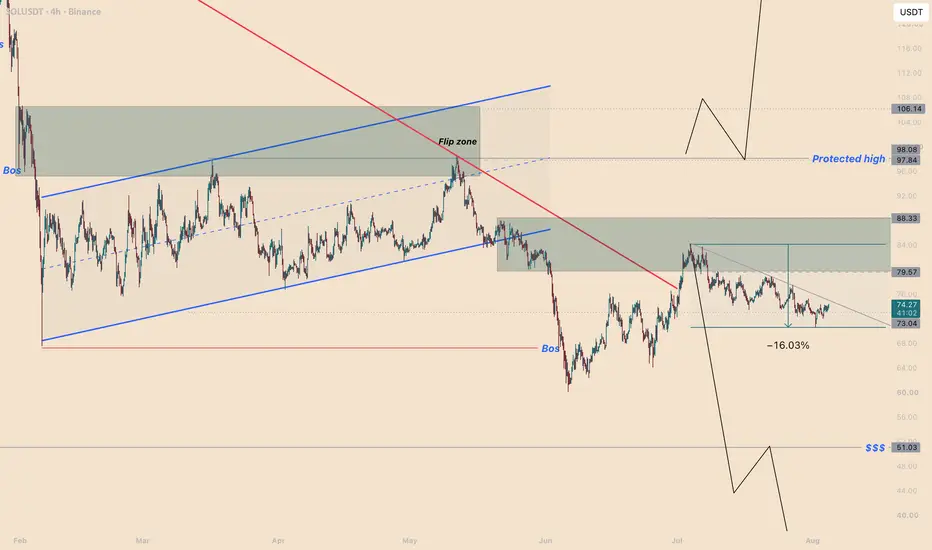
SOL | Rejected For −16.03% Exactly As CalledBy analyzing the #SOL (Solana) chart on the 4H timeframe, we can see that the scenario we weighted as primary has delivered — and I want to report it precisely, including the part that is not finished. On 9 July we published with price at $77.74 , sitting inside the Flip Zone after a corrective rally, and we put two scenarios on the table. We called Scenario A — direct rejection and downtrend resumption — the higher-probability path, for one specific reason: the rally into that zone was corrective in character, not impulsive. Price has since dropped −16.03% . You can revisit the original breakdown here:
⏱️ 4H Timeframe
The higher-timeframe structure has not changed, and that is the point. Price printed an external CHoCH, sold off through repeated iCHoCH and iBOS sequences, and confirmed the shift with an external BOS. Every corrective rally since has stayed shallow — the signature of a market where sellers still set the terms.
The corrective leg we published on carried price into the F Zone ($79.57 – $88.33) , the exact supply we flagged. It tapped the zone, failed to hold it, and rolled over — and from there the decline was clean and sustained, running −16.03% lower. Price is currently trading around $74.28 , comfortably beneath the zone that rejected it.
Now the honest part: the target is not complete. The sell-side liquidity we mapped at $51.03 has not been touched. This is a working idea that has paid partway, not a closed one, and I would rather say that plainly than dress a partial result up as a finished trade.
Above price, the structure is stacked against the bulls. The F Zone base at $79.57 is the first ceiling, the descending trendline sits above it, and the Protected High at $97.84 remains the structural line in the sand for the entire bearish thesis — untouched since we named it.
🎯 The Bias
Both scenarios from the original idea remain live, and neither has been resolved. Here they are, updated.
Scenario A — continuation (still primary). My base case is unchanged: this is a downtrend that paused, not one that ended. As long as price stays capped beneath the F Zone at $79.57 – $88.33 , every push higher remains a selling opportunity rather than a reversal, and the draw stays toward the sell-side liquidity at $51.03 — with the deeper pool we mapped at $12.93 only relevant on a genuine momentum break. The reason I still weight this path is the same reason I weighted it in July, and it has only strengthened: buyers have not produced a single impulsive leg. Corrective rallies that fail at supply do not become uptrends.
Scenario B — the reclaim (still conditional). I have to keep this on the table honestly. If buyers force price back through the F Zone and then deliver a clean daily close above the Protected High at $97.84 , the structure flips bullish and this entire idea is invalidated. On that, the upper Flip Zone ($94.82 – $106.14) and the FVG we mapped above at $144.62 – $151.04 come into play. That is a high bar — but it is a specific, testable one, and I would rather name it than pretend the bearish case cannot fail.
The rule that separates the two: a break is a candle close, not a wick . Price has now spent weeks failing at this zone. Expect at least one spike back into it designed to convince the market the rejection is over. Let the close decide, and don't sell blindly into a level that has already paid 16%.
📰 Fundamental Backdrop
The backdrop is genuinely split, and both halves deserve stating.
On the bearish side, momentum is where the chart says it is. Solana has been trading in the $72–$74 region, holding beneath both its 20-day EMA at $75.81 and its 50-day EMA at $76.27 , with the 14-day RSI around 43 — weakening, not recovering. That detail matters structurally: those two moving averages sit directly between current price and the base of our F Zone, forming a second shelf of resistance right where sellers are already active. The recovery attempt off the June lows has stalled, and SOL remains far below its all-time high near $293 .
On the bullish side, and this has improved since our July note, the institutional bid is real. US spot Solana ETFs have continued to post net inflows rather than outflows, and the newly approved Morgan Stanley Solana ETF is an additional supportive channel. On-chain, over 67.7% of SOL supply is now staked , which meaningfully tightens liquid float. And the Alpenglow consensus overhaul — targeting roughly 150ms finality — remains the pending upgrade we flagged in July and is the single most credible catalyst for a genuine re-rating.
So the conflict is honest: flows and fundamentals are improving while price and momentum are not. In my view that tension resolves at $79.57 and, ultimately, at $97.84 . Until the fundamentals produce a daily close above those levels, they are a reason to respect the bearish case with tighter risk — not a reason to abandon it.
This analysis will be updated as the market evolves. If this breakdown added value, drop a like 👍 and a comment 💬 to support the work — and share where you see Solana heading next! Best Regards, BigBeluga 🐳
SOLANA Hourly Time Frame Analysis SOLUSDT | 1H Analysis 📈
A potential contracting triangle is nearing completion. If the E wave finishes as expected, SOL could trigger a strong bullish breakout above resistance.
Key Zone: $74.20–$74.40
Bullish Target: $76.00+ (confirmation required)
⚠️ This is a technical analysis, not financial advice. Always wait for confirmation and manage your risk.
SOL/USDT 2H – Breakout, Fake Breakout & Target SetupThe chart shows **SOL/USDT on the 2-hour timeframe**, with price currently around **74.91 USDT**.
* **Key resistance:** 76.6–76.8 USDT (upper red zone)
* Price previously pushed above this resistance but failed to hold it, creating a **fake breakout** and rejection.
* **Key support / breakout zone:** 74.7–74.9 USDT (lower red zone)
* Price has recently broken above this zone, suggesting a potential **bullish continuation** if the level holds as support.
* The **blue ascending trendline** provides additional dynamic support and keeps the short-term structure bullish.
* **Target:** around **76.5–76.8 USDT**, where the previous resistance zone is located.
### 🎯 Trade idea
**Bullish above 74.9 USDT → Target 76.6–76.8 USDT.**
A sustained move back below **74.7 USDT** would weaken the breakout setup and could invalidate the bullish scenario.
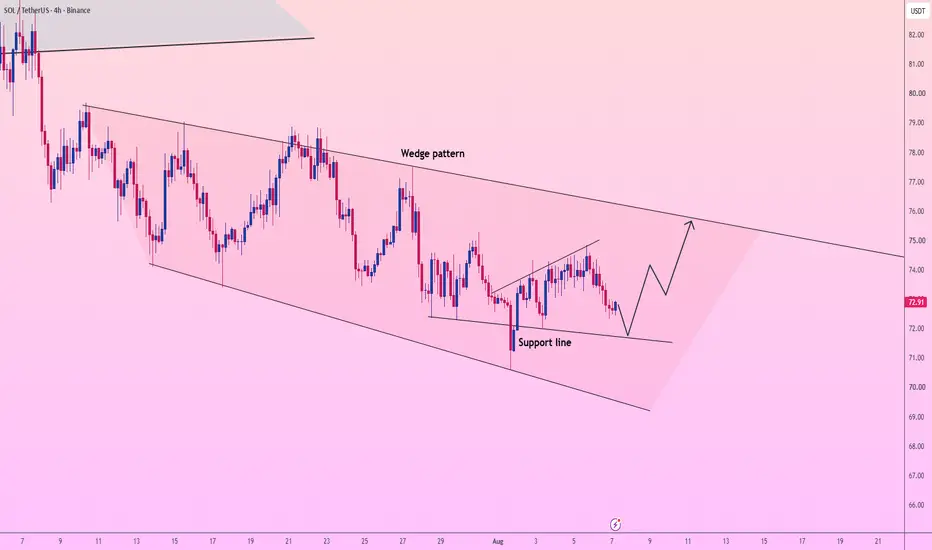
SOL/USDT: THE $75.80 WEDGE REBOUND EXPANSION! 🚀
Testing local support near 72.90! Are you panic-selling into this local pullback, or getting ready to buy the trendline bounce back to wedge resistance? 🤔
Solana is coiling tightly near key structural support on this 4-hour Binance chart. SOL is trading around 72.90 inside a macro Wedge pattern, pulling back directly toward its local Support line to sweep liquidity and set up the next major upward wave. 📈💥
Look closely at the black blueprint trajectory mapping out the coming sessions. The algorithm projects a textbook multi-wave rebound sequence:
• A localized dip down to retest the Support line around $71.80 - $72.00 to sweep weak hands and absorb retail sell orders. 🧹
• A sharp, high-velocity impulse rebound surging up toward the $74.20 region. ⚡
• A healthy higher-low pullback retesting $73.30 to solidify structural support. 🌊
• Final expansion rally accelerating straight up to target the overhead descending Wedge pattern resistance near $75.80. 🎯🏹
Maintaining technical patience and trendline alignment is your ultimate superpower in this environment. Trying to force short positions directly into a verified support floor inside a larger wedge is a fast track to getting caught in an aggressive short squeeze. Professional desks wait for the support test to clear before aligning their capital directly alongside the primary buy flow. 🧘♂️⚡
🛠 Trade Parameters:
🛒 Long Zone: 71.50 - 72.20 🛍️
🛑 Stop-Loss: 4h close below 70.50 ❌
💰 Take-Profit: 75.80 🎯
The retail bears trying to short the bottom of this support floor are running into strong institutional buy orders. Stay focused, strictly manage your risk, and let the algorithm carry the trade up to our target.
Maintain your composure through the waves, and we will see you up at the $75.80 wedge target ceiling! 🚀💎
#SOLUSDT: $264 Is Going To Get Touched, Get Ready 🔺A further price decline and a subsequent touch around our buying zone of $50 to $40 would suggest a potential reversal towards our all-time high of $264. We have three targets from the current level to the all-time high. Fundamentals are likely to support our view in the long term.
🔺The zone we are targeting to buy from has a high probability of reversal as it is still under-sold. We recommend waiting for the price to reach this area before entering a trade as a sharp reversal is likely.
Solana Remains Under Increasing PressurePrimary trend remains bearish
Solana continues to trade within its primary weekly downtrend, with the broader structure still favouring the bears. The previous period of sideways consolidation was followed by a sharp 38% decline, highlighting the risk of assuming support will hold.
100/50-Day EMAs remain a barrier
The 100/50-day EMAs remain bearishly crossed, with price continuing to find resistance beneath both moving averages. Until bulls reclaim these averages, the broader technical outlook remains negative.
Support beginning to weaken
Price has slipped below the initial $74.00 support area, a level that has repeatedly attracted buyers since mid-June. Failure to reclaim this zone would increase the probability of another move towards the $64.04 swing low, with the significant $60.13 low below.
Resistance remains overhead
The first resistance sits around the former $74.00 support zone, followed by the more significant confluence around $83.70-$83.98. This area also aligns with the 0.618 Fibonacci retracement, strengthening its importance.
Momentum remains mixed
RSI continues to chop just below the 50 level, while StochRSI has crossed higher from oversold territory. Although volume has declined during the latest sell-off, momentum is not yet signalling a decisive bullish reversal.
In Summary
Solana remains trapped within a broader bearish trend, with the bearishly crossed 100/50-day EMAs continuing to cap any recovery attempts. The loss of the $74.00 support zone leaves price vulnerable to further downside towards $64.04 and potentially $60.13. Bulls first need to reclaim $74.00, followed by the major resistance around $83.70-$83.98, before the technical outlook begins to improve.
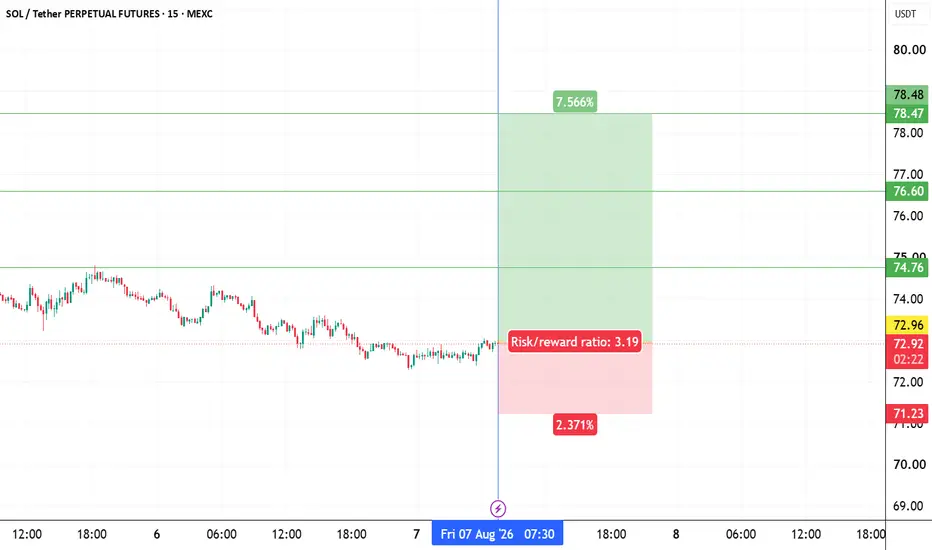
solusdt longInstructions:
Entry point: yellow
Stop loss: red
Take profit: green
👉Leverage x 5-10-20 for crypto
👉Leverage x 20-50-100 for commodities, stocks, indices, and forex
👉Margin 1-5% max.
Always practice risk and money management.
Invest a maximum of 5% on any trade or across all your trades.
Invest only what you can afford to lose, as no one is in control of the market.
👉Our analyses are primarily based on:
breakouts: two trend lines (ascending and descending) and a line indicating a horizontal breakout.
chart patterns: shoulders and head, triangle parttern, elliott impulse, etc etc.
We don't always have the time to track them at all times or to represent them visibly, given the numerous signals, the number of channels to manage, and especially because of the often rapid pace of market movements.
indicators: We associate at least two indicators with this technique.
👉Depending on the circumstances, we use specific indicators, often setting 3 or more take profit levels.
👉Indeed, there are good days in trading and also bad days. No one can promise to win every trade, and like all traders worldwide, we also experience stop-loss orders. However, we win more than we lose and remain positive.
👉You can close the position before or after the take profit orders indicated by the green lines if you are personally satisfied; the same applies to stop loss orders.
👉We must stay positive, clear-headed, and humble.
we cannot provide all instructions or all trades here on this channel.
Good luck to us all, and may God guide us. Amen.
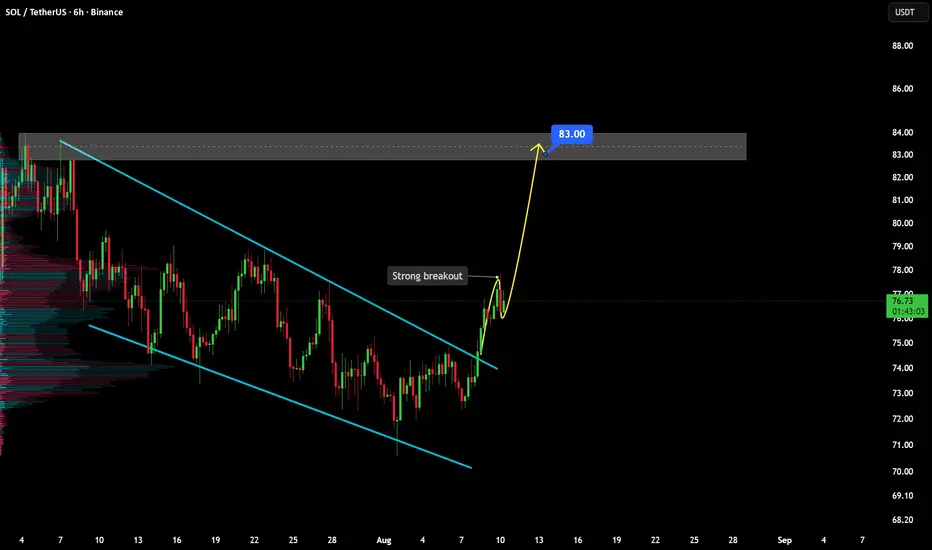
SOLUSDT – Bullish Breakout & Continuation Setup Toward 83.00SOLUSDT – Bullish Breakout & Continuation Setup Toward 83.00
🔍 Market Overview
SOLUSDT is showing a clear bullish shift after breaking above the descending channel that had controlled price for several weeks. The breakout came with strong momentum, suggesting that selling pressure is fading while buyers are beginning to regain control.
Price is now holding above the broken channel structure. If this area continues to act as support, the breakout could develop into a broader bullish continuation toward the next major resistance zone.
⸻
📈 Market Structure Insight
Market Bias: Bullish
Momentum: Improving after breakout
Current Phase: Trend reversal into bullish continuation
The key structural change is that price has moved outside the previous descending channel. As long as SOLUSDT remains above the breakout area, the current structure continues to favor buyers.
⸻
🚀 Trading Scenarios
✅ Bullish Scenario (Primary Bias)
Conditions:
Price remains above the broken channel resistance.
A controlled pullback holds as new support.
Buyers return with bullish candles, rejection wicks, or renewed momentum.
Trade Plan:
Look for buying opportunities on a healthy pullback into the breakout area or after clear bullish confirmation above the current consolidation.
🎯 Target: 83.00
⸻
❌ Bearish Invalidation Scenario
Conditions:
Price falls decisively back inside the descending channel.
The breakout area fails to hold as support.
Selling pressure increases without a meaningful bullish response.
A confirmed move back inside the previous structure would weaken the bullish outlook and increase the probability of a deeper correction.
⸻
📍 Key Levels to Monitor
🟢 Breakout Support: Former upper boundary of the descending channel
🟢 Major Resistance / Target: 83.00
🔴 Invalidation: Sustained trading back inside the channel
⸻
⚠️ Trading Perspective
The breakout itself is already an important bullish signal, but the next reaction matters even more. A successful retest would show that former resistance has turned into support and that buyers are willing to defend higher prices.
Rather than chasing the initial move, the cleaner setup would come from a controlled pullback followed by renewed buying pressure.
⸻
🧠 Professional Insight
This setup is supported by:
A decisive breakout from a prolonged descending channel.
Strong bullish momentum during the breakout.
Price holding above the previous structure.
Weakening bearish control.
A clearly defined upside objective around 83.00.
The highest-quality long setup would come from a successful retest of the breakout zone, confirming that buyers have fully taken control.
⸻
🛡️ Risk Management
Risk only 1–2% of trading capital per position.
Wait for bullish confirmation before entering.
Keep the invalidation level below the confirmed breakout structure.
Avoid chasing extended bullish candles.
Respect the breakdown level and protect capital.
No confirmed support, no trade.
Disclaimer: This analysis is for educational purposes only and should not be considered financial or investment advice.
Falling Wedge on SOLUSDT: Ready to Break Higher?SOLUSDT is being tightly compressed within a narrowing falling wedge, with price testing the upper trendline three times and reacting from the lower boundary twice. The repeated pressure against resistance suggests that sellers are gradually losing control and that the upper boundary is becoming increasingly vulnerable.
A decisive breakout and close above the wedge would confirm bullish momentum and increase the likelihood of a move toward 78.00.
Until then, traders should wait for clear follow-through and stronger trading volume to reduce the risk of a false breakout.
SOLUSDT - Manipulation by MM could trigger a drop BINANCE:SOLUSDT remains in a broader bearish trend, with price developing a local downtrend inside the 74.55–72.30 trading range. Within this structure, I expect a potential market maker manipulation phase
The fundamental backdrop for the cryptocurrency market remains weak. Bitcoin has already broken its local bullish structure and is building bearish momentum ahead of a possible continuation lower. Further weakness in the market leader could weigh on the rest of the crypto market
Against this backdrop, Solana shows little relative strength. The medium-term countertrend correction has transitioned into a local downtrend, with price now consolidating inside a range. The primary focus is on 74.55, where I expect market makers may retest resistance and sweep liquidity before the next bearish leg
Resistance: 74.55
Support: 73.13, 72.30
SOLANA is consolidating within a range that has accumulated significant liquidity around its boundaries. Given the weak fundamental backdrop and prevailing bearish trend, a short squeeze into the 74.55 resistance zone could become the technical trigger for another decline toward the listed support levels
Best regards,
R. Linda
SOL updateBINANCE:SOLUSDT trades at $74.27 (+0.42%). The key governance story is SGP-0003 — a validator proposal that would push daily SOL burns from ~$47K to ~$650K by overhauling fees and doubling the disinflation rate. It needs 40M more SOL in validator support within two weeks to reach a vote. Morgan Stanley's recent SOL ETP launch adds another institutional access point in the background.
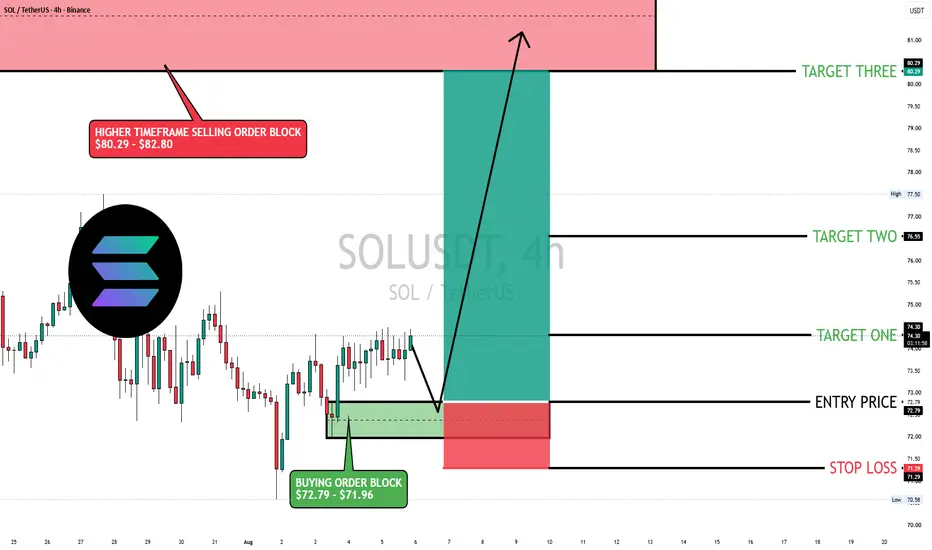
Bias: Bullish, but conditional on price coming back down first. Price is currently ~2% above the $72.79–$71.96 buying order block that this whole setup is built around. Daily RSI at 46.17 leaves room for that pullback without flipping the broader picture bearish.
The plan: Wait for price to retrace into $72.79–$71.96, then look for a bounce. Entry doesn't trigger until that zone is actually tested — this is not a "buy the current price" setup.
Levels (entry $72.79, SL $71.29, risk $1.50 / 2.06%):
TP1 $74.30 → +2.07% → ~1.0R
TP2 $76.55 → +5.17% → ~2.5R
TP3 $80.29 → +10.31% → ~5.0R, into HTF selling block $80.29–$82.80
Analysis: The order block only means something if price actually reacts there — if it breaks straight through $71.96 with volume, the thesis is invalidated, not just "on hold."
Common mistake: entering early because you're anxious to not miss the move. The entry is the retest, not the current candle. If price never comes back, that's a missed trade — not a reason to chase.
Not financial advice — size and plan your own risk.
#SOL #Solana #Crypto #TradingView
SOL opportunity!Hey guys!
It seems that the corrective wave C is either complete or nearing its end.
Based on this, we have two scenarios:
1. If the price breaks above the $95–$105 box on the weekly timeframe, a change of structure (CHOCH) will be confirmed. Subsequent pullbacks can then be considered as buying opportunities.
2. If the price drops further before breaking the mentioned box, you can enter in two phases (blue zones):
· First phase: 50% of capital
· Second phase: remaining 50% of capital
NFA-DYOR
Building Momentum for a Move Above 82.79 Is the Key
Hello, traders.
If you follow me, you'll be able to receive new market updates and analysis as soon as they are posted.
Wishing you a successful trading day.
━━━━━━━━━━━━━━━━━━━━━━━━━━━━━━━━━━
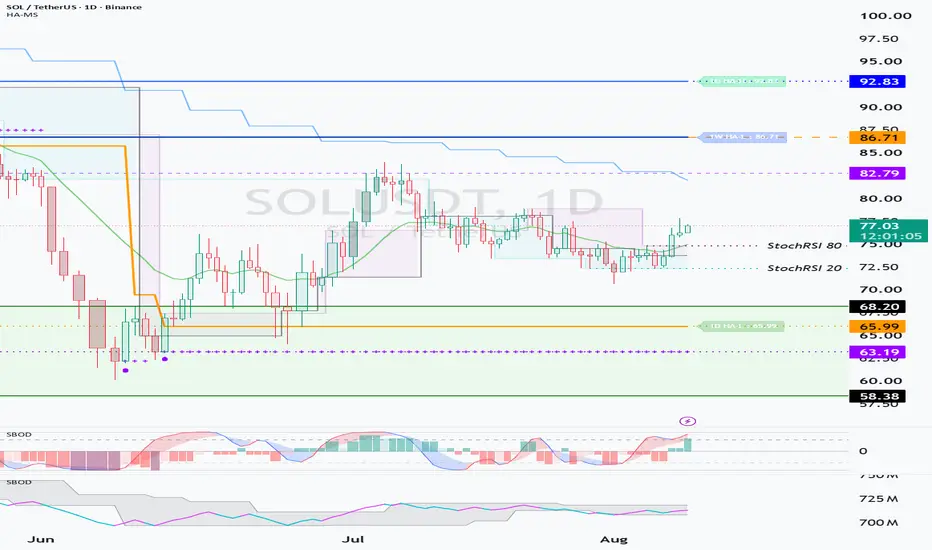
■ SOL Key Support & Resistance Zone
SOL is currently trading near one of its most important support and resistance zones:
▶ 58.38 ~ 68.20
If SOL establishes solid support around this area, the probability of a medium- to long-term trend reversal could increase significantly.
On the other hand, if price breaks below the 58.38 ~ 68.20 zone, SOL may enter a price range that should be approached from a longer-term investment perspective.
Therefore, it is important to prepare a capital management and risk management strategy in advance in case this zone fails to hold.
The HA-Low on the 1W chart is currently located around:
▶ 86.71
For SOL to develop a meaningful bullish structure, the key will be whether price can move above 86.71 and successfully turn this level into support.
━━━━━━━━━━━━━━━━━━━━━━━━━━━━━━━━━━
■ How Should We Use HA-Low and HA-High?
The major trading opportunities on this chart are determined by how price reacts around the HA-Low and HA-High levels.
In simple terms:
▶ HA-Low = Key zone for buying and accumulation
▶ HA-High = Key zone for profit-taking and managing positions near potential highs
The HA-Low area is one of the key zones for looking for buying opportunities.
However, a breakdown below HA-Low should not automatically be interpreted as a buy signal.
If HA-Low continues to move lower in a step-down pattern, it indicates that the market is still undergoing additional price correction.
At the same time, this process may eventually develop into an accumulation structure that sets the stage for a future bullish reversal.
Therefore, as HA-Low moves lower, rather than entering a large position all at once, it is more important to monitor whether price establishes support around each newly formed HA-Low and build the position gradually.
HA-High has a completely different role.
Since HA-High represents a potential high-price zone, protecting profits should be the priority when price approaches this area.
Therefore, around HA-High, traders should consider:
▶ Partial profit-taking
▶ Raising stop levels
▶ Protecting unrealized profits
If price falls below HA-High and the level turns into resistance, reducing risk through a stop-loss or additional partial selling may be necessary.
On the other hand, if price breaks above HA-High and successfully converts it into support, a short-term day-trading opportunity may develop.
However, if price subsequently falls back below HA-High and the level becomes resistance again, strict stop-loss management is essential.
In other words:
▶ HA-Low breakdown = Look for accumulation structure and potential re-entry opportunities
▶ HA-High breakdown = Prioritize profit protection and risk management
Although both situations involve price moving lower, their implications are fundamentally different.
━━━━━━━━━━━━━━━━━━━━━━━━━━━━━━━━━━
■ A Strong Rally Ultimately Requires a Break Above HA-High
For price to transition into a strong bullish trend, it ultimately needs to break above HA-High and maintain price above that level.
To generate enough momentum for such a move, it is important that sufficient accumulation takes place around HA-Low.
However, individual traders have no reliable way of knowing the actual amount of accumulation taking place in the market.
Therefore, what we can do is gradually increase our holdings in potential accumulation zones while continuing to protect our trading capital.
This is where the following strategy becomes important:
▶ "Buy → Sell → Re-buy"
Instead of continuously buying without taking profits, the idea is to use market volatility to recover capital while gradually increasing the amount of coins you hold.
━━━━━━━━━━━━━━━━━━━━━━━━━━━━━━━━━━
■ Increasing Holdings While Recovering Capital
For example, after buying at a certain price, if the market moves higher, you can sell approximately 50% of the amount invested in that entry to recover part of your capital.
By repeating this process, you can maintain liquidity for future buying opportunities.
If available trading capital begins to run low, you can sell enough of a profitable position to recover the original capital allocated to that entry.
This allows you to recover your principal while keeping the remaining coins as profit.
The most conservative version of this strategy is:
▶ Recover 100% of the original capital after price rises
At first, this may appear to leave you with too few coins.
However, the final number of coins accumulated can vary significantly depending on how much market volatility you are able to trade and how many successful trading cycles you complete.
If volatility is low, the amount accumulated will naturally be smaller.
If volatility is high, effective short-term trading may provide more opportunities to increase your remaining holdings.
Therefore, during an accumulation phase, the objective should not simply be to "buy cheap."
The following four elements should be considered together:
▶ Protect trading capital
▶ Recover principal
▶ Maintain capital for re-entry
▶ Gradually increase coin holdings
━━━━━━━━━━━━━━━━━━━━━━━━━━━━━━━━━━
■ SOL's Current Short-Term Structure
SOL is currently maintaining bullish momentum after moving above the StochRSI 80 level.
However, the Stochastic RSI indicator itself is currently in the overbought zone.
This means that upside momentum may eventually face some resistance or temporary limitations.
Therefore, as Stochastic RSI resets from the overbought region, it will be important to monitor whether price can maintain support around the StochRSI 80 price level.
If price continues to hold around the StochRSI 80 level while the indicator resets, the current bullish structure is more likely to remain intact.
In that case, the next key zone to watch is:
▶ 82.79 ~ 86.71
If price fails to establish support, the correction could extend toward:
▶ 68.20
During such a decline, price action around the StochRSI 20 level should be monitored closely to determine whether partial selling is necessary.
━━━━━━━━━━━━━━━━━━━━━━━━━━━━━━━━━━
■ SOL's Key Upside Breakout Zone
If SOL continues higher, the first major area to watch is:
▶ 1W Key Zone: 82.79 ~ 86.71
The 1W HA-Low is currently located around 86.71.
Therefore, simply breaking above this zone is not enough.
The key is whether SOL can break above the 82.79 ~ 86.71 zone and successfully convert it into support.
Above this area, the 1D HA-High is currently located around:
▶ 92.83
Since HA-High represents a potential high-price zone, traders should prioritize protecting profits around 92.83 rather than simply expecting further upside.
Partial profit-taking should therefore be considered as price approaches this level.
This means SOL's major upside decision zone can currently be defined as:
▶ 82.79 ~ 92.83
If SOL breaks through this entire zone and successfully establishes support above it, selling pressure may be absorbed and bullish momentum could strengthen significantly.
Under those conditions, the probability of SOL developing a much stronger bullish trend would increase.
━━━━━━━━━━━━━━━━━━━━━━━━━━━━━━━━━━
■ Key Levels Summary
▶ Major Medium-/Long-Term Support & Resistance:
58.38 ~ 68.20
▶ 1W Key Zone:
82.79 ~ 86.71
▶ 1W HA-Low:
86.71
▶ 1D HA-High:
92.83
▶ Major Upside Decision Zone:
82.79 ~ 92.83
The most important factor for SOL right now is not simply whether price moves higher.
SOL needs to build enough momentum to move above 82.79 and successfully convert the 82.79 ~ 86.71 zone into support.
If price then approaches 92.83, protecting profits should come first while monitoring whether the 1D HA-High can be broken and converted into support.
Ultimately, the core principle remains simple:
"Look for opportunities to accumulate around HA-Low,
and protect profits around HA-High."
Maintaining this principle while taking advantage of market volatility is the key to managing both opportunity and risk.
━━━━━━━━━━━━━━━━━━━━━━━━━━━━━━━━━━
Thank you for reading.
Wishing you successful trading.
Solana Eyes $122, Key Support Holds Solana is approaching a major technical inflection point as price trades into a high-confluence support zone around the $70 level.
This region carries significant technical importance, with the Value Area Low (VAL), the 0.618 Fibonacci retracement, and the VWAP all aligning to create a strong foundation for buyers. When multiple technical indicators converge at the same price level, the probability of a meaningful market reaction increases considerably.
As long as Solana continues to hold above this support, the broader technical outlook remains constructive. Buyers defending this region would confirm that demand remains strong despite recent volatility, increasing the likelihood of another impulsive move higher. This support zone could act as the launchpad for the next leg of the trend as traders look for confirmation of renewed bullish momentum.
The primary upside objective sits near the $122 resistance level, which represents the next significant high-timeframe barrier. A sustained move toward this region would reinforce the bullish market structure and signal that Solana has successfully resumed its upward trend after completing a healthy retracement.
For now, the $70 support remains the level to watch. Holding above this confluence keeps the immediate short-term bias bullish and favors continuation toward $122, while a decisive breakdown below support would weaken the current outlook and increase the probability of a deeper corrective move.