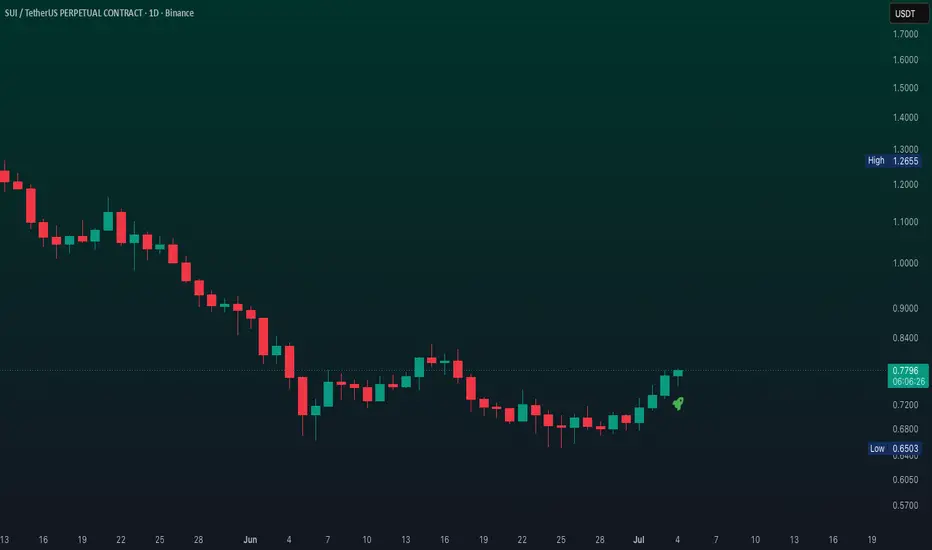
Sui looks bearish to you? A new all-time highI know many people consider this chart bearish. Why many people think Sui is bearish now?
January 2025. Does it look bearish or bullish? This was the peak of a bullish wave and all-time high. Needless to say, it was the start of a bearish cycle.
June 2026. Does it look bearish or bullish? This is the bottom of a bearish wave but also a long-term higher low. This is something I want to show you.
We have a 300 days long higher low. Current price zone and range vs October 2025, 300 days. Then we have another higher low long long-term, vs August 2024.
This is a great project, a great chart; soon we are going up.
Sui, Bitcoin, Cardano & Ethereum. Ethereum Classic, Avalanche, Solana, XRP & Toncoin (GRAM).
Thank you for reading.
I am ready to get started. Are you done with the summer?
The altcoins market is about to heat up. We are right in front of a massive bullish wave, one that has been months in the making.
The bottom is in on SUIUSDT. A two years long higher low, August 2026 vs August 2024, will lead to massive growth. A new all-time high.
Namaste.
In-depth trading ideas
$SUI Whales are accumulatingBYBIT:SUIUSDT.P
CRYPTOCAP:SUI Whales are accumulating
While the market watches the leaders, quiet accumulation is happening in $SUI. 🐋WhaleMAX (large whale positions) is building a base in the 📊M-Levels (Institutional Interest Levels) zone, ignoring short-term noise.
🧩 IMA confirms synchronization: mid and large capital are entering simultaneously while retail activity remains low. Classic pre-impulse phase — the crowd will join later, at the highs.
Strategy is simple: use dips for stop hunts as entry points, not reasons to panic.
Trade setup:
🟢 Entry 1: $0.7065 (current)
🟢 Entry 2: $0.6145 (on dip for add)
🔴 Stop: $0.5258 (beyond liquidity zone)
🎯 TP 1: $0.9080
🎯 TP 2: $1.2945 → trail by support
📌 Principle: price moves where capital is, not where eyes are.
Analysis from me — execution from you 🚀
Analysis powered by IMA (Integrated Market Analysis)
⚠️ Platform restrictions limit the publication of closed indicators. I display only the output of the 📊Levels algorithm.
$SUI: 3 Order Blocks, 1 Verdict — Mapping the Path to $5!BINANCE:SUIUSDT is quietly building one of the most talked-about fundamental stories in crypto right now — but the charts are telling a completely different tale. No major support in sight... except one. Here's exactly how this plays out. 👇
💡 The Fundamental Story
SUI has been buzzing lately thanks to its stablecoin-funded buyback programme, which has already scooped up approximately 317,500 SUI. Unlike typical buyback models, these tokens aren't burned — they're reinvested straight back into the ecosystem.
Strong fundamental narrative. But technicals? A completely different story.
📉 The Technical Setup
Right now, SUI isn't sitting on any major buying zone across any timeframe. The only real zone that can hold this move is the Monthly Buying Order Block ($0.3580 – $0.5064).
But price never travels in a straight line to a target zone — it needs liquidity, and it needs to hunt stops first. Here's the sequence to watch:
Step 1: Daily Selling Order Block
📍 $0.7530 – $0.7803
This is the first likely reaction zone on the way down.
Step 2: Weekly & Monthly FVG
📍 $0.8264 – $0.8509
If the daily zone fails to hold price down, this is the next sell zone — with targets pointing all the way to the Monthly Buying Order Block.
Step 3: The Bullish Case
If BOTH the daily and weekly zones fail to reject price... SUI is ready to blast to the upside. 🚀 That failure is your bullish confirmation.
🎯 What To Do At The Monthly OB
If price does reach the Monthly Buying Order Block, don't buy blindly. Wait for:
A clear displacement out of the zone
A refined last POI (point of interest)
Then execute your entry
📌 Bottom Line
Every scenario is mapped. Every zone is marked. Now it's up to price to reveal its hand.
Not financial advice. Always manage your risk.
#CryptoAnalysis #TradingView #SMC #OrderBlocks
#SUIUSDT – Bullish Triangle Breakout Confirmed | Resistance#SUI
The price is moving within a descending channel on the 1-hour timeframe and has reached the lower boundary. It is now poised for a bounce and is expected to retest this boundary.
The Relative Strength Index (RSI) indicates a downward trend, which is likely to continue due to overbought conditions.
A key support zone has been identified in green at 0.6548. The price has bounced off this zone several times, making it a strong support level.
The price is trending towards the 100-period moving average, which we are approaching. This trend supports an upward move.
Entry Price: 0.6868
Target 1: 0.6979
Target 2: 0.7097
Target 3: 0.7238
You can close at the second target or wait for the third target to be reached. The choice is yours.
Stop Loss: At the resistance zone in green.
Remember this simple rule: Money Management.
Any questions? Please leave a comment.
Thank you.
#SUIUSDT – Bullish Triangle Breakout Confirmed | Resistance#SUI
The price is moving within a descending channel on the 1-hour timeframe and has reached the lower boundary. It is now poised for a bounce and is expected to retest this boundary.
The Relative Strength Index (RSI) indicates a downward trend, which is likely to continue given the overbought conditions.
There is a key support zone in green at 0.6400, and the price has bounced off this zone several times, making it a strong support level.
The price is trending towards the 100-period moving average, which we are approaching. This trend supports an upward move.
Entry Price: 0.6800
Target 1: 0.6857
Target 2: 0.6957
Target 3: 0.7088
Stop Loss: At the resistance zone in green
Remember this simple rule: Money management.
Any questions? Please leave a comment.
Thank you.
suusdt longInstructions:
Entry point: yellow
Stop loss: red
Take profit: green
👉Leverage x 5-10-20 for crypto
👉Leverage x 20-50-100 for commodities, stocks, indices, and forex
👉Margin 1-5% max.
Always practice risk and money management.
Invest a maximum of 5% on any trade or across all your trades.
Invest only what you can afford to lose, as no one is in control of the market.
👉Our analyses are primarily based on:
breakouts: two trend lines (ascending and descending) and a line indicating a horizontal breakout.
chart patterns: shoulders and head, triangle parttern, elliott impulse, etc etc.
We don't always have the time to track them at all times or to represent them visibly, given the numerous signals, the number of channels to manage, and especially because of the often rapid pace of market movements.
indicators: We associate at least two indicators with this technique.
👉Depending on the circumstances, we use specific indicators, often setting 3 or more take profit levels.
👉Indeed, there are good days in trading and also bad days. No one can promise to win every trade, and like all traders worldwide, we also experience stop-loss orders. However, we win more than we lose and remain positive.
👉You can close the position before or after the take profit orders indicated by the green lines if you are personally satisfied; the same applies to stop loss orders.
👉We must stay positive, clear-headed, and humble.
we cannot provide all instructions or all trades here on this channel.
Good luck to us all, and may God guide us. Amen.
SUIUSDT - Critical Support Test, Breakdown or Strong Reversal?📊 Technical Analysis
💵 Coin: CRYPTOCAP:SUI #SUI
⏳ Time Frame: 1D
📉 Pattern: Ascending Triangle (Support Test) / Distribution Structure
🎯 Target: 10%+ (Depending on breakout direction)
---
📌 Pattern Overview
SUI is currently trading inside an Ascending Triangle structure with:
🔴 Ascending Support (Red Trendline) acting as dynamic support.
🟡 Horizontal Resistance Zone (Yellow Area) repeatedly rejecting bullish attempts.
📉 Multiple rejections from the resistance indicate that buyers are struggling to regain control.
⚠️ Price has now returned to the ascending support, making this area the most important decision zone.
As long as price remains trapped inside this pattern, traders should anticipate a significant move once either side is broken.
---
🟢 Bullish Scenario (Support Holds)
✅ If buyers successfully defend the ascending support and volume increases:
🚀 Price could rebound toward the upper resistance zone.
📈 A confirmed breakout above the yellow resistance area would invalidate the current bearish pressure.
🎯 The breakout could trigger a continuation rally with momentum toward higher resistance levels.
💪 Increasing buying volume would strengthen the bullish confirmation.
Bullish Confirmation:
✅ Daily candle closes above the resistance zone.
✅ Strong buying volume accompanies the breakout.
✅ Previous resistance flips into new support.
---
🔴 Bearish Scenario (Higher Probability)
⚠️ The current structure appears to favor bears as price continues making lower highs while repeatedly failing to break resistance.
If the ascending support is broken:
📉 The Ascending Triangle would fail.
🚨 Selling pressure could accelerate rapidly.
🎯 Price may decline toward the next major support zone around $0.55–$0.53, as illustrated by the projected downside arrow.
❌ A daily candle closing below support would significantly strengthen the bearish outlook.
Bearish Confirmation:
🔻 Daily candle closes below the ascending support.
📊 Breakdown is supported by high selling volume.
📉 Failed retest of broken support as new resistance.
---
⚖️ Market Structure
🐻 The overall trend remains bearish since the previous strong decline.
📉 Resistance continues to reject every recovery attempt.
⚠️ Buyers are still unable to establish a convincing higher high.
🔥 The next breakout or breakdown is likely to determine SUI's medium-term direction.
---
📍 Key Levels to Watch
🟡 Resistance Zone: Yellow highlighted area.
🔴 Critical Support: Ascending red trendline.
⚠️ A decisive move outside this range will likely define the next major trend.
---
📊 Probability
🔴 Bearish: 70%
🟢 Bullish: 30%
> Disclaimer: This analysis reflects the current chart structure and is not financial advice. Always wait for confirmation before making trading decisions.
---
#SUI #SUIUSDT #Crypto #Cryptocurrency #Altcoin #Trading #TradingView #TechnicalAnalysis #ChartAnalysis #PriceAction #Support #Resistance #AscendingTriangle #Bearish #Bullish #Binance #CryptoTrading #MarketAnalysis #SwingTrading #CryptoSignals
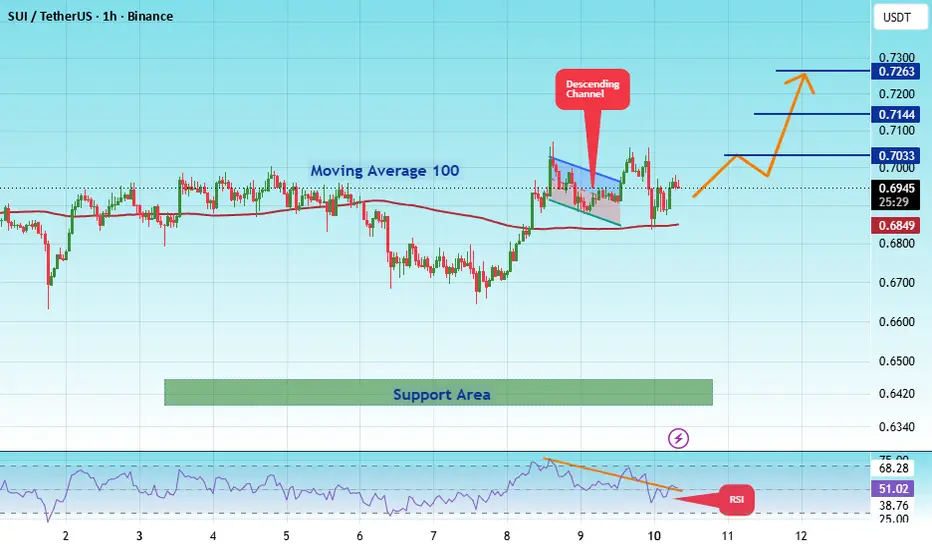
#SUIUSDT – Bullish Triangle Breakout Confirmed | Resistance#SUI
The price is moving within a descending channel on the 1-hour timeframe and has reached the lower boundary. It is now poised for a bounce and is expected to retest this boundary.
The Relative Strength Index (RSI) indicates a downward trend, which is likely to continue given the overbought conditions.
There is a key support zone in green at 0.6393, and the price has bounced off this zone several times, making it a strong support level.
The price is trending towards the 100-period moving average, which we are approaching. This trend supports an upward move.
Entry Price: 0.6948
Target 1: 0.7033
Target 2: 0.7144
Target 3: 0.7263
Stop Loss: At the resistance zone in green
Remember this simple rule: Money Management.
Any questions? Please leave a comment.
Thank you.
SUI 4H – Symmetrical Triangle Breakdown Test at Lower BoundarySUI on the 4H timeframe is currently trading around 0.8088 after breaking sharply below the range that held through most of July and pressing into the lower boundary of the symmetrical triangle near 0.6740–0.6750, with price now attempting a recovery from that level after the sharpest decline seen inside the structure.
The chart shows a symmetrical triangle formed by a descending upper trendline originating from the June 15 high near 0.8200, connecting through the July 5 high near 0.7840 and the July 22 high near 0.7780, while the rising lower trendline connects the June 25 low near 0.6510 through the July 29 low near 0.6740–0.6750 where price has just bounced. Price ranged through the mid-section of the triangle from late June through late July, establishing two horizontal reference levels in the process — one near 0.6880–0.6900 which has acted as a consistent floor through the range, and a second near 0.6800–0.6820 just below it. The sharp selloff from the July 22 high near 0.7780 cut through both horizontal levels and drove price directly into the rising lower trendline in a single sustained move, producing a bounce off the trendline near 0.6740–0.6750.
The rising lower trendline has now been tested twice, first at the June 25 origin and now at the July 29 low, with the current bounce off that level being the most critical given the velocity of the decline that produced it.
Key Levels To Watch
→ 0.8100–0.8200 Prior high, major resistance above
→ 0.7750–0.7800 Prior recovery high, descending trendline zone
→ 0.7400–0.7500 Mid-range resistance zone
→ 0.7100–0.7200 Minor resistance, upper range reference
→ 0.6880–0.6900 Broken horizontal support, now resistance
→ 0.6800–0.6820 Secondary broken support, now resistance
→ 0.6740–0.6750 Rising lower trendline, current bounce zone
→ Below 0.6510 Triangle breakdown, extended downside
A hold at the rising lower trendline near 0.6740–0.6750 and a recovery back above 0.6880–0.6900 would keep the triangle structure intact and open a move back toward the mid-range zone near 0.7100–0.7200 and potentially the descending upper trendline above.
A confirmed 4H close below the rising lower trendline near 0.6740 would signal a bearish resolution out of the triangle, removing the upward structure from the June 25 low and opening downside toward 0.6510 and below with no clear support in between.
Sharpest decline inside the triangle now pressing into lower boundary for second time. Hold 0.6740–0.6750 → triangle intact, recovery open toward 0.6880–0.7200. Lose trendline on confirmed close → bearish resolution, downside toward 0.6510 and below. Bias neutral to cautiously bullish at lower boundary. Shift bearish only on confirmed close below 0.6740–0.6750.
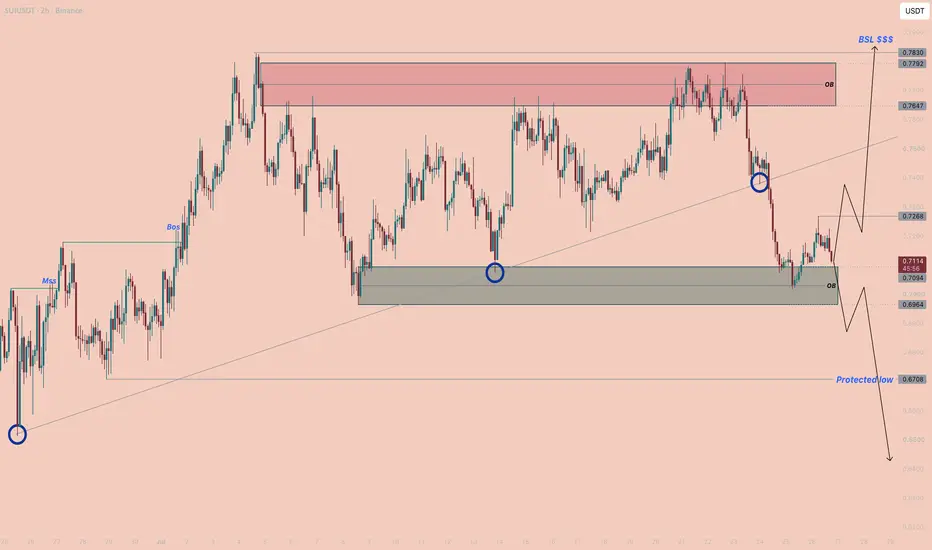
SUI | Order Block Decision — The Break Decides The Direction!By analyzing the #SUI chart on the 2H timeframe, we can see that price has arrived at a genuine decision point. The broader trend is bullish, but the latest drop has left price balancing on a key Order Block — and the next break decides whether the uptrend resumes or a deeper flush begins. Let's break it down.
📊 2H Timeframe
On the 2H, the trend turned up with a Market Structure Shift (MSS), then confirmed with a BOS to the upside. That established a Protected Low at $0.6708 — the structural line that price must hold to keep the bullish thesis alive.
More recently, price had been ranging sideways before dropping sharply out of the upper Order Block ( $0.7647 – $0.7792 ) — a clean rejection from supply. That drop has now landed price onto the lower Order Block ( $0.6964 – $0.7094 ), which should act as demand. But there's a complication worth being honest about: on the way down, price also broke the rising trendline — so we have a bullish OB reaction fighting a broken uptrend at the same time. Price is currently trading around $0.7114 .
🎯 The Bias
Two scenarios are on the table, and I'm waiting for confirmation rather than forcing a side:
Scenario A — Bullish (OB holds): if price reacts up from the current Order Block and breaks $0.7268 , that confirms buyers have reclaimed control — opening the path higher to target the buy-side liquidity (BSL) resting overhead at $0.7830 .
Scenario B — Bearish (OB fails): if instead price breaks the Order Block and holds firmly below it, that invalidates the demand — and price likely drops to hunt the sell-side liquidity below, and the pools beneath it.
In my view, the trend still favours the bulls as long as the Protected Low ($0.6708) holds — but the broken trendline means I want the $0.7268 break to confirm before trusting the upside. Until one side breaks, this is a level to watch, not chase.
📰 Fundamental Backdrop
The technical indecision mirrors a market where SUI's strong fundamentals haven't yet translated into price momentum. The Sui network has continued to build out its ecosystem — expanding DeFi activity, developer traction, and institutional interest around its high-throughput, object-based architecture — but like most alts, the token remains highly sensitive to Bitcoin's lead and the broader risk tone rather than trading purely on its own catalysts. That's exactly why the chart is coiling at this Order Block: participants are waiting for a directional cue. The two-sided setup reflects the two-sided backdrop — genuine on-chain growth and adoption underpinning the bullish case, against a still-cautious macro-crypto environment that keeps a deeper liquidity grab firmly in play. As always with high-beta alts, a broad-market risk-off move could override the bullish setup, which is why the Protected Low ($0.6708) is the level that keeps this idea valid.
This analysis will be updated as the market evolves. If this breakdown added value, drop a like 👍 and a comment 💬 to support the work — and share where you see SUI heading next! Best Regards, BigBeluga 🐳
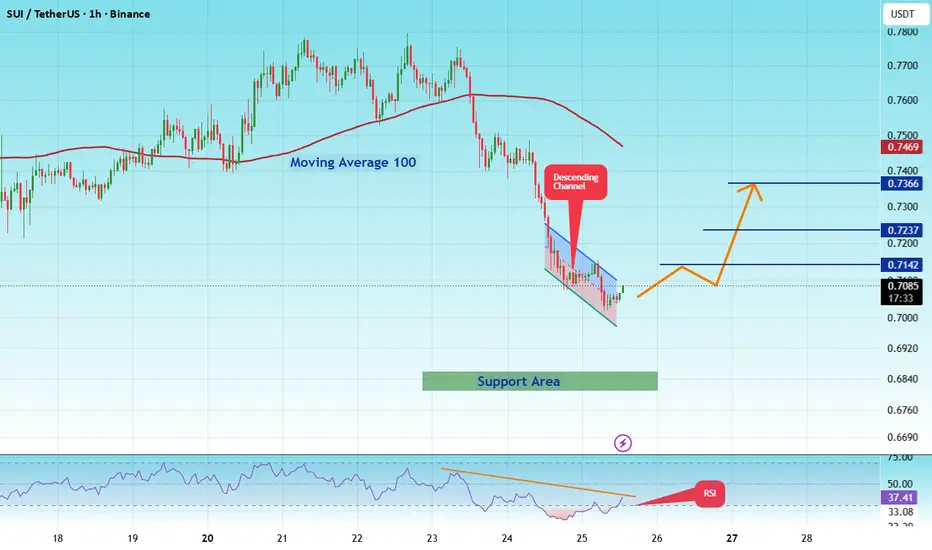
#SUIUSDT – Bullish Triangle Breakout Confirmed | Resistance#SUI
The price is moving within a descending channel on the 1-hour timeframe and has reached the lower boundary. It is now poised for a bounce and is expected to retest this boundary.
The Relative Strength Index (RSI) indicates a downward trend, which is likely to continue given the overbought conditions.
A key support zone has been identified in green at 0.6820. The price has bounced off this zone several times, making it a strong support level.
The price is trending towards the 100-period moving average, which we are approaching. This trend supports an upward move.
Entry Price: 0.7082
First Target: 0.7142
Second Target: 0.7237
Third Target: 0.7366
You can close at the second target or wait for the third target to be reached. The choice is yours.
Stop Loss: At the resistance zone in green.
Remember this simple rule: Money Management.
Any questions? Please leave a comment.
Thank you.
SUI: The ETF turning point is capturing everyone's attention.SUI, the native token of the Sui blockchain network, is currently trading around $0.7117 as investors monitor a key support zone near the $0.695–$0.704 range. Investors are watching closely to see if buyers can hold this level following a sharp decline from $0.77 earlier in the week.
ETF launches and staking activity are boosting SUI's market presence.
+ In a significant development for the token, two Canary Capital ETFs launched SUIS on Nasdaq, while Grayscale introduced GSUI on NYSE Arca, offering institutional investors and traders regulated access to SUI. SUIS also provides holders with staking income benefits.
+ Coinbase, the largest US-based cryptocurrency exchange, has also enabled users to stake SUI directly, allowing them to earn rewards for holding the token. Despite these advancements, SUI has recorded a decline of approximately 5% over the past 24 hours amidst a broader market downturn.
+ Data from Coinglass indicates robust activity in the SUI derivatives market, with open interest figures of $48.68 million and $53.25 million across leading platforms, reflecting a difference of $4.57 million. Traders are closely monitoring support levels, ETF demand, staking inflows, and futures trading activity, all of which could influence short-term price movements.
Key support lies around the $0.66 level, while resistance is situated near $0.82. The technical outlook suggests SUI is balancing between short-term downside risk and the potential for a rapid recovery should momentum shift upward. The current zone is considered pivotal for the asset's price trajectory.
Outlook:
+ Bullish scenario: A close above $0.722 would reinforce the bullish outlook and potentially trigger a rally toward $0.78.
+ Bearish scenario: If SUI closes below $0.695, the next support levels are $0.673 and subsequently $0.659. Prolonged weakness could test the broader support zone between $0.60 and $0.75.
Through Bitget's UEX platform, traders can buy or sell SUIUSDT using a single Bitget account.
SUI 6H – Rising Channel Pullback Into Trendline Support AgainSUI on the 6H timeframe is currently trading around 0.7480 after pulling back from the upper channel boundary near 0.7780–0.7800 on July 21, with the rising lower trendline now climbing into the 0.7300–0.7350 area and price consolidating just above the 0.7480–0.7500 horizontal pivot following the most recent bounce off that level.
The chart shows the same rising parallel channel covered in prior ideas, with the lower trendline connecting the late June low near 0.6500 through the July 8 low near 0.6990, the July 14 low near 0.7100, and the July 17 low near 0.7200, while the upper trendline has capped the July 4 high near 0.7780 and the July 21 high near 0.7780–0.7800. Price has now made three clean oscillations inside the channel, each time bouncing from the lower boundary and pushing back toward the upper boundary before pulling back. Two horizontal reference levels have defined the internal structure throughout — one near 0.7600–0.7650 which has acted as the upper pivot, and a second near 0.7480–0.7500 which has been a consistent floor during pullbacks inside the channel. The current candle shows price sitting directly at the 0.7480–0.7500 level after pulling back from the upper boundary, with the lower trendline rising into 0.7300–0.7350 below.
The pattern of three clean bounces from the rising lower trendline with each producing a push back toward the upper boundary remains intact, and the 0.7480–0.7500 horizontal is now the key level between a continuation of that pattern and a deeper pullback toward the trendline.
Key Levels To Watch
→ 0.7780–0.7800 – Upper channel boundary, resistance (dynamic)
→ 0.7600–0.7650 – Horizontal resistance, upper internal pivot
→ 0.7480–0.7500 – Horizontal support, current test
→ 0.7380–0.7400 – Minor support, mid-channel reference
→ 0.7300–0.7350 – Rising lower trendline, dynamic support (climbing)
→ 0.7100–0.7200 – Prior trendline touches, secondary support
→ Below 0.6990 – Channel breakdown, bullish structure invalidated
A hold above 0.7480–0.7500 and a push back toward 0.7600–0.7650 and then the upper channel boundary near 0.7780–0.7800 would confirm the fourth oscillation inside the channel and keep the bullish structure fully intact.
A loss of 0.7480–0.7500 and a pullback toward the rising lower trendline near 0.7300–0.7350 would be a normal channel retest, but a confirmed 6H close below the trendline would break the structure that has held every low since late June and open downside toward 0.6990 and below.
Three clean channel oscillations completed, price pulling back from upper boundary into horizontal pivot. Hold 0.7480–0.7500 → fourth push toward upper boundary near 0.7780–0.7800. Lose pivot and trendline near 0.7300 → channel structure broken, downside toward 0.6990. Bias bullish inside rising channel. Shift only on confirmed close below rising lower trendline.
SUI: local squeeze with $0.9013 destinationThe Macro Picture 🗺️
SUI unwound from the $1.4140 macro ceiling and has spent the summer basing, reclaiming $0.7725 while holding above the $0.7459 local low. Price is rotating in the lower half of the range with the floor intact — a base rebuilding, not a breakdown.
The Setup ⚙️
The Range Floor 🟢
$0.7459 (Local Low) is the demand shelf, with $0.6503 (Macro Support) as the deeper backstop. Both have held, and that's the floor this range pivots on.
The Decision Point 🔴
$0.8897 (Local High) is the gate. A daily close above it flips the local structure bullish and opens the path to the $0.9013 measured-move target.
The Roadmap 🛣️
Hold above $0.7459 → break $0.8897 → run toward $0.9013. Invalidation is a clean daily close below $0.6503 — that breaks the range.
This is a GRID Range Play: a defined band to rotate, buying the lower half and scaling out into the breakout.
More setups in profile.
#SUI #crypto #trading #TA #3Commas #GRID
suiusdt long Roddy01-SIGNALSPROVIDERInstructions:
Entry point: yellow
Stop loss: red
Take profit: green
👉Leverage x 5-10-20 for crypto
👉Leverage x 20-50-100 for commodities, stocks, indices, and forex
👉Margin 1-5% max.
Always practice risk and money management.
Invest a maximum of 5% on any trade or across all your trades.
Invest only what you can afford to lose, as no one is in control of the market.
👉Our analyses are primarily based on:
breakouts: two trend lines (ascending and descending) and a line indicating a horizontal breakout.
chart patterns: shoulders and head, triangle parttern, elliott impulse, etc etc.
We don't always have the time to track them at all times or to represent them visibly, given the numerous signals, the number of channels to manage, and especially because of the often rapid pace of market movements.
indicators: We associate at least two indicators with this technique.
👉Depending on the circumstances, we use specific indicators, often setting 3 or more take profit levels.
👉Indeed, there are good days in trading and also bad days. No one can promise to win every trade, and like all traders worldwide, we also experience stop-loss orders. However, we win more than we lose and remain positive.
👉You can close the position before or after the take profit orders indicated by the green lines if you are personally satisfied; the same applies to stop loss orders.
👉We must stay positive, clear-headed, and humble.
we cannot provide all instructions or all trades here on this channel.
Good luck to us all, and may God guide us. Amen.
$SUI is still holding its support zone, which is a good sign. EvCRYPTOCAP:SUI is still holding its support zone, which is a good sign. Even after the recent pullbacks, buyers haven't let the price lose this area.
Right now, the biggest challenge is the 50 EMA, with the 99 EMA just above it. If SUI can push through both and hold a daily close above them, it could be the start of a much stronger recovery.
For now, nothing has changed. As long as support holds, the setup remains bullish. The next step is reclaiming the EMAs and turning them back into support.
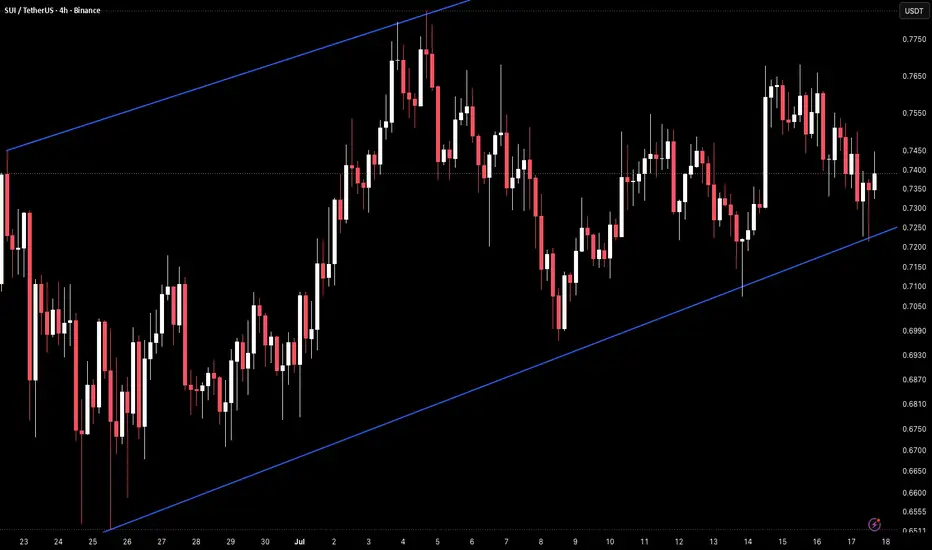
SUI 4H – Rising Channel Holding at Horizontal PivotSUI on the 4H timeframe is currently trading around 0.7385 after pulling back from the upper channel boundary near 0.7750–0.7800 and finding support at the rising lower trendline near 0.7100–0.7200, with price now back at the 0.7380–0.7400 horizontal pivot that has defined the midline of the structure throughout the channel.
The chart shows a rising parallel channel originating from the late June low near 0.6510, with the lower trendline connecting the June 25 bottom through the July 8 low near 0.6990 and the July 14 low near 0.7100, while the upper trendline has capped the July 4 high near 0.7750–0.7800 and the July 15 high near 0.7650–0.7700. Price has made two full oscillations inside the channel, pushing from the lower boundary to the upper boundary and back twice. The horizontal level near 0.7380–0.7400 has acted as the central pivot throughout, with price repeatedly crossing through it in both directions. The most recent pullback from the upper boundary brought price back to the lower trendline near 0.7100 on July 14 before bouncing, and the current candle is now back at the 0.7380–0.7400 pivot with the upper boundary near 0.7650–0.7700 as the next target if the level holds.
The rising lower trendline has now been tested three times without a breakdown, each time producing a recovery back toward the upper boundary, keeping the bullish channel structure fully intact.
Key Levels To Watch
→ 0.7750–0.7800 – Upper channel boundary, major resistance (dynamic)
→ 0.7650–0.7700 – Prior upper boundary touch, resistance
→ 0.7500–0.7550 – Mid-upper channel zone, resistance
→ 0.7380–0.7400 – Horizontal pivot, current price zone
→ 0.7200–0.7250 – Mid-lower channel zone, support
→ 0.7100–0.7150 – Rising lower trendline, dynamic support (climbing)
→ Below 0.6990 – Channel breakdown, bullish structure invalidated
A hold above the 0.7380–0.7400 horizontal pivot and a push toward the upper channel boundary near 0.7650–0.7700 would continue the established pattern of channel oscillations and keep the bullish structure intact, with 0.7750–0.7800 as the full upper boundary target.
A loss of the 0.7380–0.7400 pivot and a return toward the rising lower trendline near 0.7100–0.7150 would be the fourth trendline test, and a confirmed close below it would break the channel structure that has held since late June, opening downside toward 0.6990 and below.
Third trendline hold produced bounce back to horizontal pivot, channel pattern consistent. Hold
0.7380–0.7400 → upper boundary near 0.7650–0.7800 back in play. Lose pivot and trendline near 0.7100 → channel structure broken, downside toward 0.6990. Bias bullish inside rising channel. Shift only on confirmed close below rising lower trendline.
SUI SOMETHING BIG LOADINGCRYPTOCAP:SUI just put stablecoins into one of Africa's largest payment networks.
The Paga deal, announced July 1. Tokenized real-world assets and blockchain payments for millions of users across the continent.
Same day, Huge SUI unlocked. Huge fresh supply hit the market.
And the price? Still Up. SUI reclaimed $0.75 while leading the biggest unlock wave in crypto.
New demand is absorbing new supply.
Adoption on one side. Dilution on the other.
Right now, adoption is winning.
Confidential and free transfers are coming to SUI and people underestimate the significance of this
We expect to see many autonomous agents deploying capital on the SUI blockchain to transfer freely
The team behind SUI isn't one you should underestimate. They have been building Libra within Facebook. Some of them have been building multiple applications you use on a day-to-day basis
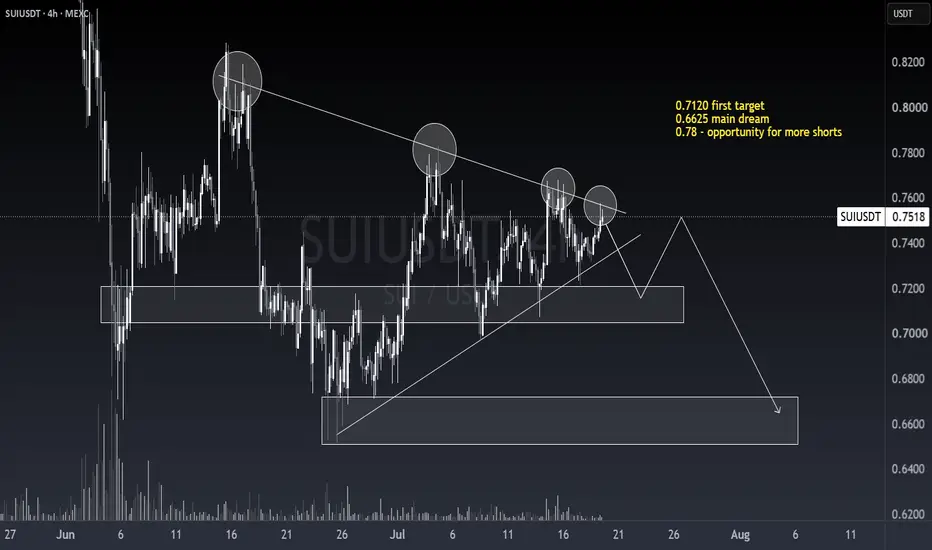
SUI Scalping Trade SELL one Short from $0.7340SUI Scalping Trade
SELL one
Short from $0.7340
Currently $0.7340
Targeting $0.7220 or Down
(Trading plan IF SUI
go up to $0.76 will add more shorts)
Follow the notes for updates
In the event of an early exit,
this analysis will be updated.
Its not a Financial advice