TRX Breaks Bullish Flag, Eyes Next Major RallyTRX Breaks Bullish Flag, Eyes Next Major Rally
TRX just broke out of an ascending flag pattern which shows that the bulls are back in the game.
If we look at the left side of the chart, we can see that the price started the upward movement after breaking out of the ascending triangles.
The same
TRX Tron +100% this year, 10x in 3 years (Parabolic, S&P Crypto)Tron is very special, it's the only altcoin that has been pretty much steadily bullish since 2019. As you can see on the chart, this coin is ready for another big, huge pump! I recommend buying TRX immediately because there is a bullish structure (ascending triangle) on the daily chart and fundament
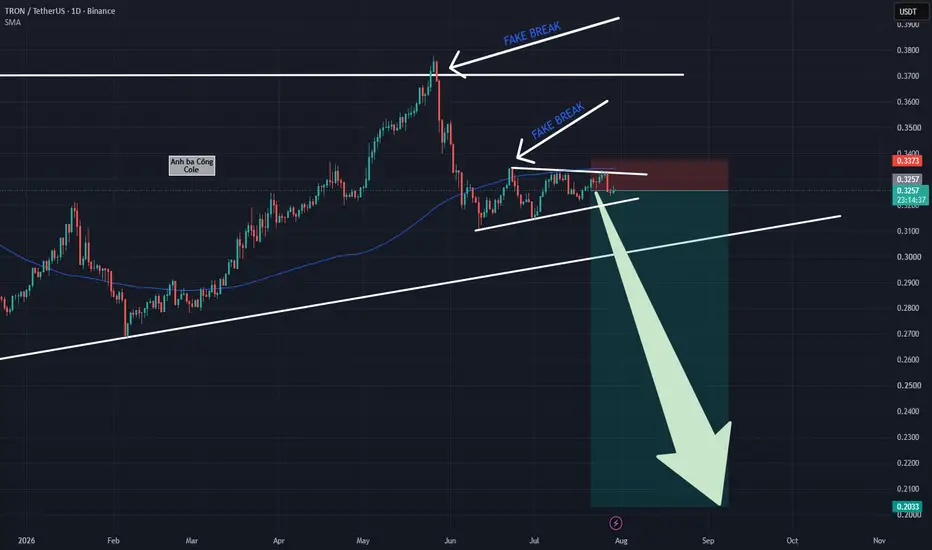
TRX: Sequential Fakebreaks Reconfirm Bearish DominanceTRX: Sequential Fakebreaks Reconfirm Bearish Dominance – Dual Strategic Short Execution Framework
Tron (TRX) is flashing clear signs of technical exhaustion following repeated failures to sustain upward momentum into higher price territories. Despite operating within a long-term ascending triangle
TRX/USDT 4H - Tightening structure, breakout aheadKatsu on the Bridge. Let’s quickly check the TRX radar.
On the TRX 4H chart, we can see a nicely tightening structure. Price is building higher lows, while it has already been rejected several times near the 0.3315-0.3330 resistance zone. This means buyers are gradually pushing price higher, but sel
TRX: Bulls Defending Key SupportPrimary trend remains bullish
TRON continues to outperform much of the crypto market, with the primary trend still pointing higher. Unlike many major altcoins, price remains relatively close to its all-time high after producing a strong recovery from the early-2026 double bottom.
Moving averages
TRX: Sequential Fakebreaks EmergeTRX: Sequential Fakebreaks Emerge – Strategic Short Setup Aligned with Bearish Trend Momentum
TRX is flashing clear technical weakness as bullish expansion attempts repeatedly encounter intense selling pressure at key resistance ceilings. Within its macro framework, the price action continues to co
Two path for TRXMy bot has calculated and displayed the following key support and resistance levels. Taking these levels into account, along with the triangle formation on the chart, where price is compressing against the upper resistance, I assume the odds are 50/50 for a move in either direction. If price breaks
TRON: Consolidation Continues Below Major ResistanceResistance Still Holding Firm
TRON has once again failed to break above the $0.3330-$0.3336 resistance zone, with the latest swing high at $0.3312 marking another rejection. This area has repeatedly capped advances, leaving the bulls with more work to do.
Momentum Has Stalled
The 100/50-Period E
TRON: Bulls Face Another Test at Key ResistancePrimary Trend
TRON continues to outperform much of the altcoin market, with the 100/50-Day EMAs still bullishly crossed. However, both moving averages have begun to flatten and contract, suggesting bullish momentum is starting to slow.
Resistance
Price has once again rallied into the $0.3330-$0.334
Bearish Ascending Triangle pattern for TRXUSDT on Dailywe can see that clearly on Chart that TRXUSDT forming a clear bearish ascending triangle on Basic Chart Pattern Theories.
Lookin for entry if you notice that TRX forming a weak candle, we can sell on weakness. As always use proper money management and Trade Wisely guys. Happy Profit :)
See all ideas
Summarizing what the indicators are suggesting.
Oscillators
Neutral
SellBuy
Strong sellStrong buy
Strong sellSellNeutralBuyStrong buy
Oscillators
Neutral
SellBuy
Strong sellStrong buy
Strong sellSellNeutralBuyStrong buy
Summary
Neutral
SellBuy
Strong sellStrong buy
Strong sellSellNeutralBuyStrong buy
Summary
Neutral
SellBuy
Strong sellStrong buy
Strong sellSellNeutralBuyStrong buy
Summary
Neutral
SellBuy
Strong sellStrong buy
Strong sellSellNeutralBuyStrong buy
Moving Averages
Neutral
SellBuy
Strong sellStrong buy
Strong sellSellNeutralBuyStrong buy
Moving Averages
Neutral
SellBuy
Strong sellStrong buy
Strong sellSellNeutralBuyStrong buy
Displays a symbol's price movements over previous years to identify recurring trends.