UNI USDT LONG SIGNAL#35. UNI/USDT – Trade Setup (LONG)
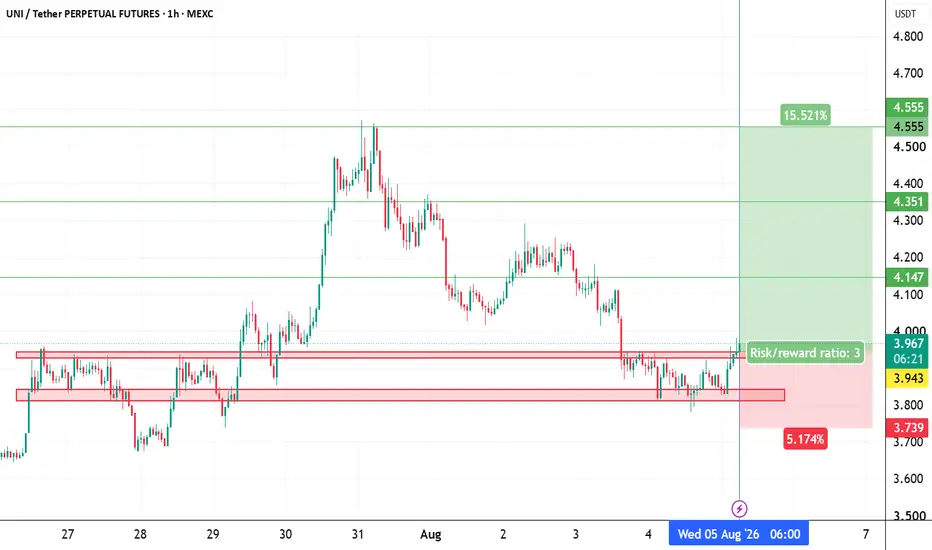
📈 Position Type: LONG
🕒 Timeframe: 1H
📊 Market: Futures
💰 Entry Zone:
4.010
🛑 Stop-Loss:
3.897
🎯 Take-Profit Targets:
• TP1: 4.077
• TP2: 4.190
• TP3: 4.325
• TP4. 4.438
Tp5.
⚙️ Leverage:
5*10
▫️ After TP1, move SL to Entry + 0.2%.
▪️ Exit Plan:
• 40% at TP1
• 20% at TP2
• 20% at TP3
20% at TP4
📌 Risk Management:
Risk only 1–2% of your capital per trade.
⚠️ Always check and confirm the setup on your chart before entering the trade.
In-depth trading ideas
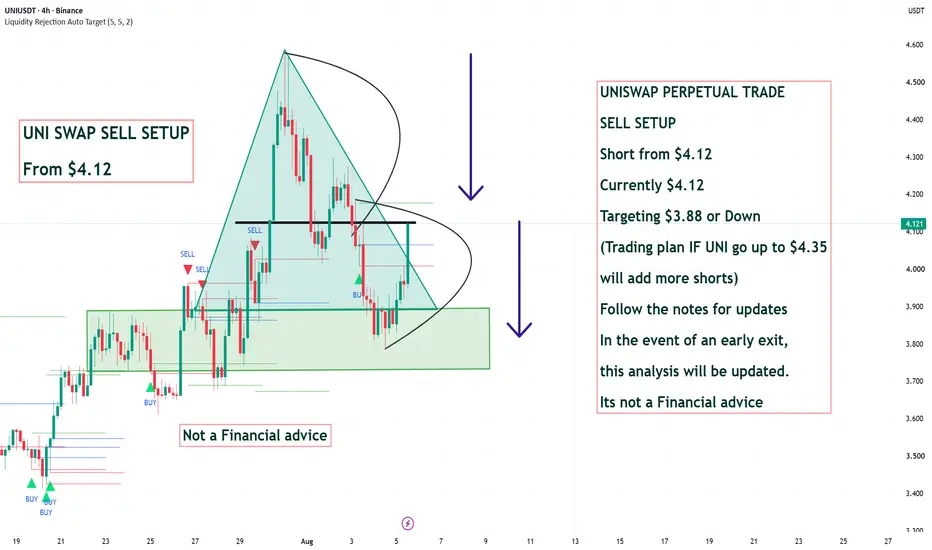
UNISWAP PERPETUAL TRADE SELL SETUP Short from $4.12UNISWAP PERPETUAL TRADE
SELL SETUP
Short from $4.12
Currently $4.12
Targeting $3.88 or Down
(Trading plan IF UNI go up to $4.35
will add more shorts)
Follow the notes for updates
In the event of an early exit,
this analysis will be updated.
Its not a Financial advice
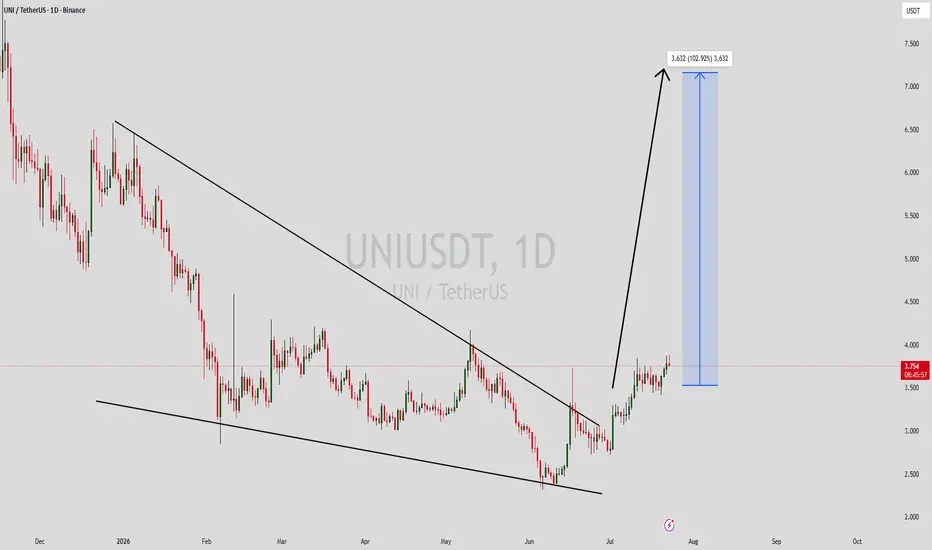
UNI: Huge Descending Wedge, Next +100% Upside!Hello There,
welcome to my analysis about UNI on the 4-hour timeframe perspective. In the past, I have detected interesting formations in the cryptocurrency market with massive potential. One of them being UNI, the coin already completed a pivotal formation, which is setting the path to further upside potential in the upcoming times. In my analysis, I detected all the underlying factors to consider next.
As when looking at my chart, we can see there how UNI completed this gigantic descending wedge formation. The formation has been completed with the breakout above the upper boundary and has since then climbed higher and higher, reaching new levels in the zone. Since the final breakout, UNI has already increased heavily. It is offering the setup for massive expansion and an acceleration towards the upside.
The final breakout already activated the upper target zones as marked in my chart. From the current point of view, UNI still has an upside potential of over 100%. The 100-EMA marked in green marks a strong support from where UNI is building up bullishly, forming the setup for the further bullish continuations. Right now, when bullish volume increases, the bullish trend is likely to accelerate. It will be interesting to see how the final targets will be reached and the momentum moving forward.
In this manner, thank you a lot for watching!
The support is highly appreciated.
VP
UNI Is Trapping Impatient Traders…!Yello Paradisers! is #UNI quietly building the foundation for a powerful bullish move while impatient traders mistake the current structure for weakness? The recent Selling Climax, ultra-high volume, Automatic Rally breakout, shakeout of sell-side liquidity, improving momentum, and clear RSI divergence all suggest that accumulation may be developing beneath the surface. With price still respecting the probability for its bullish structure and holding inside a key demand area.
💎#UNI has recently printed a classic Selling Climax, followed by a Climactic Action candle backed by ultra-high volume. This is a textbook probability that accumulation may be developing. Historically, this type of behaviour often appears when smart money starts positioning before a larger move. To inexperienced traders, it may look like noise. But for experienced traders, this kind of volume reaction carries serious weight.
💎#UNI swept the Selling Climax with an Automatic Rally structure and then aggressively breaking above the Automatic Rally trend-line with strong momentum candle followed with a shakeout test swept sell side liquidity. This is a key probability. It suggests weak hands are being forced out of the market while stronger participants continue accumulating positions with confidence.
💎#UNI has also moved back above the lower trigger line of the Selling Climax with a strong momentum candle adding more confluence for the bullish probability. If the prices sustain this momentum, the next upside path can open toward 4.575, which is currently acting as a major structural resistance level.
💎#UNI continues to respect its ascending support trend-line and momentum gradually shifted toward the bullish side. During the retracement, prices tested the order block zone. A clear RSI divergence is also visible, adding further confirmation to the bullish probability. As long as prices holds momentum inside the order block zone, the structure remains constructive. The first major resistance level to monitor is 4.365. A decisive break and sustained acceptance above this area would strengthen the probability of further continuation toward 4.575.
💎If #UNI fails to hold bullish momentum and a momentum candle closes below 3.740, the current bullish probability becomes invalid. In that case, we could see further downside pressure.
That is why Paradisers, we are playing it safe right now. If you want to be consistently profitable, you need to be extremely patient and always wait only for the best, highest probability trading opportunities only on confirmations.
MyCryptoParadise
iFeel the success🌴
#UNIUSDT Forming Bullish Continuation#UNI
The price is moving within a descending channel on the 1-hour timeframe and has reached the lower boundary. It is now poised for a bounce and is expected to retest this boundary.
The Relative Strength Index (RSI) indicates a downward trend, which is likely to continue given the overbought conditions.
There is a key support zone in green at 3.40, and the price has bounced off this zone several times, making it a strong support level.
The price is trending towards the 100-period moving average, which we are approaching. This trend supports an upward move.
Entry Price: 3.80
Target 1: 4.00
Target 2: 4.17
Target 3: 4.38
Stop Loss: At the resistance zone in green
Remember this simple rule: Money Management.
Any questions, please leave a comment.
Thank you.
uniusdt longInstructions:
Entry point: yellow
Stop loss: red
Take profit: green
👉Leverage x 5-10-20 for crypto
👉Leverage x 20-50-100 for commodities, stocks, indices, and forex
👉Margin 1-5% max.
Always practice risk and money management.
Invest a maximum of 5% on any trade or across all your trades.
Invest only what you can afford to lose, as no one is in control of the market.
👉Our analyses are primarily based on:
breakouts: two trend lines (ascending and descending) and a line indicating a horizontal breakout.
chart patterns: shoulders and head, triangle parttern, elliott impulse, etc etc.
We don't always have the time to track them at all times or to represent them visibly, given the numerous signals, the number of channels to manage, and especially because of the often rapid pace of market movements.
indicators: We associate at least two indicators with this technique.
👉Depending on the circumstances, we use specific indicators, often setting 3 or more take profit levels.
👉Indeed, there are good days in trading and also bad days. No one can promise to win every trade, and like all traders worldwide, we also experience stop-loss orders. However, we win more than we lose and remain positive.
👉You can close the position before or after the take profit orders indicated by the green lines if you are personally satisfied; the same applies to stop loss orders.
👉We must stay positive, clear-headed, and humble.
we cannot provide all instructions or all trades here on this channel.
Good luck to us all, and may God guide us. Amen.
Uni analysis:
The price is currently trading within a falling wedge pattern and is approaching a breakout. A falling wedge is a bullish formation that typically breaks out in the upward direction. We will consider opening long positions once the price moves to $4.000 level. Be sure to monitor the breakout closely.
UNI(Uniswap): The Last Chance to Buy at the Bottom?
Hello, traders.
⭐ If you "Follow" us, you can receive new analysis and market trends quickly.
💰 We wish you successful trading today.
━━━━━━━━━━━━━━━━━━━
🔥 Is UNI preparing to break out of its long-term bottom?
UNI (Uniswap) is a representative DEX (Decentralized Exchange) in the Ethereum ecosystem.
With the DEX market growing steadily recently, it appears that UNI has also entered a position where it can once again attract attention from a long-term perspective.
━━━━━━━━━━━━━━━━━━━━
📈 Key Price Levels Based on Monthly Chart
Looking at the monthly chart, there are two major key zones.
✅ Long-term Accumulation Zone
▶ 2,000 ~ 4,390
✅ Long-term Target Zone
▶ 15,654 ~ 20,561
Therefore, from a mid-to-long-term perspective,
💎 Accumulate in the 2,000 ~ 4,390 range
➡️
🎯 Split selling in the 15,654 ~ 20,561 range
You can consider this strategy.
Currently, UNI is located around 4,390, so the most important factor is whether this price level can turn into a support line.
━━━━━━━━━━━━━━━━━━━━
🎯 Whether $4.390 holds support is key
If the current price settles above 4.390,
✅ Completion of long-term bottom formation
✅ Entry into the initial phase of a trend reversal
✅ Increased possibility of an uptrend cycle starting
In other words,
⚠️ "Support" is more important than a "breakout."
You must confirm whether 4.390 acts as a support line.
Additionally, whether there is an attempt to break out upward of the M-Signal on the monthly chart is also an important checkpoint.
━━━━━━━━━━━━━━━━━━━━
📊 Conditions for Forming an Upward Trend
The following conditions are required for a full-fledged bull market to emerge:
✅ 1. StochRSI
📌 Rise without entering the overbought zone
📌 Maintain a healthy upward trend structure
✅ 2. OBV
📌 Maintain above the High Line
📌 Confirmation of increased trading volume inflow
✅ 3. BSSC
📌 Maintain above the 0 line
📌 Confirmation of buying dominance
Currently, the above conditions are not yet fully met.
Therefore, it is appropriate to interpret the current situation not as
❌ a guaranteed upward zone
but as
✅ a process of creating the conditions for an upward movement
━━━━━━━━━━━━━━━━━━━━
📍 Key Support Zones
🟢 1st Support
▶ 4.190
🟢 2nd Support
▶ 3.687
In particular, the 4.190 level is a very important position that overlaps with
📌 the DOM (-60) on the 1W chart
📌 the mid-term bottom zone
If, during this correction, it falls to around 4.190
and then rebounds as strong buying pressure flows in
🔥 it has the potential to become the last accumulation opportunity at the bottom level
━━━━━━━━━━━━━━━━━━━━
🚀 Final Summary
✅ Whether the 4.390 support line reverses
✅ Whether the 4.190 support level is supported
✅ Attempt to break through the M-Signal on the 1M chart
✅ Satisfaction of StochRSI, OBV, and BSSC conditions
You must focus on verifying these four factors.
If the above conditions are met sequentially, the likelihood of UNI concluding its long-term bottoming phase and establishing a new uptrend increases.
💎 It seems appropriate to view this not as a phase for chasing the highs, but
🔥 as a phase to confirm the possibility of accumulation at the bottom.
━━━━━━━━━━━━━━━━━━━━
💰 Wishing you successful investment and a successful trade.
🚀 To The Moon! 🚀
Uni. USDTUniswap has shown strong growth over the past few days.
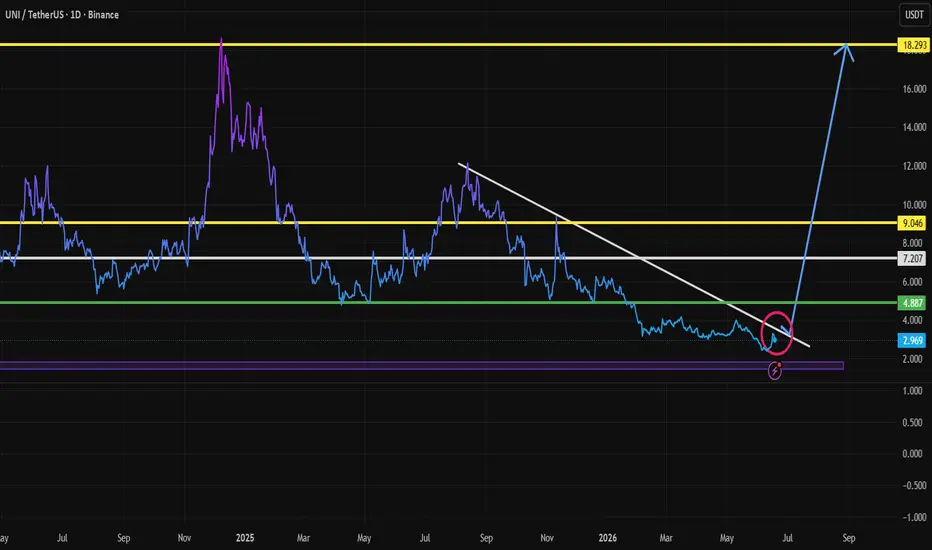
However, it has failed to break above $3.85. if it manages to break this level, the next target would be $4.85, followed by resistance levels at $7 , $9 and $18, respectively.
The fact that some are predicting a $100 price for Uni doesn't correspond to the cryptocurrency's market capitalization.
However, in the long term, this is not out of the question.
UNI BOTTOMED OUT HEREMIL:UNI The fee switch expanded to eight L2s through an executed governance vote, with 98.1% of revenue now reaching holders
Uniswap finally flipped the fee switch in late 2025, burning MIL:UNI from protocol fees, but the impact so far is marginal
MIL:UNI generated $5.6B+ in fees since inception. One of the top DEXs by volume, ever. Solid airdrop. Massive community.
But MIL:UNI still trades ~92% below its ATH, near multi-year lows
If UNI was equity instead of a governance token, I doubt it'd be this cheap
UNI: local squeeze with $4.170 destinationThe Macro Picture 🗺️
UNI staged a strong V-recovery off the June lows near $2.4 all the way back to $3.847 and is now pressing its local high. The trend has flipped from the spring flush to a firm reclaim — buyers in control and driving into the range top.
The Setup ⚙️
The Range Floor 🟢
$3.630 (Local Low) is the near demand shelf holding the recovery, with $2.316 (Macro Support) as the deeper structural base far below. As long as $3.630 holds on pullbacks, the bid stays intact.
The Decision Point 🔴
$4.170 (Local High) is the gate. A daily close above it clears the last local resistance and confirms continuation; it's also the measured-move target for this leg.
The Roadmap 🛣️
Hold above $3.630 → break $4.170 → continuation higher. Invalidation is a clean daily close below $3.630 — that stalls the recovery.
This is a GRID Range Play: a defined band to rotate, buying pullbacks toward the floor and scaling out into the breakout.
#UNI #Uniswap #crypto #trading #TA #3Commas #GRID
UNIUSDT Rectangle BreakoutUNI/USDT Perpetual Contract on the 1D Binance chart is trading within a broad rectangle range, with repeated reactions between 2.819 support and 4.208 resistance.
Current price is around 4.032, just below the upper range boundary. Price recently moved above the resistance zone toward approximately 4.50, then pulled back toward the breakout area.
Breakout confirmation: A strong daily close above 4.208 could confirm a sustained upside breakout. If confirmed, the measured range projection gives an approximate target near 5.60 USDT, representing roughly a 33% move from 4.208.
Breakdown zone: A decisive move below 2.819 could invalidate the range structure and indicate further downside risk. The broader visible swing low is around 2.314 USDT.
For the bullish setup, failure to hold above 4.208 after a breakout would suggest a potential false breakout. Watch for confirmation before considering the pattern valid.
UNIUSDT.P Long Continuation Setup 📈I am already long UNI from lower, but the current structure is giving a potential add or fresh-entry opportunity as price pushes out of a tight intraday triangle.
🧭 Higher-Timeframe Context
On the daily, UNI has been consolidating after its impulse higher and is holding above the key $4.00 area. Price has built a tight, orderly structure rather than immediately giving back the move, which keeps the bias constructive.
The daily AOI sits lower near the $3.82 to $3.91 region, so as long as UNI remains above that demand area, the broader reaccumulation thesis remains intact.
🔺 The Intraday Setup
On the 1-minute chart, UNI compressed into a clean symmetrical triangle with:
Descending resistance from the initial high
Rising support underneath price
Higher lows pressing into the apex
Price holding above the intraday EMA structure
Expansion beginning as price attempts to break free
This is the type of location where a tight stop can be used, but only if the breakout actually accepts above the triangle rather than wicking and fading back into it.
✅ Entry Trigger
The ideal continuation entry is a clean break and hold above the triangle around $4.017 to $4.020, preferably followed by:
A push through HOD near $4.027
Acceptance above PDH at $4.038
A volume-backed retest that holds the former triangle resistance as support
A break without volume or immediate acceptance is not enough. I want confirmation that buyers are willing to hold price above the breakout level.
🎯 Upside Levels
HOD: $4.027
PDH: $4.038
First key resistance: $4.046 to $4.050
Extension target: $4.065
Higher-timeframe magnet: Prior Month High near $4.62
🛑 Invalidation
For a tight intraday entry, the setup fails if UNI breaks out and quickly loses the triangle, especially if it accepts back below roughly $4.006 to $4.00.
A failed breakout back into the range means patience is required. No acceptance, no trade.
🧠 Trade Plan
I am managing the position I already have while watching this triangle for continuation. The best add is not blindly chasing the first green candle. It is letting UNI prove it can break, hold, and accept above the intraday compression before targeting PDH and the overhead liquidity levels.
Location. Compression. Confirmation.
UNI 8H – Rising Channel Pullback Into Key HorizontalUNI on the 8H timeframe is currently trading around 3.946 after reaching the upper channel boundary near 4.400–4.500 on July 25 and pulling back sharply, with price now sitting at the 3.946–4.000 horizontal pivot that has been a consistent reference point throughout the channel structure.
The chart shows a rising parallel channel originating from the late May low near 2.290, with the lower trendline connecting the May 27 bottom through the June 25 low near 2.760 and continuing to climb into the 3.200–3.400 area currently, while the upper trendline capped the June 17 high near 3.760, the July recovery highs, and the July 25 high near 4.400–4.500. Price has made three clean oscillations inside the channel, bouncing from the lower boundary each time before pushing into the upper trendline. A horizontal level near 3.946–4.000 has been a recurring pivot through the upper portion of the channel, acting first as resistance before the July 25 breakout above it and now as support following the pullback from the upper boundary. The pullback from the July 25 high has been sharp, dropping from 4.400–4.500 back through 4.200 and now pressing directly into the 3.946–4.000 level.
The 3.946–4.000 horizontal is the first meaningful support level on the current pullback and sits well above the rising lower trendline near 3.200–3.400, with the channel structure fully intact as long as the lower trendline continues to hold.
Key Levels To Watch
→ 4.400–4.500 Upper channel boundary, resistance (dynamic)
→ 4.200–4.250 Minor resistance, recent rejection zone
→ 3.946–4.000 Horizontal pivot, current support test
→ 3.750–3.800 Secondary support, prior resistance zone
→ 3.500–3.600 Mid-channel support zone
→ 3.200–3.400 Rising lower trendline, dynamic support (climbing)
→ Below 3.050 Channel breakdown, bullish structure at risk
A hold above 3.946–4.000 and a recovery back toward the upper channel boundary near 4.200–4.400 would confirm the horizontal as active support and keep the bullish channel structure fully intact, with the prior high near 4.400–4.500 as the immediate target above.
A loss of 3.946–4.000 and a pullback toward the rising lower trendline near 3.200–3.400 would be a deeper channel retracement, and a confirmed 8H close below the lower trendline would break the structure that has held every significant low since late May.
Sharp pullback from upper boundary now testing horizontal pivot inside rising channel. Hold 3.946–4.000 → channel intact, upper boundary near 4.400–4.500 back in play. Lose 4.000 and trendline near 3.200–3.400 → channel structure at risk, downside toward 3.050. Bias bullish inside rising channel. Shift only on confirmed close below rising lower trendline.
UNI Technical Analysis: Breakout or Reversal?The 4H chart of CRYPTOCAP:UNI isn't just showing price movement; it's showing a battle between buyers who have controlled the trend for weeks and sellers who are trying to defend a major resistance area.
However, the recent breakout above the previous swing highs wasn't just another small bounce; it was accompanied by stronger momentum and sustained buying.
• The Bigger Picture: Looking at the left side of the chart, UNI experienced a prolonged downtrend that formed a descending triangle-like structure before eventually bottoming around the $2.30–2.40 region.
From that bottom, buyers stepped in aggressively. The market didn't simply bounce; it completely changed character.
• Rising Wedge Formation: The current move is developing inside a Rising Wedge, which is generally considered a bearish pattern when it forms after an extended rally.
• Horizontal Resistance Cluster: Price is currently testing several resistance levels simultaneously.
• Immediate Resistance: $3.88 – $3.95
This area has already rejected price multiple times. Every rejection tells us sellers are still defending this zone.
• Major Resistance: around $4.15–4.18
This is the red resistance line you've marked. If bulls can finally break above this level, the entire market structure changes. Above here, there isn't much historical resistance until significantly higher prices.
Beyond the chart, the fundamentals are becoming increasingly difficult to ignore. Instead of protocol growth existing separately from token value, these upgrades strengthen the relationship between increasing platform activity, protocol revenue, and the existing UNI burn mechanism.
• Volume Analysis: One thing stands out immediately. The biggest volume spike occurred during the explosive rally from the lows.
Since then:
• volume has gradually declined,
• rallies have become slower,
• candles are overlapping more frequently.
This often suggests momentum is cooling. It doesn't necessarily mean a crash is coming. Instead, it tells us that the market is waiting for fresh participation before choosing its next direction.
• Bullish Scenario: If buyers manage to reclaim momentum and break above the wedge resistance with convincing volume, several bullish confirmations would occur simultaneously.
The first upside objective becomes: $4.15–4.20
Breaking that zone could open the path toward the next psychological resistance. Momentum traders would likely begin entering aggressively after confirmation.
• Bearish Scenario: The chart also presents a realistic bearish possibility. Rising wedges frequently resolve downward.
If the price loses $3.65, it would increase the probability of a corrective move toward $3.33 or even the ascending trendline around $3.20 before buyers attempt another advance.
Therefore, I am currently observing UNI on Bitget. The easy tracking of price action, volume, and overall market sentiment in one place, Bitget, is giving us the upper hand and allows for executing trades with high liquidity.
Now I am waiting to do some quick scalp
🔴 SHORT:
• Entry: $3.90–$3.95 on any bounce toward VWAP (rejection candle)
• SL: $4
• TP1: $3.83 - TP2: $3.75 - TP3: $3.60
🟢 LONG:
• Entry: $3.72–$3.76 AFTER confirmed sweep + reversal candle
• SL: $3.65 (below flush zone)
• TP1: $3.84 - TP2: $3.95 - TP3: $4.05
This is not financial advice; it's my personal technical view based on the current chart. So always manage risk and wait for confirmation before entering any trade.
UNI USDT SHORT SIGNAL#122. UNI/USDT – Trade Setup (SHORT)
📈 Position Type: SHORT
🕒 Timeframe: 1H
📊 Market: Futures
💰 Entry Zone:
3.724
3.808
🛑 Stop-Loss:
3.890
🎯 Take-Profit Targets:
• TP1: 3.628
• TP2: 3.488
• TP3: 3.310
• TP4
⚙️ Leverage:
5 *10
▫️ After TP1, move SL to Entry + 0.2%.
▪️ Exit Plan:
• 50% at TP1
• 25% at TP2
• 25% at TP3
📌 Risk Management:
Risk only 1–2% of your capital per trade.
⚠️ Always check and confirm the setup on your chart before entering the trade.
Uniusdt shortInstructions:
Entry point: yellow
Stop loss: red
Take profit: green
👉Leverage x 5-10-20 for crypto
👉Leverage x 20-50-100 for commodities, stocks, indices, and forex
👉Margin 1-5% max.
Always practice risk and money management.
Invest a maximum of 5% on any trade or across all your trades.
Invest only what you can afford to lose, as no one is in control of the market.
👉Our analyses are primarily based on:
breakouts: two trend lines (ascending and descending) and a line indicating a horizontal breakout.
chart patterns: shoulders and head, triangle parttern, elliott impulse, etc etc.
We don't always have the time to track them at all times or to represent them visibly, given the numerous signals, the number of channels to manage, and especially because of the often rapid pace of market movements.
indicators: We associate at least two indicators with this technique.
👉Depending on the circumstances, we use specific indicators, often setting 3 or more take profit levels.
👉Indeed, there are good days in trading and also bad days. No one can promise to win every trade, and like all traders worldwide, we also experience stop-loss orders. However, we win more than we lose and remain positive.
👉You can close the position before or after the take profit orders indicated by the green lines if you are personally satisfied; the same applies to stop loss orders.
👉We must stay positive, clear-headed, and humble.
we cannot provide all instructions or all trades here on this channel.
Good luck to us all, and may God guide us. Amen.
UNIUSDT Forming Falling WedgeUNIUSDT is forming a clear falling wedge pattern, a classic bullish wave signal that often indicates an upcoming breakout. The price has been consolidating within a narrowing range, suggesting that selling pressure is gradually weakening while buyers are beginning to regain control. With consistent trading volume confirming accumulation at lower levels, the current setup hints at a potential bullish breakout in the near future. The projected move could lead to an impressive gain of around 90% to 100% once the price breaks above the key wedge resistance.
This falling wedge pattern is typically seen at the end of downtrends or corrective phases, representing a potential shift in market sentiment from bearish to bullish. Traders closely watching UNIUSDT are noticing strengthening momentum as the price approaches a critical breakout zone. Strong trading volume adds confidence to this setup, showing that market participants are positioning early in anticipation of a sustained upward move.
Growing investor interest in UNIUSDT reflects increasing confidence in the project's long-term fundamentals and its improving technical outlook. If the breakout is confirmed with sustained buying volume, it could mark the beginning of a fresh bullish leg. The ongoing consolidation phase suggests steady accumulation, creating favorable conditions for a strong continuation rally once the resistance level is cleared.
Traders may find this an attractive medium-term opportunity, especially as the falling wedge pattern nears completion and buying pressure continues to build. A confirmed breakout could attract additional market participation and accelerate the move toward the projected upside target.
✅ Show your support by hitting the like button.
✅ Leaving a comment below! (What is You opinion about this Coin)
Your feedback and engagement keep me inspired to share more insightful market analysis with you!
#UNIUSDT ANALYSIS (1D Timeframe)UNIUSDT is trading inside a rising channel after a strong recovery from its recent lows. Price is currently testing the upper boundary of the channel, where sellers have stepped in, making this a key decision zone.
📍 Current Price: 3.69 USDT
🟢 Key Support: 3.00–3.10 USDT (lower channel support)
🔴 Key Resistance: 3.70–3.90 USDT (upper channel resistance)
Bullish Scenario
A daily close above the channel resistance would confirm a bullish breakout and could trigger a move toward:
🎯 Target 1: 4.20 USDT
🎯 Target 2: 4.80–5.00 USDT
Bearish Scenario
The chart currently suggests a rejection from the upper channel. If sellers remain in control, UNI could retrace toward the lower boundary of the channel.
🎯 Downside Target: 2.37 USDT (approximately 22% decline from the current level)
⚠️ Invalidation: A strong breakout and daily close above 3.90 USDT would invalidate the bearish channel outlook and favor further upside.
Market Outlook: Neutral to Bearish in the short term while price remains below channel resistance. Bulls need a confirmed breakout to regain momentum.
UNI/USDT – Bearish Order Flow Idea 🔴 UNI/USDT – Bearish Order Flow Idea
Market Bias: Bearish
Concept: Market Structure / Order Flow
UNI/USDT
UNI/USDT continues to respect a well-defined bearish market structure, with price consistently forming lower highs and lower lows across the higher timeframes. The recent bullish move appears to be a corrective retracement into a premium pricing area rather than a true shift in market sentiment.
Price is approaching an unmitigated supply zone, which aligns with the prevailing bearish order flow. This area is expected to attract selling interest, increasing the probability of a rejection and continuation to the downside. As long as market structure remains intact, I anticipate sellers to regain control and drive price toward the next significant mid-term demand zone.
The target has been selected based on a high-probability demand area where price may find support and where profit-taking from short positions becomes reasonable. Waiting for bearish confirmation within the supply zone can further improve the quality of the setup.
Trade Plan
Entry: Reaction from the unmitigated supply / premium zone.
Take Profit: Mid-term demand zone (clearly marked on the chart).
Stop Loss: Above the supply zone and the recent swing high (shown on the chart).
Invalidation: A decisive candle close above the supply zone, indicating buyers have invalidated the bearish setup.
The exact Take Profit (TP) and Stop Loss (SL) levels are displayed on the chart for clarity and effective risk management.
⚠️ Disclaimer: This analysis is for educational purposes only and should not be considered financial advice. Always manage your risk appropriately and wait for your own confirmation before entering any trade.
$UNIUSDT Update (12H)UNIUSDT Update (12H)
Everyone is looking at the recent pullback, but for me, the bigger picture hasn't changed yet. Price is still trading above the main ascending trendline, and the green demand zone around $3.00–$3.20 remains the key area to watch. As long as this zone holds and buyers step back in, I still see room for another push toward $3.68, with $4.00 becoming the next major target if that resistance is broken.
Right now, I'm not chasing entries in the middle of the range. I want to see a proper reaction from support first. If the market loses the trendline and closes below the demand zone, this bullish idea becomes much weaker, and I'll wait for a new setup instead.
UNI Multi-Year Accumulation Signals a High-Reward OpportunityUniswap (UNI) has once again returned to a long-term demand zone that has consistently acted as a major accumulation area since 2022. After years of range-bound price action, the market is revisiting a region where buyers have repeatedly stepped in, making this one of the most important technical levels on the chart.
The highlighted accumulation zone has been respected across multiple market cycles, suggesting strong institutional demand whenever price trades within this range. Rather than showing signs of structural weakness, UNI continues to build a solid base that could serve as the foundation for the next major impulsive move.
From a technical perspective, the current market structure appears to be transitioning from distribution back into accumulation. Following an extended corrective phase, bearish momentum is beginning to fade while price stabilizes near long-term support. This type of behaviour often precedes trend reversals as sellers become exhausted and demand gradually returns.
If buyers maintain control above the current support zone, the next upside objectives come into focus:
🎯 Target 1: $8.10 – Previous resistance and the first major breakout level.
🎯 Target 2: $12.27 – Mid-range resistance where profit-taking could emerge.
🎯 Target 3: $15.67 – Major historical supply zone.
🎯 Target 4: $19.40 – Previous cycle resistance and the primary long-term target.
A sustained move above the first resistance level would strengthen the bullish case and increase the probability of a larger trend expansion toward higher price objectives.
Technical Outlook
Trend: Long-term bullish bias while price remains within the accumulation range.
Support: Multi-year demand zone (highlighted).
Risk: A confirmed weekly close below the accumulation range would invalidate the current bullish outlook.
Strategy: Accumulation near support with confirmation on higher highs and higher lows.
The risk-to-reward profile remains attractive as UNI trades near historical support while upside potential extends several hundred percent toward previous cycle resistance. Patience is key—major moves often begin when sentiment is at its weakest.
What do you think? Is UNI building a long-term bottom, or do you expect one more sweep before the next bull run? Share your thoughts below.