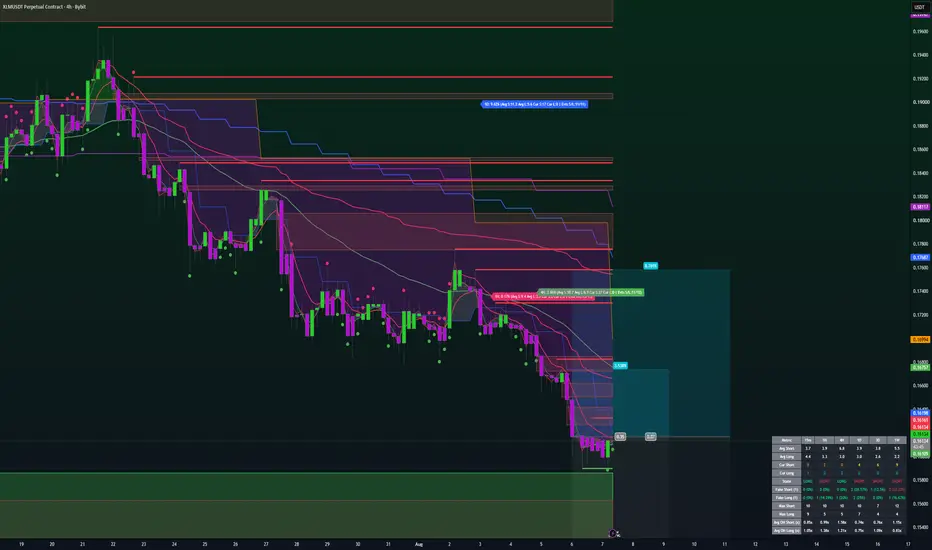
XLM’s Trap Is Almost Ready…!Yello Paradisers, is #XLM preparing to trap impatient traders before its next major move? What appears to be a simple pullback is developing into a far more significant structure, supported by a Selling Climax, ultra-high volume, improving bullish momentum, and early signs of accumulation. With pric
xlmusdt longInstructions:
Entry point: yellow
Stop loss: red
Take profit: green
👉Leverage x 5-10-20 for crypto
👉Leverage x 20-50-100 for commodities, stocks, indices, and forex
👉Margin 1-5% max.
Always practice risk and money management.
Invest a maximum of 5% on any trade or across all your trades.
Invest on
XLM / USDT Holding Key Level — Bullish Idea, Low AccuracyXLM / USDT is holding well above our key level, and as long as this zone remains intact, there is a possibility of a bullish move toward $0.1730. However, this setup has low accuracy and the price action has been showing frequent fake moves, so this is just an idea, not a signal. Manage risk wisely
XLM LONG — 4H ALMA Setup (WR 75% · avg RR 1.6)█ SETUP
BYBIT:XLMUSDT.P · 4H · long only.
(Context: Stellar — cross-border payments / remittance rails beta — trades with alt liquidity and payment-narrative flows, not a discretionary “buy XLM” call.)
ALMA Averaging Strategy: ALMA 3 / σ2, SD band 2, min diff 6/1, 25% per bar, up to 4 adds, ha
XLM 8H – Descending Trendline Breakout Above Key HorizontalXLM on the 8H timeframe is currently trading around 0.2596 after breaking sharply above the descending trendline that has capped every recovery since the late May high near 0.2900, with the current candle pushing through the trendline and the 0.1770–0.1810 horizontal resistance in a single sustained
Stellar: Breakdown Below Support Leaves Bears in ControlLong-Term Trend Remains Bearish
Stellar continues to trade within its primary downtrend, with the chart maintaining a clear sequence of lower highs and lower lows. The bearishly crossed 100/50-Day EMAs continue to reinforce the negative longer-term outlook.
Key Support Finally Gives Way
After ho
XLM: local squeeze with $0.22191 destinationThe Macro Picture 🗺️
XLM spiked to the $0.29817 macro ceiling in June, then settled into a range and now sits at $0.18301, holding above the $0.16866 local low. Price is coiling in the upper half of the range with the floor intact — a base rebuilding, not a breakdown.
The Setup ⚙️
The Range Floor
XLMUSDTXLMUSDT is currently consolidating below the 0.1959 resistance level and has been trading within this range for the past 11 days. As shown on the chart, price has tested this resistance multiple times without a confirmed breakout. Considering the current market conditions and the price compression b
XLM Tests Key SupportStellar (XLM) is currently trading above its local Point of Control (POC), a key level that has now flipped from resistance into support. This support-resistance flip is an encouraging technical development, suggesting that buyers are attempting to establish a base after the recent decline.
Price i
See all ideas
Summarizing what the indicators are suggesting.
Oscillators
Neutral
SellBuy
Strong sellStrong buy
Strong sellSellNeutralBuyStrong buy
Oscillators
Neutral
SellBuy
Strong sellStrong buy
Strong sellSellNeutralBuyStrong buy
Summary
Neutral
SellBuy
Strong sellStrong buy
Strong sellSellNeutralBuyStrong buy
Summary
Neutral
SellBuy
Strong sellStrong buy
Strong sellSellNeutralBuyStrong buy
Summary
Neutral
SellBuy
Strong sellStrong buy
Strong sellSellNeutralBuyStrong buy
Moving Averages
Neutral
SellBuy
Strong sellStrong buy
Strong sellSellNeutralBuyStrong buy
Moving Averages
Neutral
SellBuy
Strong sellStrong buy
Strong sellSellNeutralBuyStrong buy
Displays a symbol's price movements over previous years to identify recurring trends.