XLM’s Trap Is Almost Ready…!Yello Paradisers, is #XLM preparing to trap impatient traders before its next major move? What appears to be a simple pullback is developing into a far more significant structure, supported by a Selling Climax, ultra-high volume, improving bullish momentum, and early signs of accumulation. With price approaching critical resistance levels, XLM is entering a decisive zone where confirmation, patience, and disciplined execution will determine whether bulls can take control or the setup breaks down completely.
💎#XLM has recently printed a classic Selling Climax, followed by a Climactic Action candle backed by ultra-high volume. This is a textbook probability that accumulation may be developing. Historically, this type of behaviour often appears when smart money starts positioning before a larger move. To inexperienced traders, it may look like noise. But for experienced traders, this kind of volume reaction carries serious weight.
💎#XLM swept the Selling Climax with an Automatic Rally structure and then aggressively breaking above the Automatic Rally trend-line with strong momentum candle followed with a shakeout test swept sell side liquidity. This is a key probability. It suggests weak hands are being forced out of the market while stronger participants continue accumulating positions with confidence.
💎#XLM has also moved back above the lower trigger line of the Selling Climax with a strong momentum candle adding more confluence for the bullish probability. If the prices sustain this momentum, the next upside path can open toward 2050, which is currently acting as a major structural resistance level.
💎#XLM momentum gradually shifted toward the bullish side. During the retracement, prices tested the order block zone. A clear RSI divergence is also visible, adding further confirmation to the bullish probability. As long as prices holds momentum inside the order block zone, the structure remains constructive. The first major resistance level to monitor is 1935. A decisive break and sustained acceptance above this area would strengthen the probability of further continuation toward 2050.
💎If #XLM fails to hold bullish momentum and a momentum candle closes below 1650, the current bullish probability becomes invalid. In that case, we could see further downside pressure.
That is why Paradisers, we are playing it safe right now. If you want to be consistently profitable, you need to be extremely patient and always wait only for the best, highest probability trading opportunities only on confirmations.
MyCryptoParadise
iFeel the success🌴
In-depth trading ideas
xlmusdt longInstructions:
Entry point: yellow
Stop loss: red
Take profit: green
👉Leverage x 5-10-20 for crypto
👉Leverage x 20-50-100 for commodities, stocks, indices, and forex
👉Margin 1-5% max.
Always practice risk and money management.
Invest a maximum of 5% on any trade or across all your trades.
Invest only what you can afford to lose, as no one is in control of the market.
👉Our analyses are primarily based on:
breakouts: two trend lines (ascending and descending) and a line indicating a horizontal breakout.
chart patterns: shoulders and head, triangle parttern, elliott impulse, etc etc.
We don't always have the time to track them at all times or to represent them visibly, given the numerous signals, the number of channels to manage, and especially because of the often rapid pace of market movements.
indicators: We associate at least two indicators with this technique.
👉Depending on the circumstances, we use specific indicators, often setting 3 or more take profit levels.
👉Indeed, there are good days in trading and also bad days. No one can promise to win every trade, and like all traders worldwide, we also experience stop-loss orders. However, we win more than we lose and remain positive.
👉You can close the position before or after the take profit orders indicated by the green lines if you are personally satisfied; the same applies to stop loss orders.
👉We must stay positive, clear-headed, and humble.
we cannot provide all instructions or all trades here on this channel.
Good luck to us all, and may God guide us. Amen.
XLM / USDT Holding Key Level — Bullish Idea, Low AccuracyXLM / USDT is holding well above our key level, and as long as this zone remains intact, there is a possibility of a bullish move toward $0.1730. However, this setup has low accuracy and the price action has been showing frequent fake moves, so this is just an idea, not a signal. Manage risk wisely and always do your own research before entering any trade. 📊⚠️
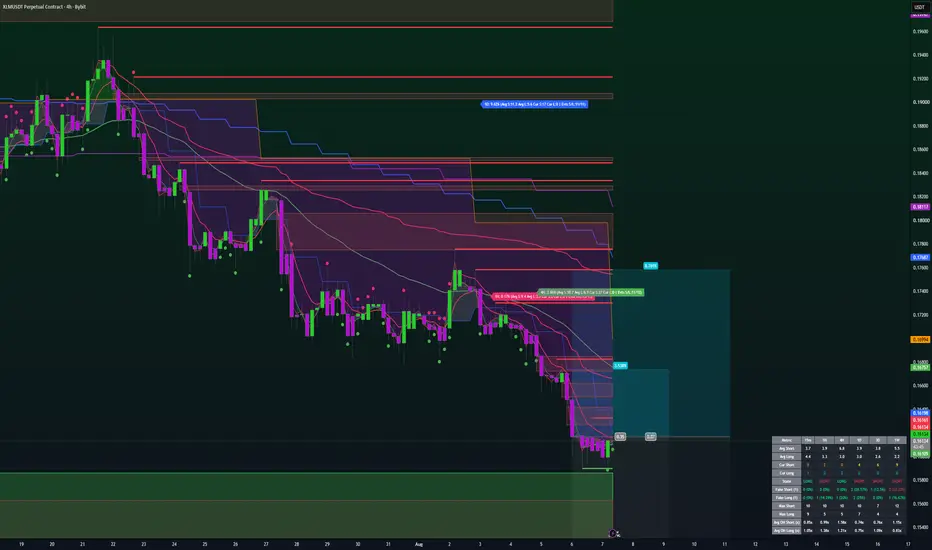
XLM LONG — 4H ALMA Setup (WR 75% · avg RR 1.6)█ SETUP
BYBIT:XLMUSDT.P · 4H · long only.
(Context: Stellar — cross-border payments / remittance rails beta — trades with alt liquidity and payment-narrative flows, not a discretionary “buy XLM” call.)
ALMA Averaging Strategy: ALMA 3 / σ2, SD band 2, min diff 6/1, 25% per bar, up to 4 adds, hard stop −10% from average entry.
Strategy Tester (XLM 4H):
Win rate 75% · profit factor 2.7
Avg winning trade +6.5% · avg losing trade −4.1%
Typical hold ~25×4H bars on winners — payments-alt mean-reversion grid on the 4H Averaging template · 241-trade sample
═
█ WHY NOW
Fresh 4H ALMA long on the 5 Aug 16:00 UTC bar ~ $0.1663 — lot 1 of 4.
Bar-close arm into an alt wash, not a size-up on a payments partnership headline. Hard stop −10% from fill ~ $0.150 . Exits follow Pine ALMA flip + min diff or the hard stop. Scale-in stays 25% per bar, up to 4 adds, if lower bars qualify. Mark ~ $0.162 .
═
█ MACRO
Sector: XLM = Stellar — cross-border settlement / remittance narrative — beta to payment-rail headlines and broad alt risk appetite when BTC holds a floor.
Tape (5–6 Aug): early-Aug alt tape still mixed; 4H board printed bear FVG raids ~$0.160–0.162 after the fill, with 1D RSI-9 oversold and short-liquidation tags on the board. Execution is 4H ALMA Averaging on the fill bar — not a remittance-volume or partnership forecast.
═
█ OUTLOOK
Positive factors
- Tester: 75% WR · PF 2.7 · avg win +6.5% vs avg loss −4.1% (avg RR 1.6) · 241-trade sample — hit-rate edge with bounded −10% stop
- EMA — multi-TF below discount: 4H Below · Cur S:23 vs Avg S:11.9 · +5.0% · 1D S:16 vs 12.4 · +10.6% · 1W S:10 · +32% Dev — slow clocks deep below EMA = mean-reversion fuel
- Board: RSI 9 Oversold on 1D · 4H short-liquidation tags — wash extreme fuel for Averaging templates
- GEO — Falling Wedge: 6 Aug · bounce up B 67% · break down Br33% (n=24) — bounce-up skew if the wedge holds as repair fuel
- SMC — 4H bear raid pocket: FVG Raid Bear ~$0.160–0.162 ( 6 Aug ) · reject down B 53% · break up Br47% (n=1169) — near 50/50; break-up path can still align with a first-lot repair grind
Negative factors
- EMA — 3D below still young: 3D S:6 vs 12.2 — not fully time-overheated on every clock; lower probes possible
- SMC — daily bear OB: 1D OB New Bear ~$0.165 ( 5 Aug ) right at/above the fill — local supply (no B/Br on that print)
- SMC — daily bull FVG at ~$0.169: 1D FVG Enter Bull ( 4 Aug ) · bounce up B 38% · break down Br62% (n=149) — break-down skew through the nearby bull shelf
- SMC — weekly bull FVG shelves: 1W FVG Enter Bull ~$0.174–0.183 ( late Jul ) · bounce up B 33% · break down Br67% (n=3) — thin sample, but history favors break-down vs bounce-up hold
- TL — Resistance Break: 6 Aug · reject down B 71% · break up Br29% (n=90) — reject-down ceiling after the resistance break
- First lot only — thin cushion; mark already soft vs entry
Takeaway: 4H ALMA + 75% WR / 1.6 avg RR still justify a first-lot arm into a deep below-EMA stretch with oversold/liquidation tags and a Falling Wedge bounce-up skew (67/33), but reject-down ceiling on the Resistance Break (71/29), break-down skew on nearby 1D/1W bull FVGs, and only a contested break-up path through the 4H bear-raid pocket (53/47) keep this a payments-alt repair grind — not a clean trend reclaim; risk stays on the −10% hard stop / Pine exit path.
Base case: 4H ALMA holds · digest toward ~$0.17–0.18 weekly shelves only if bounce-up wins over break-down on those bull FVGs · adds only on qualifying lower closes.
Bear case: reject-down from ~$0.165 supply / Resistance Break holds · break down through ~$0.160 · 4H ALMA flips · −10% from ~$0.166 toward ~$0.150 · BTC / alt gap through the perp book.
Chart: BYBIT:XLMUSDT.P 4H — ALMA Averaging Strategy.
Educational idea. Live position — past backtest ≠ future results. NFA.
XLM 8H – Descending Trendline Breakout Above Key HorizontalXLM on the 8H timeframe is currently trading around 0.2596 after breaking sharply above the descending trendline that has capped every recovery since the late May high near 0.2900, with the current candle pushing through the trendline and the 0.1770–0.1810 horizontal resistance in a single sustained move that represents the most significant structural development on this chart since the decline began.
The chart shows a descending trendline originating from the late May high near 0.2900, connecting through the June 15 recovery high near 0.2500 and continuing to slope down into the 0.1810–0.1850 area just prior to the current breakout. A horizontal floor near 0.1690–0.1730 has held as the lowest level on this chart through two significant tests, once in late June near 0.1690 and again in late July, before the current sharp recovery launched from that level. Price had been grinding along the lower portion of the descending trendline through late July before a breakout candle pushed through the trendline, the 0.1770–0.1810 resistance, and the 0.1900–0.1960 zone in quick succession, reaching the current level near 0.2596.
The breakout from a descending trendline that held for two months on the 8H timeframe, combined with the launch from the double-tested horizontal floor, gives the current move structural weight, though price has moved significantly from the breakout point and the sustainability of the move depends on what it holds above on any pullback.
Key Levels To Watch
→ 0.2800–0.2900 Prior high, major resistance above
→ 0.2500–0.2550 Prior recovery high, resistance
→ 0.2200–0.2300 Mid-range resistance zone
→ 0.1960–0.2000 Broken descending trendline zone, now support
→ 0.1900–0.1960 Prior consolidation, support on pullback
→ 0.1770–0.1810 Broken horizontal resistance, now key support
→ 0.1690–0.1730 Macro horizontal floor, double-tested support
A hold above the broken descending trendline near 0.1960–0.2000 on any pullback and continuation above 0.2200–0.2300 would confirm the breakout as structural, opening a move toward the prior recovery high near 0.2500–0.2550 and potentially a retest of the May high near 0.2800–0.2900.
A rejection back below the broken trendline near 0.1960–0.2000 and a loss of 0.1770–0.1810 would suggest the breakout was a spike rather than a structural shift, returning price toward the 0.1690–0.1730 macro floor and reopening the risk of a breakdown below it.
Descending trendline broken after two months with strong momentum, key test is what holds on any pullback. Hold above 0.1960–0.2000 broken trendline → breakout confirmed, eyes on 0.2500–0.2900. Lose 0.1770–0.1810 → breakout invalidated, back toward macro floor near 0.1690–0.1730. Bias bullish above broken trendline. Shift only on confirmed close back below 0.1960–0.2000.
Stellar: Breakdown Below Support Leaves Bears in ControlLong-Term Trend Remains Bearish
Stellar continues to trade within its primary downtrend, with the chart maintaining a clear sequence of lower highs and lower lows. The bearishly crossed 100/50-Day EMAs continue to reinforce the negative longer-term outlook.
Key Support Finally Gives Way
After holding for almost three months, the $0.17 support zone has now been decisively broken. What was previously an important floor may now become resistance if price attempts to recover.
Weak Bounce Needed First
Bulls first need to reclaim the $0.1776 swing high to begin weakening the current bearish structure. Until then, rallies are likely to be viewed as corrective rather than the start of a broader reversal.
Selling Pressure Remains Controlled
The latest decline has occurred on relatively light volume rather than panic selling. While this may limit the speed of the move lower, it does little to change the underlying bearish structure.
In Summary
Stellar has suffered a significant technical setback after losing the $0.17 support zone that had contained price for almost three months. With bearish market structure still intact and the 100/50-Day EMAs continuing to point lower, sellers remain in control. Bulls need to reclaim $0.1776 to improve the outlook, while failure to hold the recent $0.1590 low would increase the risk of another leg lower.
XLM: local squeeze with $0.22191 destinationThe Macro Picture 🗺️
XLM spiked to the $0.29817 macro ceiling in June, then settled into a range and now sits at $0.18301, holding above the $0.16866 local low. Price is coiling in the upper half of the range with the floor intact — a base rebuilding, not a breakdown.
The Setup ⚙️
The Range Floor 🟢
$0.16866 (Local Low) is the demand shelf, with $0.13920 (Macro Support) as the deeper backstop. Both have held, and that's the base this range pivots on.
The Decision Point 🔴
$0.19650 (Local High) is the gate. A daily close above it flips the local structure bullish and opens the path to the $0.22191 measured-move target.
The Roadmap 🛣️
Hold above $0.16866 → break $0.19650 → run toward $0.22191. Invalidation is a clean daily close below $0.13920 — that breaks the range.
This is a GRID Range Play: a defined band to rotate, buying the lower half and scaling out into the breakout.
More setups in profile.
#XLM #Stellar #crypto #trading #TA #3Commas #GRID
XLMUSDTXLMUSDT is currently consolidating below the 0.1959 resistance level and has been trading within this range for the past 11 days. As shown on the chart, price has tested this resistance multiple times without a confirmed breakout. Considering the current market conditions and the price compression beneath this level, XLM is worth keeping on the watchlist for a potential long setup. A confirmed breakout and close above 0.1959 could provide a favorable long opportunity, while proper risk and capital management should always be applied.
XLM Tests Key SupportStellar (XLM) is currently trading above its local Point of Control (POC), a key level that has now flipped from resistance into support. This support-resistance flip is an encouraging technical development, suggesting that buyers are attempting to establish a base after the recent decline.
Price is also testing an important daily support almost to the dollar, creating a strong technical region where demand has started to emerge. Although brief wicks below this support remain possible as liquidity is collected, the broader bullish outlook remains intact as long as price continues to close above the current level.
From a technical perspective, XLM is trading near the lower boundary of its range, where the probability of a bottoming structure continues to increase. If buyers successfully defend this support and confirm a higher low, the next objective becomes a rotational move toward the $0.25 weekly resistance. A rally into this level would be consistent with the current range-bound environment and signal improving market sentiment.
However, failure to hold the Point of Control and daily support would weaken the bullish setup and increase the risk of a deeper corrective move.
For now, XLM remains in an important accumulation zone. Holding above the Point of Control and daily support keeps the probability in favor of a recovery toward the $0.25 resistance, with buyers attempting to establish a sustainable base for higher prices.
XLM: Still Holding Key SupportKey Support Continues to Hold
Stellar continues to defend the key $0.17-$0.18 daily/weekly support area, with another reaction from the zone on Wednesday. Buyers have repeatedly stepped in around this area, keeping the current structure intact for now.
100/50-Day EMAs Remain Bullishly Crossed
The 100/50-day EMAs remain bullishly crossed, with price currently trading around those averages. The bulls will want to see price push clear of the EMAs and use them as support to strengthen the short-term picture.
$0.1688 Remains the Risk Level
The recent $0.1688 swing low remains the key level I'm watching to the downside. A clear break below this low could have further bearish implications and signal that the wider support area is beginning to fail.
Bulls Still Need a Break of Structure
To the upside, $0.2158 remains the level to beat, with price still trading below the recent swing high. A clear break above would give the bulls a potential bullish break of structure and improve the wider picture.
Momentum Remains Mixed
The RSI continues to chop around the 50 level, while the StochRSI is falling and sits around mid-range. Momentum remains relatively neutral, although the large buying volume spikes are certainly worth keeping an eye on.
Summary
Stellar continues to hold the key $0.17-$0.18 daily/weekly support area, while the 100/50-day EMAs remain bullishly crossed. However, price is still trading around those averages and momentum remains mixed. A break above $0.2158 would give the bulls a potential bullish break of structure, while losing $0.1688 could have further bearish implications. For now, support is holding, but there's still work to do.
XLM range: rotation between $0.175 and $0.24The Macro Picture 🗺️
XLM's June volatility spike to $0.30 has long since cooled, and price has spent the weeks since carving a wide horizontal range between the $0.175 floor and the $0.24 ceiling. This is a classic post-spike cooldown — a volatility playground where price rotates boundary to boundary while the market digests the move. At $0.205 mid-range with RSI hovering around the neutral 50 line, there's no directional edge here; the next real move waits on a decisive break of the box.
The Setup ⚙️
The Range Play: The zone between $0.175 and $0.24 creates a structural playground for grid-based accumulation. Each rejection at the $0.24 ceiling and each bounce off the $0.175 floor reinforces the boundaries, and the interior rotation is the opportunity while direction stays unresolved.
The Trigger: The box only resolves on a decisive move through its edges — a reclaim of the $0.24 ceiling opens a retest of the $0.30 spike high, while a loss of the $0.175 floor exposes the $0.145 macro support. Until one breaks, the rotation continues.
The Roadmap: Primary target on a bullish resolution sits at $0.24 — the range ceiling, where the green roadmap points if buyers break the box. Invalidation: a sustained 1D close below $0.175 would break the range and open the path toward the $0.145 macro floor.
XLMUSDT - The Next Move Could Define the Trend?🕒 On the 12H timeframe, XLM is still trading inside a Falling Channel, a pattern that is generally considered either a Bullish Continuation or Bullish Reversal formation, especially if price successfully breaks above the upper resistance line with increasing volume.
📍 At the moment, the price is approaching the upper boundary of the channel and testing the Descending Resistance (Red Trendline). This is a critical decision zone that will determine whether XLM can continue its upward momentum or face another correction.
🟨 On the downside, there is a strong Key Support around $0.145–$0.150, which has consistently acted as an important demand zone. As long as this support remains intact, the medium-term bullish market structure is still valid.
---
📐 Pattern Overview: Falling Channel 📉
A Falling Channel forms when price creates a series of Lower Highs and Lower Lows within two parallel downward-sloping trendlines.
✨ Pattern Characteristics:
📉 Indicates a corrective phase within a larger trend.
📈 A breakout above the channel resistance often signals the end of the correction.
🔥 The more times the resistance is tested without creating a new Lower Low, the greater the probability of a bullish breakout.
🎯 Currently, price is approaching the breakout area, making the next move extremely important for confirming the future trend.
---
🟢 Bullish Scenario 🚀
✅ If XLM successfully breaks out and closes above the Falling Channel resistance, the probability of a stronger bullish move will significantly increase.
🎯 Upside Targets:
🥇 Target 1: $0.21500
🥈 Target 2: $0.23650
🥉 Target 3: $0.26500
🚀 If buying momentum continues to strengthen with rising trading volume, XLM could extend its rally toward the next major resistance levels.
💡 The strongest confirmation would be a Breakout ➜ Successful Retest ➜ Continuation Rally.
---
🔴 Bearish Scenario 📉
❌ If the price gets rejected at the channel resistance once again, XLM may continue trading within the descending channel.
📍 Key support levels to monitor:
🟢 Dynamic Support (Lower Boundary of the Channel)
🟨 Key Support: $0.145–$0.150
⚠️ If the Key Support is broken with strong selling volume, bearish pressure could intensify, opening the door for a deeper correction below the current channel structure.
---
🔎 Conclusion 📌
📊 From a technical perspective, XLM is currently trading in a Decision Zone, where the next breakout or rejection will likely determine the market's direction.
🚀 The Falling Channel resistance is the key level that must be broken to confirm a stronger bullish trend.
🛡️ As long as the price remains above the Key Support, the bullish breakout scenario remains valid.
⏳ However, traders should wait for a confirmed breakout accompanied by strong volume before making trading decisions, as another rejection at resistance could still trigger further downside movement.
---
⚠️ Disclaimer
📚 This analysis is based on Price Action and Technical Analysis and should not be considered financial advice.
💼 Always DYOR (Do Your Own Research), apply proper risk management, and never risk more capital than you can afford to lose.
---
#XLM #Stellar #XLMUSDT #Crypto #Cryptocurrency #Altcoin #Trading #TradingView #TechnicalAnalysis #PriceAction #ChartAnalysis #Bullish #Bearish #Breakout #FallingChannel #Support #Resistance #Binance #CryptoTrading #Investing 🚀📈
XLMUSDT.P: long setup from daily resistance at 0.20784BINANCE:XLMUSDT.P has been consolidating below the resistance level for three days. I like that the level was confirmed by a pip-for-pip strike, after which the asset remains in consolidation below the level, meaning it is accumulating energy for an upcoming breakout. I am expecting a long.
XLM – Buyers need confirmation before targeting higher levels.Stellar (XLM) is one of the top-performing major cryptocurrencies in June 2026. While the broader market remains in an accumulation phase, XLM has posted an impressive 10% gain, making it one of the best-performing large-cap assets this month.
XLM is currently trading at $0.2072, up 3.34% over the last 24 hours, with a daily trading volume of $1,384,221. The price has surpassed the key $0.20 support level, indicating strong market buying pressure.
Bullish signals on the chart:
+ The RSI has reached 65, placing it in bullish territory and indicating strong upward momentum.
+ The MACD has formed a "golden cross," signaling the establishment of a short-term bullish trend.
+ Bollinger Bands show the price approaching the upper band, opening up the possibility of a breakout.
Factors driving XLM's price increase:
1. IMF recognition and industry trends: A recent IMF video highlighted XLM as a future avenue for programmable money, emphasizing that its low-cost, near-instant transaction capabilities meet the needs of financial modernization, thereby providing XLM with macroeconomic policy support.
2. Rapid expansion of the RWA ecosystem:
• Matrixdock launched the XAUm token—backed 1:1 by physical gold—on the Stellar network, with direct investment from the Stellar Development Foundation.
• The Stellar RWA market size has reached $335 million, a 29.9% increase over the past 30 days.
• Stablecoin trading volume hit $492 million over the last 30 days, up 32.61% from the previous month.
3. Strategic partnership with DTCC: A partnership agreement with the Depository Trust & Clearing Corporation (DTCC) is set to bring trillions of dollars in securities assets onto the Stellar network by the first half of 2027. Tokenization trials for Russell 1000 index stocks began on July 13, with XLM serving as the settlement instrument.
4. Thriving ecosystem applications: Ondo Finance's Total Value Locked (TVL) surged 326.5% in 30 days to reach $525 million, making it the second-largest application on Stellar; Franklin Templeton's BENJI fund has approved 6,262 wallets over five years, with zero instances of withdrawals.
Trading Outlook:
XLM has rebounded from the $0.15–$0.16 support zone, indicating strong support at the lows.
Currently trading at $0.2072, XLM faces resistance in the $0.23–$0.26 range; breaking through this zone is essential to confirm a bullish reversal, potentially paving the way for a rally toward the $0.50 target or even higher.
Traders can act on this setup and buy XLM—all from a single Bitget account.
Stellar Lumens (XLM)Stellar, alongside Canton, is one of the few blockchains selected by DTCC, an institution that processes quadrillions of dollars in transactions each year.
The project is getting close to moving from pilot to production.
At this point, I believe Stellar may have already found its bottom ans so a new all-time high no longer feels unrealistic.
XLMUSDT 1D#XLM is moving inside a bullish flag pattern on the daily chart. It is trading above the daily SMA50, and the RSI is showing potential bullish momentum.
In case of a breakout above the flag resistance, the potential upside targets are:
🎯 $0.2190
🎯 $0.2341
🎯 $0.2492
🎯 $0.2708
🎯 $0.2982
⚠️ Always remember to use a tight stop-loss and maintain proper risk management.
XLM: bullish spike toward $0.24The Macro Picture 🗺️
XLM spent the spring compressed under $0.18 before June's volatility spike ripped price into $0.30 — a structural peak that printed and vanished within days. Since then the market has been cooling inside a wide macro range, a volatility playground that demands a full cooldown before the next directional decision resolves. Price now sits back at the $0.20 equilibrium, the dotted mid-line marked on the chart, and the path of least resistance is curling back up toward the range ceiling.
The Setup ⚙️
The Reaction: Price has just bounced hard off the $0.175 floor, the same band that has absorbed every sell attempt through late June, and the current impulse leg is driving back into the middle of the range. Momentum is reclaiming the RSI midline, a signal that sellers have lost control of the tape down here.
The Range Play: Between $0.175 and $0.24 the market is doing exactly what a post-spike cooldown demands — oscillating inside the range until a catalyst resolves direction. Each bounce off the green floor zone and rejection at the red ceiling reinforces a structural playground for grid-based accumulation, with the interior itself as the opportunity.
The Roadmap: Primary target sits at $0.24 — the Local High / Decision level and the ceiling of the current range, exactly where the white projection points, a high-confluence zone where trapped shorts get squeezed on the way up. Invalidation: a sustained 1D close below $0.175 would invalidate this bullish thesis and open the bearish path toward the macro floor at $0.145.
XLM Holding Above Key Value AreaStellar (XLM) is showing signs of strength after reclaiming and holding above the Point of Control (POC) from its previous trading range. As the highest volume-traded level within the range, the POC often acts as a key area of support or resistance, making it an important level to monitor. Its confluence with a higher-timeframe support level further increases its technical significance.
While the current structure remains constructive, traders should watch for a potential pullback toward the 0.786 Fibonacci retracement. A successful retest of this level, followed by a strong bullish reaction, would reinforce the idea that buyers remain in control and that the recent move is simply a healthy retracement rather than the start of a deeper correction.
If the 0.786 Fibonacci holds as support, it would increase the probability of price rotating back into the previous trading range and continuing the broader range-bound structure. This would signal renewed buying interest and could pave the way for another rally toward the upper resistance levels.
As long as XLM continues holding above the Point of Control and reacts positively from key Fibonacci support, the technical outlook remains constructive. The next major confirmation for bulls will be maintaining these higher-timeframe support levels and building momentum for another move higher within the established range.
$XLM just printed a +4.28% 4H candle to $0.1826—and almost......BINANCE:XLMUSDT just printed a +4.28% 4H candle to $0.1826—and almost everyone is celebrating the breakout.
The problem? Price has just entered one of the strongest supply zones on the chart. This is where smart traders stop chasing and start watching.
📰 24H NEWS SNAPSHOT
There has been no major Stellar ecosystem announcement in the last 24 hours capable of explaining today's move. That makes this a technically driven rally, where market structure deserves more attention than headlines.
Keep an eye on @StellarOrg, @CoinDesk, and @Cointelegraph for any unexpected catalyst.
📊 MARKET BIAS
🐻 Bearish (conditional)
Price is trading directly into a 4H Selling Breaker Block + Daily Fair Value Gap, a zone where sellers previously overwhelmed buyers.
🎯 TRADE LEVELS
📍 Entry Zone: $0.1809 – $0.1821 (only after bearish confirmation)
🛑 Stop Loss: $0.1839
Risk: 1.10% (Risk only 1% of portfolio)
🎯 TP1: $0.1740
Reward: +3.81%
R:R: 3.5 : 1
🎯 TP2: $0.1659
Reward: +8.29%
R:R: 7.5 : 1
🎯 TP3: $0.1600
Reward: +11.6%
R:R: 10 : 1
🧠 CHART ANALYSIS
The market has produced an impulsive bullish candle that pushed price directly into institutional supply.
The $0.1809–$0.1821 region combines:
• 4H Selling Breaker Block
• Daily Fair Value Gap
• Previous breakdown origin
This is exactly where many traders FOMO into longs while experienced traders wait for confirmation. A bearish rejection candle from this zone would significantly strengthen the short setup.
A sustained 4H close above $0.1839 invalidates the bearish idea and suggests buyers are absorbing supply.
🛡️ RISK MANAGEMENT TIP
Never short because a zone exists.
Short because price confirms rejection inside that zone.
If confirmation never appears, there is no trade.
📚 EDUCATIONAL NUGGET
Institutional supply zones don't guarantee reversals.
They create high-probability reaction areas.
Professional traders wait for the market to reveal who's winning before risking capital. Patience often outperforms prediction.
Everyone is excited because CRYPTOCAP:XLM gained 4.28%.
The real question isn't whether it pumped.
It's whether $0.1809–$0.1821 becomes another smart-money trap.
That's why smart traders don't chase—they let the chart answer first.
💬 Do you think BINANCE:XLMUSDT breaks above $0.1839, or does this breaker block send it back to $0.1740? Let me know below.
#XLM #Stellar #CryptoTrading
XLM May Be Entering a Bearish PhaseA recent bearish CH has formed on XLM, breaking the buyers' stronghold and marking the first sign of strong sellers emerging in the market.
This bearish CH was formed after the price reacted to the marked supply zone, indicating that sell orders were efficiently distributed and providing evidence of genuine selling pressure.
Following a potential pullback to the upside, the expectation is for the price to continue moving toward lower levels.
Consider scaling into the position using a DCA approach at the entry zones marked on the chart.
At the first target, move your stop-loss to breakeven to protect your capital.
A daily candle close above the invalidation level will invalidate this analysis.
If you would like us to analyze a coin or altcoin for you, first like this post, then comment the name of your altcoin below.
What is your opinion about XLM?