Potential long setup?USD/ZAR is falling toward the pivot and could bounce toward the 1st resistance, which is a pullback resistance.
Pivot: 16.50226
1st Support: 16.28926
1st Resistance: 16.76814
Disclaimer:
The opinions given above constitute general market commentary and do not constitute the opinion or advice of IC Markets or any form of personal or investment advice.
Any opinions, news, research, analyses, prices, other information, or links to third-party sites contained on this website are provided on an "as-is" basis, are intended to be informative only, and are not advice, a recommendation, research, a record of our trading prices, an offer of, or solicitation for, a transaction in any financial instrument and thus should not be treated as such. The information provided does not involve any specific investment objectives, financial situation, or needs of any specific person who may receive it. Please be aware that past performance is not a reliable indicator of future performance and/or results. Past performance or forward-looking scenarios based upon the reasonable beliefs of the third-party provider are not a guarantee of future performance. Actual results may differ materially from those anticipated in forward-looking or past performance statements. IC Markets makes no representation or warranty and assumes no liability as to the accuracy or completeness of the information provided, nor any loss arising from any investment based on a recommendation, forecast, or any information supplied by any third party.
U.S. Dollar / South African Rand
No trades
No trades
In-depth trading ideas
Falling towards 61.8% Fib support?USD/ZAR is falling toward the pivot, which is a pullback support that aligns with the 61.8% Fibonacci retracement and could bounce towards the 1st resistance, which is a pullback resistance.
Pivot: 16.59894
1st Support: 16.35283
1st Resistance: 16.89960
Disclaimer:
The opinions given above constitute general market commentary and do not constitute the opinion or advice of IC Markets or any form of personal or investment advice.
Any opinions, news, research, analyses, prices, other information, or links to third-party sites contained on this website are provided on an "as-is" basis, are intended to be informative only, and are not advice, a recommendation, research, a record of our trading prices, an offer of, or solicitation for, a transaction in any financial instrument and thus should not be treated as such. The information provided does not involve any specific investment objectives, financial situation, or needs of any specific person who may receive it. Please be aware that past performance is not a reliable indicator of future performance and/or results. Past performance or forward-looking scenarios based upon the reasonable beliefs of the third-party provider are not a guarantee of future performance. Actual results may differ materially from those anticipated in forward-looking or past performance statements. IC Markets makes no representation or warranty and assumes no liability as to the accuracy or completeness of the information provided, nor any loss arising from any investment based on a recommendation, forecast, or any information supplied by any third party.
2H2026 USDZAR updateSince I posted the original idea, the pair has remained range bound between 16.20 and 16.70. I also adjusted upward channel from the previous chart, but the general idea remains the same.
I expect that today’s non-farm payroll print will allow the pair to re-test the upper or lower bound of this range. I’m still leaning towards a move to the upside with the resistance levels being the 50-day MA at 16.44 and the 200-day MA at 16.65. A strong payrolls print will signal that the Fed has room to hike rates into a strong US labour market. The Fed chair has recently signalled that the Fed is more concerned with high inflation as opposed to the state of the US labour market.
The main reasons why I’m favouring the upside move is due to the market’s expectations of a Fed hike later this year as well as the pullback in precious metal prices. The first sign of a confirmation of the upside move will be if the yield differential between the ZA10-year yield and US 10-year yield breaks above 4.00% and moves higher towards 4.50%.
Looking at the rand-amentals, there are however macro-economic factors supportive of the rand, namely the SA trade surplus and current account balance. The most recent 1Q2026 release reported a trade surplus of R438 billion, up 55% from the 4Q2025, while the current account spiked to a 5-year high of R191 billion. The strong trade position that SA is currently holding will limit severe rand depreciation too far above March 2026 high of 17.20 if there is another risk-off spike from the expected Fed rate hike. I’m expecting the 3rd impulse wave to hit resistance in the blue range in the 17.50’s. Additionally, the SARB has front run the Fed regarding rate hikes which is also rand supportive.
For now, it is a bit of a wait and see so a re-test of the red support zone and the critical level of 16.25 is not off the cards if we get a weak jobs number today. Lastly, given the rand-amentals and the resistance the rand has shown during the Hormuz drama, the 5-wave impulse in this idea will likely only play out if we enter an environment of higher US rates.
USDZAR: Post unexpected SARB rate pause.The pair managed to surge past the 200-day MA at 16.57 last week after the unexpected decision from the SARB to leave the repo rate unchanged at 7%.
The pair touched a 4-month high of 16.97 before consolidating to close the week at 16.81. The next critical support levels to watch are the 50% fibo at 16.65 and the 200-day MA at 16.57. I expect these levels to be tested over the coming trading sessions but a failed break the phycological 16.50 handle will support the bigger trend highlighted in the original idea.
Additionally, the ZA10-year minus the US10-year yield is climbing higher, just over 4.25% which is rand negative.
The fundamental analysis highlighted in the previous/linked idea remains broadly unchanged.
Bearish drop off?USD/ZAR has rejected off the pivot and could drop toward the 1st support.
Pivot: 16.46277
1st Support: 16.28476
1st Resistance: 16.58019
Disclaimer:
The opinions given above constitute general market commentary and do not constitute the opinion or advice of IC Markets or any form of personal or investment advice.
Any opinions, news, research, analyses, prices, other information, or links to third-party sites contained on this website are provided on an "as-is" basis, are intended to be informative only, and are not advice, a recommendation, research, a record of our trading prices, an offer of, or solicitation for, a transaction in any financial instrument and thus should not be treated as such. The information provided does not involve any specific investment objectives, financial situation, or needs of any specific person who may receive it. Please be aware that past performance is not a reliable indicator of future performance and/or results. Past performance or forward-looking scenarios based upon the reasonable beliefs of the third-party provider are not a guarantee of future performance. Actual results may differ materially from those anticipated in forward-looking or past performance statements. IC Markets makes no representation or warranty and assumes no liability as to the accuracy or completeness of the information provided, nor any loss arising from any investment based on a recommendation, forecast, or any information supplied by any third party.
Bullish bounce in play?USD/ZAR has bounced off the pivot, which is a pullback support and could rise towards the 1st resistance, which is also a pullback resistance.
Pivot: 16.47287
1st Suport: 16.36251
1st Resistance: 16.65861
Disclaimer:
The opinions given above constitute general market commentary and do not constitute the opinion or advice of IC Markets or any form of personal or investment advice.
Any opinions, news, research, analyses, prices, other information, or links to third-party sites contained on this website are provided on an "as-is" basis, are intended to be informative only, and are not advice, a recommendation, research, a record of our trading prices, an offer of, or solicitation for, a transaction in any financial instrument and thus should not be treated as such. The information provided does not involve any specific investment objectives, financial situation, or needs of any specific person who may receive it. Please be aware that past performance is not a reliable indicator of future performance and/or results. Past performance or forward-looking scenarios based upon the reasonable beliefs of the third-party provider are not a guarantee of future performance. Actual results may differ materially from those anticipated in forward-looking or past performance statements. IC Markets makes no representation or warranty and assumes no liability as to the accuracy or completeness of the information provided, nor any loss arising from any investment based on a recommendation, forecast, or any information supplied by any third party.
Bullish bounce off?USD/ZAR has bounced off the pivot, which is an overlap suport and could potentially rise towards the 1st resistance.
Pivot: 16.2789
1st Support: 16.23303
1st Resistance: 16.38774
Disclaimer:
The opinions given above constitute general market commentary and do not constitute the opinion or advice of IC Markets or any form of personal or investment advice.
Any opinions, news, research, analyses, prices, other information, or links to third-party sites contained on this website are provided on an "as-is" basis, are intended to be informative only, and are not advice, a recommendation, research, a record of our trading prices, an offer of, or solicitation for, a transaction in any financial instrument and thus should not be treated as such. The information provided does not involve any specific investment objectives, financial situation, or needs of any specific person who may receive it. Please be aware that past performance is not a reliable indicator of future performance and/or results. Past performance or forward-looking scenarios based upon the reasonable beliefs of the third-party provider are not a guarantee of future performance. Actual results may differ materially from those anticipated in forward-looking or past performance statements. IC Markets makes no representation or warranty and assumes no liability as to the accuracy or completeness of the information provided, nor any loss arising from any investment based on a recommendation, forecast, or any information supplied by any third party.
Bullish recovery from strong support?USD/ZAR has bounced off the pivot and could rise towards the 1st resistance.
Pivot: 16.34641
1st Support: 16.26109
1st Resistance: 16.47440
Disclaimer:
The opinions given above constitute general market commentary and do not constitute the opinion or advice of IC Markets or any form of personal or investment advice.
Any opinions, news, research, analyses, prices, other information, or links to third-party sites contained on this website are provided on an "as-is" basis, are intended to be informative only, and are not advice, a recommendation, research, a record of our trading prices, an offer of, or solicitation for, a transaction in any financial instrument and thus should not be treated as such. The information provided does not involve any specific investment objectives, financial situation, or needs of any specific person who may receive it. Please be aware that past performance is not a reliable indicator of future performance and/or results. Past performance or forward-looking scenarios based upon the reasonable beliefs of the third-party provider are not a guarantee of future performance. Actual results may differ materially from those anticipated in forward-looking or past performance statements. IC Markets makes no representation or warranty and assumes no liability as to the accuracy or completeness of the information provided, nor any loss arising from any investment based on a recommendation, forecast, or any information supplied by any third party.
USDZAR — Buying the Pullback [Quantum Algo]USDZAR based out at the 16.20 lows, ran a recovery leg up toward 16.49, then pulled back. Price retraced into a demand shelf near 16.29 and held, firing the Buy. This is a pullback continuation long: the recovery built higher lows off the base, price has come back to test demand, and the play is to buy the hold and ride the next leg back toward the range highs.
Why this setup works — three confluences:
Demand rejection on the retrace. Price pulled back into the demand zone and held instead of returning to the 16.20 lows. This is where buyers step back in — the Buy printed on the reaction, giving a defined floor to lean risk against rather than chasing the recovery high.
Higher-low structure off the base. The move off 16.20 built a clean sequence of higher lows. Buying this pullback sits with the dominant short-term direction, joining the recovery rather than fading it.
Open room back to prior structure. Above entry there's room up toward the 16.53 zone, the last swing area and the logical draw. Defined risk below demand, asymmetric room up to structure.
Trade management:
Entry: 16.2875 (rejection off demand)
SL: 16.1700 (below the demand shelf)
TP1: 16.4200 — take 50% off, move stop to breakeven
TP2: 16.5335 — 100% exit at the target zone
R:R: ~2.1:1 to full target
Invalidation:
A 2h close back below 16.1700. That breaks the demand shelf and the higher-low sequence off the base — sellers reclaim control, continuation thesis dead, just out.
The lesson:
The pullback is where patience pays. When a market recovers off a base and stacks higher lows, chasing the bounce means buying into resistance — but waiting for price to retrace into demand gets you a discount entry with risk defined below the shelf. One caveat that applies here directly: mind the calendar. High-impact news can invalidate clean technical structure in a single candle, so size for the event risk, not just the chart.
Signal fired. We took it. Update coming.
Disclaimer: Not financial advice. This idea is shared for educational purposes only. Trading leveraged instruments carries substantial risk. Past performance is not indicative of future results. Always do your own research and manage your own risk.
Bullish bounce emerging?USD/ZAR is falling towards the pivot, a pullback support that aligns with the 61.8% Fibonacci retracement and could bounce towards the 1st resistance.
Pivot: 16.29252
1st Support: 16.16028
1st Resistance: 16.43050
Disclaimer:
The opinions given above constitute general market commentary and do not constitute the opinion or advice of IC Markets or any form of personal or investment advice.
Any opinions, news, research, analyses, prices, other information, or links to third-party sites contained on this website are provided on an "as-is" basis, are intended to be informative only, and are not advice, a recommendation, research, a record of our trading prices, an offer of, or solicitation for, a transaction in any financial instrument and thus should not be treated as such. The information provided does not involve any specific investment objectives, financial situation, or needs of any specific person who may receive it. Please be aware that past performance is not a reliable indicator of future performance and/or results. Past performance or forward-looking scenarios based upon the reasonable beliefs of the third-party provider are not a guarantee of future performance. Actual results may differ materially from those anticipated in forward-looking or past performance statements. IC Markets makes no representation or warranty and assumes no liability as to the accuracy or completeness of the information provided, nor any loss arising from any investment based on a recommendation, forecast, or any information supplied by any third party.
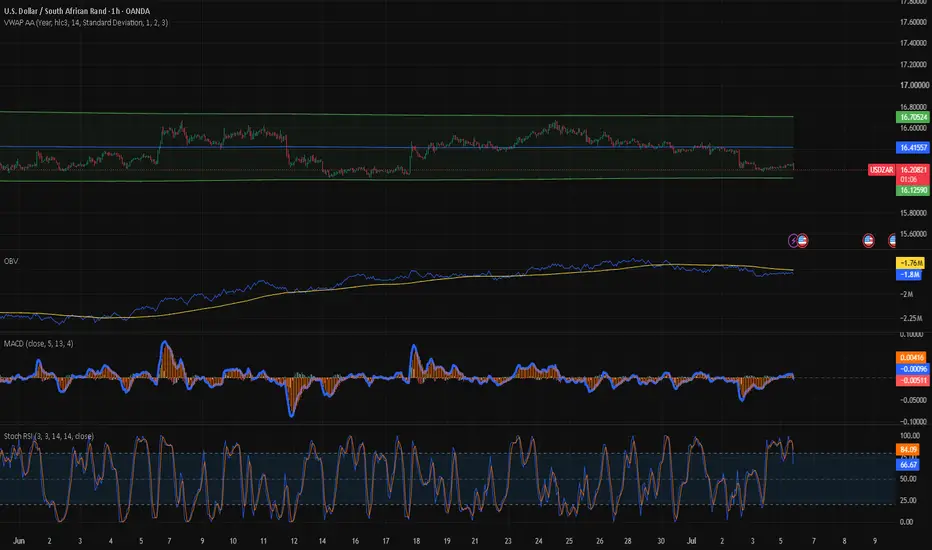
Weekly USDZAR Insight for Treasury and TradersUSDZAR starts the week near 16.25, sitting close to the lower edge of its recent trading range. The rand has benefited from a softer dollar, reduced expectations of near-term Federal Reserve tightening, and supportive performance in the South African bond market. Reuters reported that the dollar traded near two-week lows after weaker US jobs data reduced rate-hike expectations, while South Africa’s rand firmed into the end of last week on the same theme.
The week-ahead picture favours a controlled USDZAR range between 16.13 and 16.42, with a downside bias while price remains below the anchored VWAP midline around 16.41. The tactical risk is that USDZAR is stretched on the daily stochastic RSI, which makes the pair vulnerable to a corrective bounce before a cleaner move lower develops.
The Macro
The global driver remains the US dollar. June US payrolls rose by only 57,000, with downward revisions to prior months, reinforcing the view that the US labour market is cooling. That matters for USDZAR because weaker US data lowers the probability of additional Fed tightening and reduces pressure on high-carry emerging-market currencies.
South Africa’s domestic macro picture remains supportive for carry, although inflation has moved higher. Stats SA reported that CPI rose to 4.5% y/y in May, up from 4.0% in April, the highest level since July 2024. This keeps SARB policy restrictive and supports the rand’s yield advantage, but it also reduces the room for aggressive rate cuts.
Bond markets confirm that South Africa’s risk premium has compressed. 10-year yield at 8.365%, the 20-year at 8.920%, and the 30-year at 8.805%. The curve remains high-yielding, but the one-month performance shows meaningful declines across the long end, with the 10-year down about 4.01%, the 20-year down 5.11%, and the 30-year down 4.91%. This supports the rand through real-money demand for duration and improved sovereign risk perception. Trading Economics also noted the 10-year yield around the mid-8% area, close to recent lows, while inflation expectations remain an important watchpoint.
Technical Summary
The daily chart shows USDZAR within a broad, anchored VWAP band since the start of the year. Price is trading below the VWAP midline around 16.41, with the lower band near 16.14 and the upper band near 16.70. This structure defines the week’s trading map. Below 16.41, rallies look corrective. Near 16.13 to 16.18, exporters should expect stronger rand-profit-taking and importer demand.
The 4-hour chart shows USDZAR pressing into the lower VWAP band near 16.13 after rejecting the 16.60-16.70 area in late June. OBV has improved relative to its lows, but price has not followed higher, suggesting that buying interest lacks trend confirmation. MACD remains below the zero line but is turning upward, suggesting reduced bearish momentum rather than a confirmed bullish reversal.
The 1-hour chart is more tactical. Price is consolidating around 16.23 to 16.25, below the 1-hour VWAP midline at 16.42. Stochastic RSI is elevated, which limits the quality of fresh short-USD entries at current levels. A rebound into 16.32 to 16.41 would provide a cleaner level for exporters to increase hedge cover.
Forward Market and Treasury Implications
The forward curve remains heavily positive, reflecting South Africa’s interest-rate premium. Approximate midpoints are 453.8 points for 1M, 1215 points for 3M, 2400.7 points for 6M, and 4706 points for 12M. Using spot at 16.2497, this implies approximate outright levels of 16.70 for 1M, 17.46 for 3M, 18.65 for 6M, and 20.96 for 12M, depending on bank pricing and credit spreads.
For importers, the forward points are expensive, but spot is near the lower end of the recent range. This favours partial cover rather than full exposure. A practical approach would be to secure near-term USD needs on dips toward 16.18-16.13, while leaving some flexibility for a possible test of 16.00. Importers with low hedge ratios should treat a daily close above 16.42 as a signal to raise protection.
For exporters, current spot levels are less attractive for aggressive conversion. Exporters can use rebounds toward 16.35-16.42 to layer forward sales, especially where budget rates are below current forward outrights. A move toward 16.60 to 16.70 would represent a stronger hedge opportunity, as that zone aligns with the upper anchored VWAP area and recent supply.
Scenarios for the week ahead
The bullish ZAR case rests on continued dollar softness, stable risk sentiment, and further demand for South African bonds. In this case, USDZAR breaks the 16.13-16.18 support area and trades toward 16.00. This scenario gains credibility while US yields ease and the 10-year SAGB remains anchored near the mid-8% area.
The bearish ZAR case is a tactical USDZAR rebound. Daily momentum is stretched, and the pair is testing the lower VWAP band. A close back above 16.41 would shift the market toward 16.60 to 16.70, where exporters are likely to reappear. A move through 16.70 would signal that the recent rand-supportive bond-and-dollar dynamic is losing momentum.
USDZAR — Short at Supply Rejection [Quantum Algo]Read the chart, Q — USDZAR 2h, forex. Sell fired at overhead supply around 16.45 after the range bounce failed. Levels eyeballed off the zone and the target box; swap in your exact marks if you've got them.
Title:
USDZAR — Short at Supply Rejection
Context:
USDZAR has been rotating in a wide 16.15–16.66 range for weeks. Price rallied off the 16.35 lows, pushed back up into an overhead supply block near 16.45, and stalled. The rejection off that zone fired the Sell. This is a range short: fade the top of the balance, target the mid and the range low where liquidity rests.
Why this setup works — three confluences:
Supply rejection at range resistance. Price tapped the overhead supply block and failed to break through. This zone has capped rallies before, so it's a level with memory — sellers step back in here, and the reaction printed on the tap rather than a guess.
Selling from the top of the range. With the market rotating rather than trending, the highest-probability play is fading the extremes. Shorting into resistance keeps risk tight against the range high and gives the trade the full width of the balance to work.
Liquidity pooled below. Beneath entry there's an air pocket down to the 16.32 shelf, then the 16.22 zone sitting as resting liquidity at the lower boundary. Defined risk above the zone, asymmetric room down to the target.
Trade management:
Entry: 16.4500 (rejection off supply)
SL: 16.5050 (above the zone)
TP1: 16.3200 — take 50% off, move stop to breakeven
TP2: 16.2180 — 100% exit at the range-low liquidity
R:R: ~4.2:1 to full target
Invalidation:
A 2h close back above 16.5050. That reclaims the supply zone and puts price back inside the upper half of the range with momentum — thesis dead, no argument, just out.
The lesson:
In a range, the edge is patience at the edges. The middle is noise; the boundaries are where risk is definable and reward is asymmetric. Wait for price to reach a level that has rejected before, let it prove the rejection, and set your stop where being wrong is cheap. You don't need to predict the breakout — you need to get paid while the range holds and be out fast when it doesn't.
Signal fired. We took it. Update coming.
Disclaimer: Not financial advice. This idea is shared for educational purposes only. Trading leveraged instruments carries substantial risk. Past performance is not indicative of future results. Always do your own research and manage your own risk.
Bullish bounce off?USD/ZAR is falling towards the pivot, which is an overlapping support and could bounce towards the 1st resistance.
Pivot: 16.32892
1st Support: 16.23998
1st Resistance: 16.51926
Disclaimer:
The opinions given above constitute general market commentary and do not constitute the opinion or advice of IC Markets or any form of personal or investment advice.
Any opinions, news, research, analyses, prices, other information, or links to third-party sites contained on this website are provided on an "as-is" basis, are intended to be informative only, and are not advice, a recommendation, research, a record of our trading prices, an offer of, or solicitation for, a transaction in any financial instrument and thus should not be treated as such. The information provided does not involve any specific investment objectives, financial situation, or needs of any specific person who may receive it. Please be aware that past performance is not a reliable indicator of future performance and/or results. Past performance or forward-looking scenarios based upon the reasonable beliefs of the third-party provider are not a guarantee of future performance. Actual results may differ materially from those anticipated in forward-looking or past performance statements. IC Markets makes no representation or warranty and assumes no liability as to the accuracy or completeness of the information provided, nor any loss arising from any investment based on a recommendation, forecast, or any information supplied by any third party.
Downside pressure intensifies?USD/ZAR is rising towards the pivot, which is an overlap resistance and could reverse towards the 1st support.
Pivot: 16.51108
1st Support: 16.65866
1st Resistance: 16.38023
Disclaimer:
The opinions given above constitute general market commentary and do not constitute the opinion or advice of IC Markets or any form of personal or investment advice.
Any opinions, news, research, analyses, prices, other information, or links to third-party sites contained on this website are provided on an "as-is" basis, are intended to be informative only, and are not advice, a recommendation, research, a record of our trading prices, an offer of, or solicitation for, a transaction in any financial instrument and thus should not be treated as such. The information provided does not involve any specific investment objectives, financial situation, or needs of any specific person who may receive it. Please be aware that past performance is not a reliable indicator of future performance and/or results. Past performance or forward-looking scenarios based upon the reasonable beliefs of the third-party provider are not a guarantee of future performance. Actual results may differ materially from those anticipated in forward-looking or past performance statements. IC Markets makes no representation or warranty and assumes no liability as to the accuracy or completeness of the information provided, nor any loss arising from any investment based on a recommendation, forecast, or any information supplied by any third party.
Bullish momentum to continue?USD/ZAR has reacted off the pivot and could potentially rise towards the 1st resistance.
Pivot: 16.465
1st Support: 16.326
1st Resistance: 16.843
Disclaimer:
The opinions given above constitute general market commentary and do not constitute the opinion or advice of IC Markets or any form of personal or investment advice.
Any opinions, news, research, analyses, prices, other information, or links to third-party sites contained on this website are provided on an "as-is" basis, are intended to be informative only, and are not advice, a recommendation, research, a record of our trading prices, an offer of, or solicitation for, a transaction in any financial instrument and thus should not be treated as such. The information provided does not involve any specific investment objectives, financial situation, or needs of any specific person who may receive it. Please be aware that past performance is not a reliable indicator of future performance and/or results. Past performance or forward-looking scenarios based upon the reasonable beliefs of the third-party provider are not a guarantee of future performance. Actual results may differ materially from those anticipated in forward-looking or past performance statements. IC Markets makes no representation or warranty and assumes no liability as to the accuracy or completeness of the information provided, nor any loss arising from any investment based on a recommendation, forecast, or any information supplied by any third party.
Can the Rand Break 16 Against a Hawkish Fed?The rand is trading near 16.3 per dollar, close to its strongest level since early March and up roughly 9% against the dollar over the past year. That strength leaves USD/ZAR caught in a genuine tug-of-war. Local and global forces are pulling the rand higher, while a hawkish Federal Reserve is working to cap it. The near-term question is whether the pair can break below 16.00, or whether the dollar reasserts itself.
Several forces favor the rand. The preliminary US-Iran peace deal reopened the Strait of Hormuz and crashed oil prices, easing global inflation fears and reviving appetite for risk-sensitive emerging-market currencies. A broadly weaker dollar adds to the tailwind. Domestically, the South African Reserve Bank raised its benchmark rate to 7% on May 28, its first hike in three years, after May inflation climbed to 4.5%. That higher rate hands the rand a real carry cushion, and the oil relief has since softened expectations from two further hikes to one.
The counterweight is US monetary policy. Chair Kevin Warsh's Fed is holding at 3.50% to 3.75% for a fourth straight meeting, with a hawkish posture and live market bets on higher rates keeping the dollar firm. The result is range-bound trading rather than a clean trend. Societe Generale captures the tactical setup well: sell USD/ZAR rallies near the 200-day moving average, with scope for a move below 16.00 if risk sentiment holds after the Fed. The swing factors are the durability of the Iran agreement and whether the Fed validates the hike bets.
The honest read is that the rand's strength is real but conditional, not structural. The bull case of risk appetite, cheaper oil, attractive carry, and a soft dollar currently has the upper hand, and a break below 16.00 is plausible if the peace holds. But the position is exposed to two clear reversals: a collapse of the Iran deal that sends oil higher, or a Fed that turns genuinely aggressive. This is best treated as a tactical carry-and-sentiment trade, selling dollar rallies into resistance as Societe Generale suggests, rather than a one-way bet that the rand is breaking the dollar's grip.
USD/ZAR 1D: Macro Support Holds, Trendline Break Next?USD/ZAR is sitting at a clean decision point on the daily chart.
The pair has defended the 16.20 macro support shelf again and is now pushing into the descending trendline that has capped the lower-high structure since April.
Current price is near 16.50, with RSI around 53.5. That means momentum has reclaimed the neutral zone, but it has not yet expanded enough to confirm a full trend reversal.
The key level is 16.50–16.55.
If USD/ZAR closes above 16.55, the trendline breaks and upside opens toward 16.80, then 17.20.
If price rejects 16.50–16.55 and closes back below 16.35, this becomes another lower-high trap, and the market likely rotates back toward 16.20.
Fundamental context :
The macro backdrop is balanced. The Fed remains firm with rates at 3.50%–3.75%, while inflation remains elevated. SARB’s 7% policy rate supports rand carry, but oil-driven inflation and global risk uncertainty can weaken that advantage.
Could we see a reversal from here?USD/ZAR is reacting off the pivot, which is an overlap resistance and could reverse towards the 1st support.
Pivot: 16.46535
1st Support: 16.24077
1st Resistance: 16.70203
Disclaimer:
The opinions given above constitute general market commentary and do not constitute the opinion or advice of IC Markets or any form of personal or investment advice.
Any opinions, news, research, analyses, prices, other information, or links to third-party sites contained on this website are provided on an "as-is" basis, are intended to be informative only, and are not advice, a recommendation, research, a record of our trading prices, an offer of, or solicitation for, a transaction in any financial instrument and thus should not be treated as such. The information provided does not involve any specific investment objectives, financial situation, or needs of any specific person who may receive it. Please be aware that past performance is not a reliable indicator of future performance and/or results. Past performance or forward-looking scenarios based upon the reasonable beliefs of the third-party provider are not a guarantee of future performance. Actual results may differ materially from those anticipated in forward-looking or past performance statements. IC Markets makes no representation or warranty and assumes no liability as to the accuracy or completeness of the information provided, nor any loss arising from any investment based on a recommendation, forecast, or any information supplied by any third party.
Bullish bounce off?USD/ZAR has bounced off the pivot, which is a pullback support that aligns with the 38.2% Fibonacci retracement and could rise towards the 1st resistance, which is a swing high resistance.
Pivot: 16.46439
1st Support: 16.34911
1st Resistance: 16.74741
Disclaimer:
The opinions given above constitute general market commentary and do not constitute the opinion or advice of IC Markets or any form of personal or investment advice.
Any opinions, news, research, analyses, prices, other information, or links to third-party sites contained on this website are provided on an "as-is" basis, are intended to be informative only, and are not advice, a recommendation, research, a record of our trading prices, an offer of, or solicitation for, a transaction in any financial instrument and thus should not be treated as such. The information provided does not involve any specific investment objectives, financial situation, or needs of any specific person who may receive it. Please be aware that past performance is not a reliable indicator of future performance and/or results. Past performance or forward-looking scenarios based upon the reasonable beliefs of the third-party provider are not a guarantee of future performance. Actual results may differ materially from those anticipated in forward-looking or past performance statements. IC Markets makes no representation or warranty and assumes no liability as to the accuracy or completeness of the information provided, nor any loss arising from any investment based on a recommendation, forecast, or any information supplied by any third party.
Bullish bounce off?USD/ZAR has bounced off the pivot, which is a pullback suport that aligns with the 38.2% Fibonacci retracement and could rise towards the 1st resistance, which acts as a swing high resistance.
Pivot: 16.46439
1st Support: 16.34911
1st Resistance: 16.74741
Disclaimer:
The opinions given above constitute general market commentary and do not constitute the opinion or advice of IC Markets or any form of personal or investment advice.
Any opinions, news, research, analyses, prices, other information, or links to third-party sites contained on this website are provided on an "as-is" basis, are intended to be informative only, and are not advice, a recommendation, research, a record of our trading prices, an offer of, or solicitation for, a transaction in any financial instrument and thus should not be treated as such. The information provided does not involve any specific investment objectives, financial situation, or needs of any specific person who may receive it. Please be aware that past performance is not a reliable indicator of future performance and/or results. Past performance or forward-looking scenarios based upon the reasonable beliefs of the third-party provider are not a guarantee of future performance. Actual results may differ materially from those anticipated in forward-looking or past performance statements. IC Markets makes no representation or warranty and assumes no liability as to the accuracy or completeness of the information provided, nor any loss arising from any investment based on a recommendation, forecast, or any information supplied by any third party.