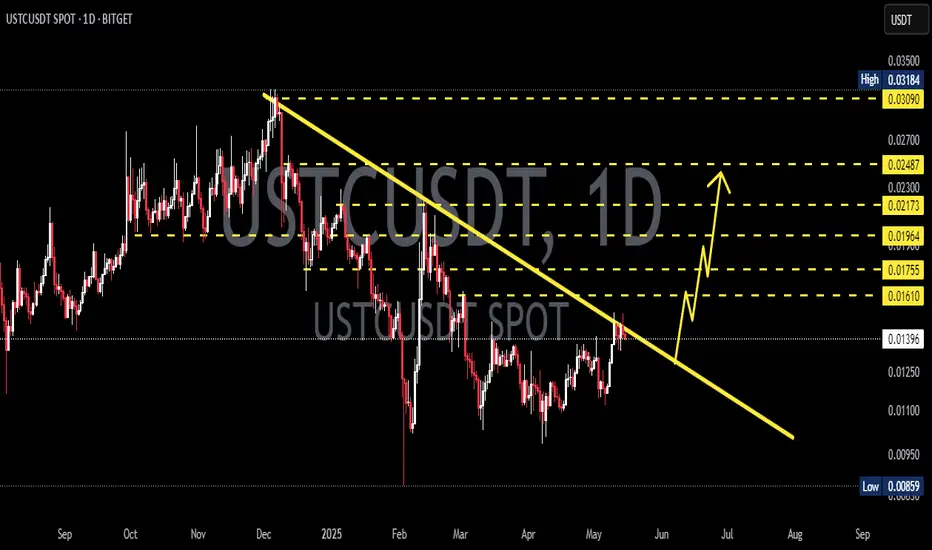
USTC Major Descending Trendline — Breakout or Rejection?💵 Coin: OTC:USTC #USTC
💱 Pair: USTC/USDT
⏳ Time Frame: 3D
📐 Pattern: Descending Trendline
📍 Current Price: around $0.00587
🎯 Key Resistance: $0.00670 → $0.00740 → $0.00920
🟢 Major Resistance: $0.01100 → $0.01300 → $0.01440 → $0.01640
🔻 Key Support: $0.00500–$0.00430
---
📐 Pattern Description — Descending Trendline
📉 The chart shows a Descending Trendline formed by a series of lower highs, with the yellow trendline acting as the primary dynamic resistance.
As long as price remains be
In-depth trading ideas
Will this $USTC retest hold, or are you expecting a fake out?🔥 #USTC — Descending Channel Breakout & Retest in Progress! 80%+ Rally Loading? 🚀📈
OTC:USTC (TerraClassicUSD/USDT) has broken out of its multi-month Descending Channel on the 1D chart and is currently undergoing a key retest phase!
Price action spiked above the upper resistance trendline and is now pulling back to test the broken trendline as new support. A successful bounce from this retest zone could ignite a powerful bullish wave toward major targets! 🎯
💵 Coin: USTC (TerraClassicUSD) / U
USTC/USDT (1h) Approaching a Bullish Pennant BreakoutUSTC/USDT is consolidating inside a bullish pennant / symmetrical triangle on the 1H chart after a sharp impulsive move higher. Price is forming lower highs beneath descending resistance while maintaining higher lows along the rising support, with the structure now tightening near the apex around $0.0057–$0.0058.
A confirmed breakout and hold above the upper trendline could trigger a bullish continuation toward the $0.0066–$0.0068 target area. A breakdown below the rising support would weaken t
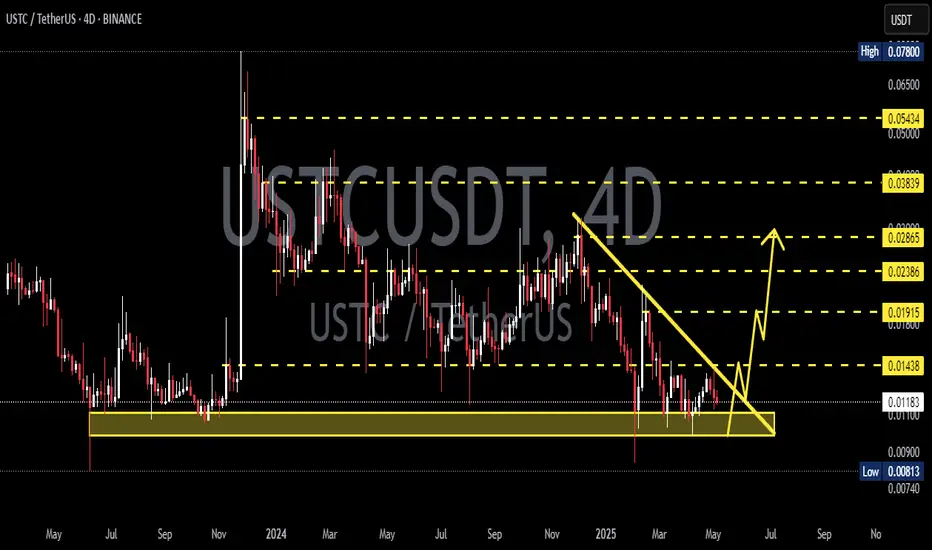
USTC/USDT — Key Demand Zone: Rebound or Breakdown Toward?USTC is once again trading at a crucial demand zone (0.0105 – 0.0115 USDT) on the 4D chart (Binance). This area has repeatedly acted as a strong support since 2024, absorbing heavy selling pressure and triggering notable rebounds.
This zone is not just a normal support — it’s an accumulation area that has historically sparked strong bounces. Long downside wicks confirm liquidity sweeps, followed by quick recoveries, signaling active demand around this region.
---
🔎 Structure & Pattern
1. Ran
USTC/USDTKey Level Zone: 0.016650 - 0.016850
LMT v2.0 detected.
The setup looks promising—price previously trended upward with rising volume and momentum, then retested this zone cleanly. This presents an excellent reward-to-risk opportunity if momentum continues to align.
Introducing LMT (Levels & Momentum Trading)
- Over the past 3 years, I’ve refined my approach to focus more sharply on the single most important element in any trade: the KEY LEVEL.
- While HMT (High Momentum Trading) served me well—
USTC/USDTKey Level Zone: 0.013080 - 0.013350
LMT v2.0 detected.
The setup looks promising—price previously trended upward with rising volume and momentum, then retested this zone cleanly. This presents an excellent reward-to-risk opportunity if momentum continues to align.
Introducing LMT (Levels & Momentum Trading)
- Over the past 3 years, I’ve refined my approach to focus more sharply on the single most important element in any trade: the KEY LEVEL.
- While HMT (High Momentum Trading) served me well—
USTC/USDTKey Level Zone: 0.012500 - 0.012700
LMT v2.0 detected.
The setup looks promising—price previously trended upward with rising volume and momentum, then retested this zone cleanly. This presents an excellent reward-to-risk opportunity if momentum continues to align.
Introducing LMT (Levels & Momentum Trading)
- Over the past 3 years, I’ve refined my approach to focus more sharply on the single most important element in any trade: the KEY LEVEL.
- While HMT (High Momentum Trading) served me well—
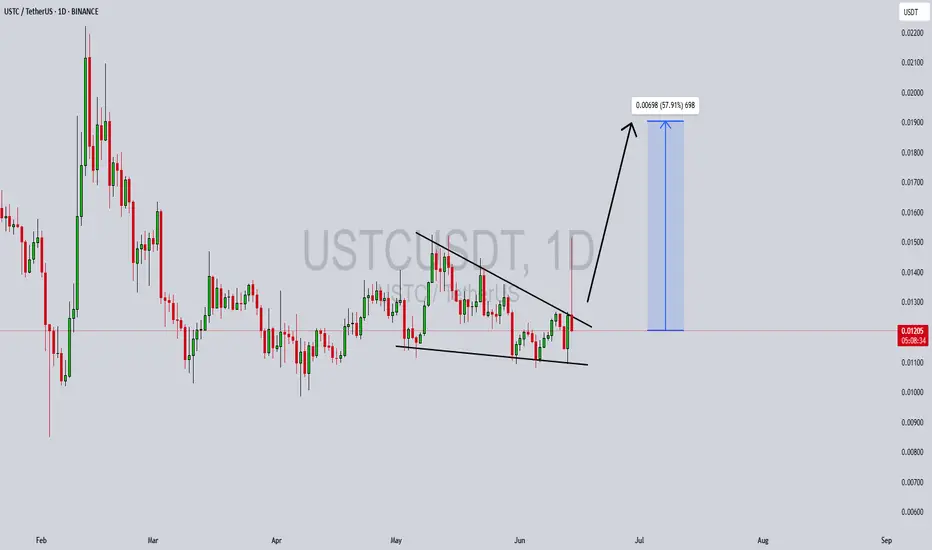
USTCUSDT Forming Bullish WaveUSTCUSDT is currently displaying a bullish wave pattern, indicating the formation of a higher low structure that typically leads to strong continuation moves. This pattern, combined with increasing volume, suggests growing investor interest and the potential for a significant upside move. Technically, the pair looks well-positioned to achieve a breakout, with projected gains estimated between 40% to 50%+, making this a highly attractive opportunity for both short-term traders and long-term inves
$USTC Forming Ascending Triangle🚨 OTC:USTC Forming Ascending Triangle 🚨
OTC:USTC is forming an ascending triangle pattern and is approaching a key red resistance zone. A breakout above this level could signal a strong bullish move.
📈 Technical Overview:
Pattern: Ascending Triangle
Resistance Zone: Red area currently being tested.
REPEG ? Imagine that some of the stablecoin going to be swing .... you should know the coin which have had at least more stable than other.
That price 0,15 is good level for last 2 years time and show activity
CVD are not decreasing much , just nobody buy while snow ball falling, that is reason for hitting out weakhands. It can't fall because no one sell it in a big quantities , that price it's not about real estimation.
CZ says that FTX been involved in crash of Luna and DO Kwon go
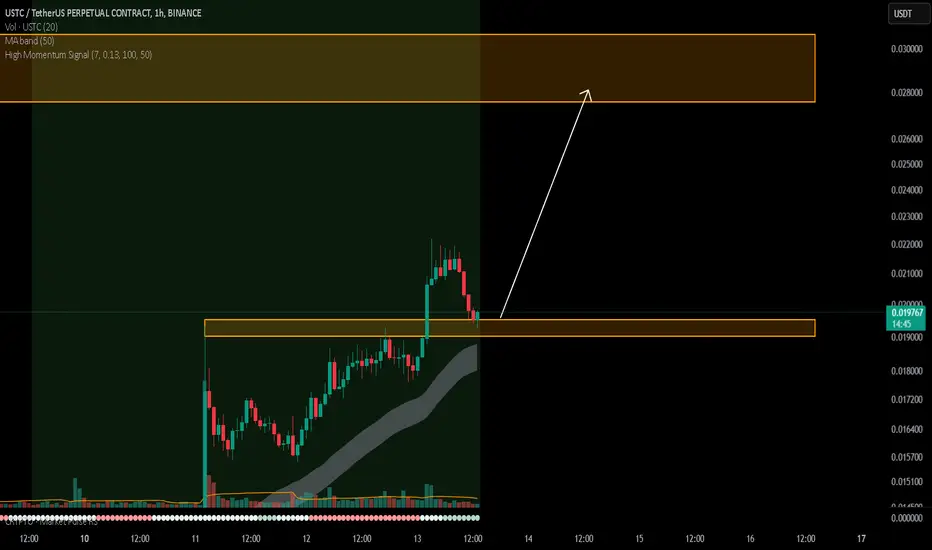
USTC/USDTKey Level Zone: 0.019000 - 0.019500
HMT v5 detected. The setup looks promising, supported by a previous upward/downward trend with increasing volume and momentum, presenting an excellent reward-to-risk opportunity.
HMT (High Momentum Trending):
HMT is based on trend, momentum, volume, and market structure across multiple timeframes. It highlights setups with strong potential for upward movement and higher rewards.
Whenever I spot a signal for my own trading, I’ll share it. Please note that co
USTC/USDTKey Level Zone: 0.017160 - 0.017440
HMT v5 detected. The setup looks promising, supported by a previous upward/downward trend with increasing volume and momentum, presenting an excellent reward-to-risk opportunity.
HMT (High Momentum Trending):
HMT is based on trend, momentum, volume, and market structure across multiple timeframes. It highlights setups with strong potential for upward movement and higher rewards.
Whenever I spot a signal for my own trading, I’ll share it. Please note that co
USTC trade planUSTC trade plan
USTC/USDT is not going to break this range resistance in one attempt. A 15-30% drop is coming.
key points
- strong resistance holding
- expecting a rejection and pullback
- risk is under your control, manage accordingly
- not financial advice, do your own research
trade wisely, stay disciplined
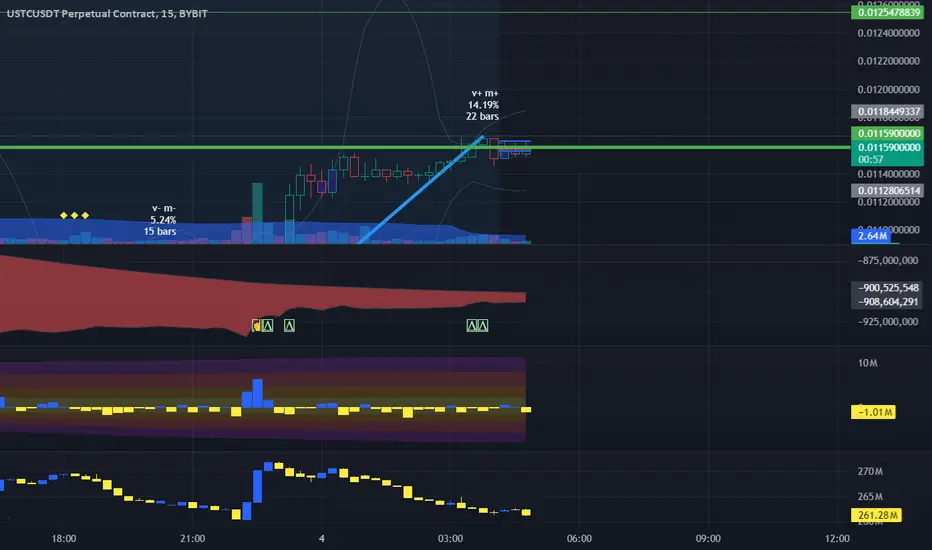
LONG USTC Bullish setup, - shorts are retreating and we so lot of times just go through a levels.
Havn't high volumes, that a strange , but probably some still believe in falling
we have serial of dodji on 1H TF, each one higher then previos , it show right befor big move
We going to take a hammer on a day ( still not ) but 4 hours remain , which going to mean high move to up too , about 0,0125
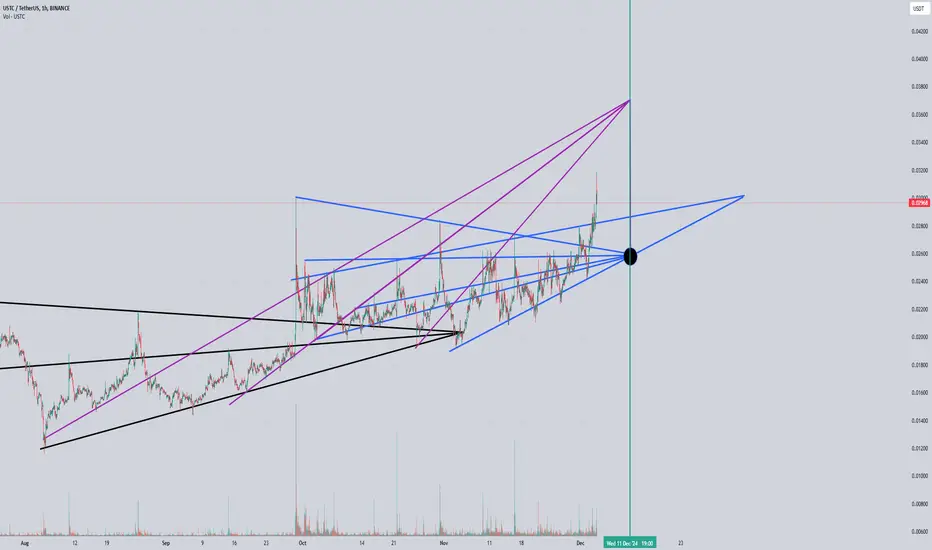
USTC - BLACKHOLL UPDATEA triangular system works perfectly on justs, you can also add a gann box there that intersects with the Dec 11-12 date, it will be a reversal zone, where to? Depends on where the price will be at that time, if down then strong growth, if there is a local high then the price will go down. This is a local situation, not thinking that it will somehow affect the trend globally. This can be useful to you for local trading as well as smart profit taking, my targets are strongly high as before
Trans