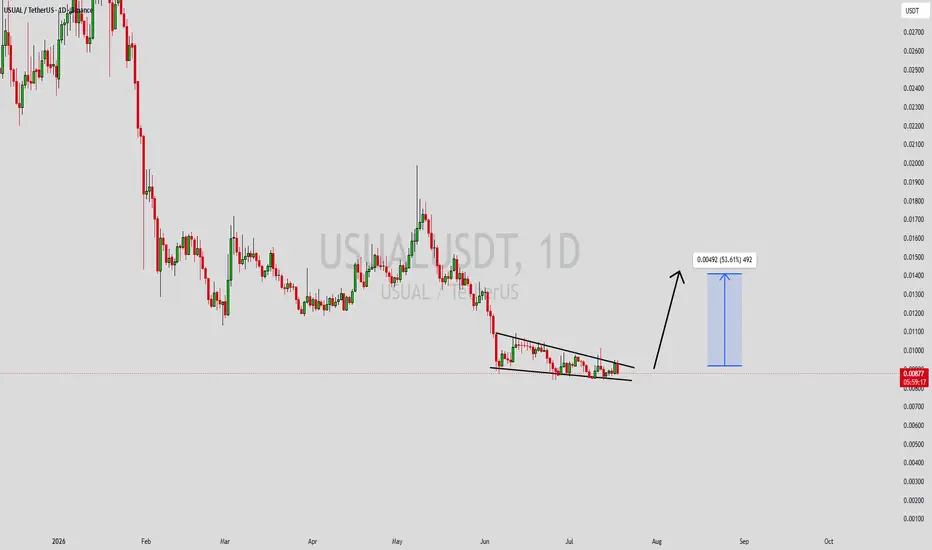
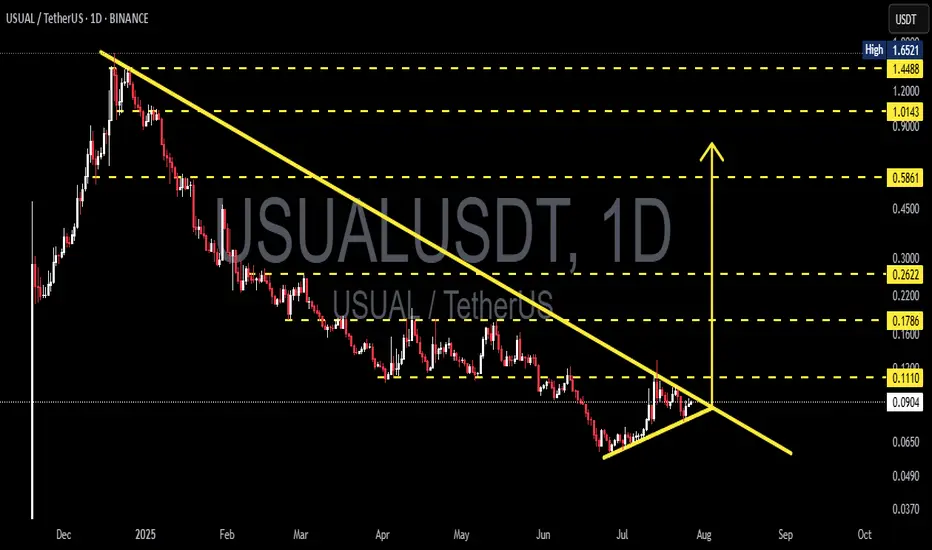
USUALUSDT Forming Falling WedgeUSUALUSDT is forming a clear falling wedge pattern, a classic bullish wave signal that often indicates an upcoming breakout. The price has been consolidating within a narrowing range, suggesting that selling pressure is gradually weakening while buyers are beginning to regain control. With consistent trading volume confirming accumulation at lower levels, the current setup hints at a potential bullish breakout in the near future. If the breakout is confirmed, the projected move could lead to an impressive gain of around 40% to 50%.
This falling wedge pattern is typically seen at the end of downtrends or corrective phases, signaling a potential shift in market sentiment from bearish to bullish. Traders closely watching USUALUSDT are noticing strengthening momentum as the price approaches a key breakout zone. Healthy trading volume further reinforces this setup, showing that market participants are positioning early in anticipation of a sustained upward move.
Growing investor interest in USUALUSDT reflects increasing confidence in the project's long-term potential and its current technical structure. If buyers successfully push the price above the wedge resistance with sustained volume, it could mark the beginning of a fresh bullish leg. The ongoing consolidation phase suggests steady accumulation, creating favorable conditions for a strong continuation rally once the breakout is confirmed.
Traders may find this an attractive medium-term opportunity, especially as the falling wedge pattern nears completion and buying pressure continues to build. A confirmed breakout could attract additional market participation and accelerate the move toward the projected upside target.
✅ Show your support by hitting the like button.
✅ Leaving a comment below! (What is You opinion about this Coin)
Your feedback and engagement keep me inspired to share more insightful market analysis with you!
In-depth trading ideas
USUALUSDT Forming Falling WedgeUSUALUSDT is forming a clear falling wedge pattern, a classic bullish wave signal that often indicates an upcoming breakout. The price has been consolidating within a narrowing range, suggesting that selling pressure is weakening while buyers are beginning to regain control. With consistent volume confirming accumulation at lower levels, the setup hints at a potential bullish breakout soon. The projected move could lead to an impressive gain of around 90% to 100% once the price breaks above the wedge resistance.
This falling wedge pattern is typically seen at the end of downtrends or corrective phases, and it represents a potential shift in market sentiment from bearish to bullish. Traders closely watching USUALUSDT are noting the strengthening momentum as it nears a breakout zone. Strong trading volume adds confidence to this pattern, showing that market participants are positioning early in anticipation of a reversal.
Investors’ growing interest in USUALUSDT reflects rising confidence in the project's long-term fundamentals and current technical strength. If the breakout confirms with sustained volume, this could mark the start of a fresh bullish leg. The ongoing accumulation phase suggests that buyers are steadily taking control, while weakening selling pressure increases the probability of a sustained upward move.
Traders might find this a valuable setup for medium-term gains, especially as the falling wedge pattern approaches completion and buying momentum accelerates. A confirmed breakout above resistance could attract additional buying interest and potentially drive the price toward its projected upside target over the coming weeks.
✅ Show your support by hitting the like button!
✅ Leave a comment below! (What is your opinion about this coin?)
Your feedback and engagement keep me inspired to share more insightful market analysis with you!
USUALUSDT Forming Falling WedgeUSUALUSDT is forming a clear falling wedge pattern, a classic bullish wave signal that often indicates an upcoming breakout. The price has been consolidating within a narrowing range, suggesting that selling pressure is weakening while buyers are beginning to regain control. With consistent volume confirming accumulation at lower levels, the setup hints at a potential bullish breakout soon. The projected move could lead to an impressive gain of around 240% to 250% once the price breaks above the wedge resistance.
This falling wedge pattern is typically seen at the end of downtrends or corrective phases, and it represents a potential shift in market sentiment from bearish to bullish. Traders closely watching USUALUSDT are noting the strengthening momentum as it nears a breakout zone. The strong trading volume adds confidence to this pattern, showing that market participants are positioning early in anticipation of a reversal.
Investors’ growing interest in USUALUSDT reflects rising confidence in the project’s long-term fundamentals and current technical strength. If the breakout confirms with sustained volume, this could mark the start of a fresh bullish leg. Traders might find this a valuable setup for medium-term gains, especially as the wedge pattern completes and buying momentum accelerates.
✅ Show your support by hitting the like button and
✅ Leaving a comment below! (What is your opinion about this coin?)
Your feedback and engagement keep me inspired to share more insightful market analysis with you!
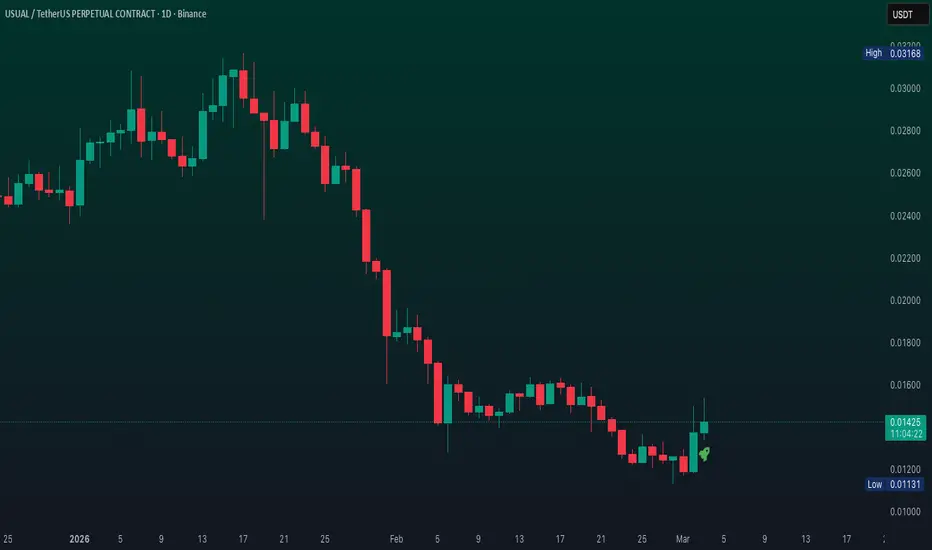
USUAL ENTERING INTO NEW CONFIRMED TRENDDepending on the recent trend and structure, USUAL looks to be entering an important confirmation phase, where accumulation starts turning into expansion. This shift gives the token a solid chance to break out if momentum continues building. There is huge chance for 30%+ increase.
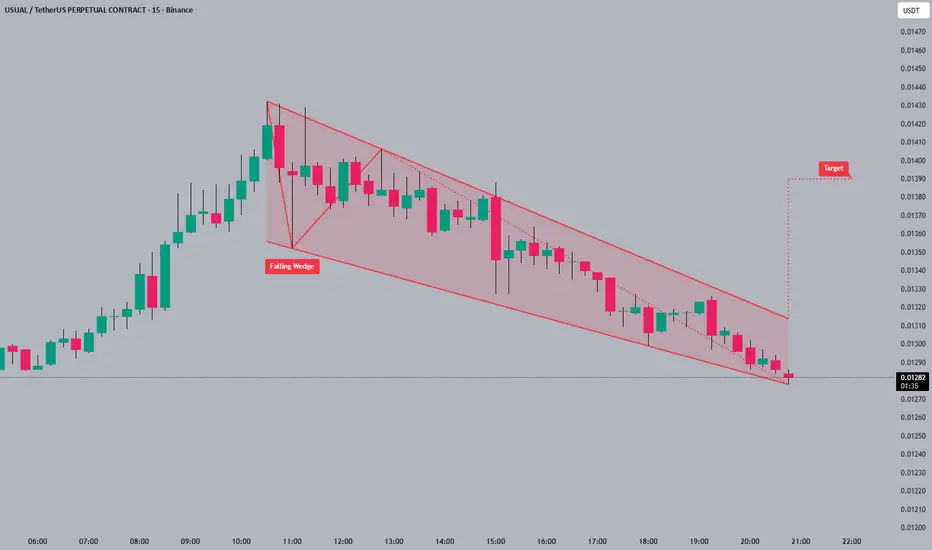
#USUAL#USUAL is currently testing the lower trendline of a falling wedge 📉 pattern. The falling wedge is typically a bullish reversal pattern 🐂, suggesting a potential breakout. If #USUAL breaks out, the next target is around 0.01400 🚀.
Patience is key🔑; wait for confirmation before making trading decisions.
#USUAL #crypto #trading #altcoin
USUALUSDT Forming Falling WedgeUSUALUSDT is forming a clear falling wedge pattern, a classic bullish reversal signal that often indicates an upcoming breakout. The price has been consolidating within a narrowing range, suggesting that selling pressure is weakening while buyers are beginning to regain control. With consistent volume confirming accumulation at lower levels, the setup hints at a potential bullish breakout soon. The projected move could lead to an impressive gain of around 190% to 200% once the price breaks above the wedge resistance.
This falling wedge pattern is typically seen at the end of downtrends or corrective phases, and it represents a potential shift in market sentiment from bearish to bullish. Traders closely watching USUALUSDT are noting the strengthening momentum as it nears a breakout zone. The good trading volume adds confidence to this pattern, showing that market participants are positioning early in anticipation of a reversal.
Investors’ growing interest in USUALUSDT reflects rising confidence in the project’s long-term fundamentals and current technical strength. If the breakout confirms with sustained volume, this could mark the start of a fresh bullish leg. Traders might find this a valuable setup for medium-term gains, especially as the wedge pattern completes and buying momentum accelerates.
✅ Show your support by hitting the like button and
✅ Leaving a comment below! (What is your opinion about this Coin?)
Your feedback and engagement keep me inspired to share more insightful market analysis with you!
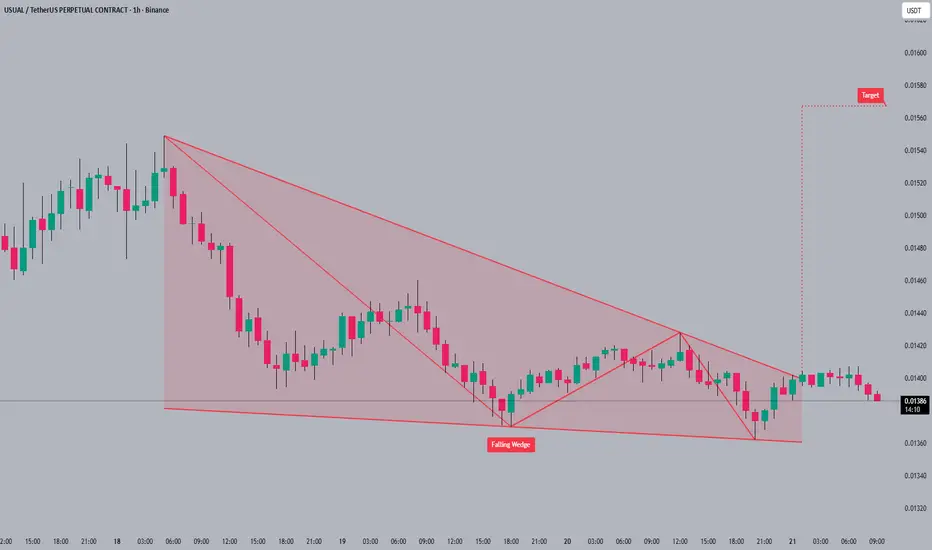
#USUAL#USUAL is consolidating in a falling wedge 📐 pattern, hinting at a potential breakout. The price action has been choppy 😥, but the pattern suggests a possible bullish reversal. Watch for a break above the wedge 💥 with a target near 0.01580.
A breakout from a falling wedge can be explosive if volume confirms the move.
#USUAL #crypto #trading #patterns
USUAL PERPETUAL TRADE BUY SETUP Long from $0.03700USUAL PERPETUAL TRADE
BUY SETUP
Long from $0.03700
Currently $0.03700
Targeting $0.041 or Above
(Trading plan IF USUAL
go down to $0.033 will add more longs)
Follow the notes for updates
In the event of an early exit,
this analysis will be updated.
Its not a Financial advice
USUALUSDT Forming Falling WedgeUSUALUSDT is forming a clear falling wedge pattern, a classic bullish reversal signal that often indicates an upcoming breakout. The price has been consolidating within a narrowing range, suggesting that selling pressure is weakening while buyers are beginning to regain control. With consistent volume confirming accumulation at lower levels, the setup hints at a potential bullish breakout soon. The projected move could lead to an impressive gain of around 90% to 100% once the price breaks above the wedge resistance.
This falling wedge pattern is typically seen at the end of downtrends or corrective phases, and it represents a potential shift in market sentiment from bearish to bullish. Traders closely watching USUALUSDT are noting the strengthening momentum as it nears a breakout zone. The good trading volume adds confidence to this pattern, showing that market participants are positioning early in anticipation of a reversal.
Investors’ growing interest in USUALUSDT reflects rising confidence in the project’s long-term fundamentals and current technical strength. If the breakout confirms with sustained volume, this could mark the start of a fresh bullish leg. Traders might find this a valuable setup for medium-term gains, especially as the wedge pattern completes and buying momentum accelerates.
✅ Show your support by hitting the like button and
✅ Leaving a comment below! (What is your opinion about this Coin?)
Your feedback and engagement keep me inspired to share more insightful market analysis with you!
USUALUSDT ReadyUSUALUSDT is forming a clear falling wedge pattern, a classic bullish reversal signal that often indicates an upcoming breakout. The price has been consolidating within a narrowing range, suggesting that selling pressure is weakening while buyers are beginning to regain control. With consistent volume confirming accumulation at lower levels, the setup hints at a potential bullish breakout soon. The projected move could lead to an impressive gain of around 40% to 50% once the price breaks above the wedge resistance.
This falling wedge pattern is typically seen at the end of downtrends or corrective phases, and it represents a potential shift in market sentiment from bearish to bullish. Traders closely watching USUALUSDT are noting the strengthening momentum as it nears a breakout zone. The good trading volume adds confidence to this pattern, showing that market participants are positioning early in anticipation of a reversal.
Investors’ growing interest in USUALUSDT reflects rising confidence in the project’s long-term fundamentals and current technical strength. If the breakout confirms with sustained volume, this could mark the start of a fresh bullish leg. Traders might find this a valuable setup for medium-term gains, especially as the wedge pattern completes and buying momentum accelerates.
✅ Show your support by hitting the like button and
✅ Leaving a comment below! (What is your opinion about this Coin?)
Your feedback and engagement keep me inspired to share more insightful market analysis with you!
USUALUSDT Forming Falling WedgeUSUALUSDT is forming a strong falling wedge pattern, which is widely recognized as a bullish reversal setup in technical analysis. This pattern occurs when price consolidates within narrowing trendlines, eventually leading to a breakout to the upside. The current structure indicates that selling pressure is weakening, while buying momentum is gradually building. With solid trading volume supporting this move, the breakout potential looks very promising.
The falling wedge pattern here suggests that USUALUSDT could soon witness a powerful upward surge, potentially delivering gains of 140% to 150%+. Such a setup is attractive to traders and investors who closely follow breakout strategies, as the reward-to-risk ratio looks highly favorable. The volume confirmation adds further confidence, showing that accumulation is already underway in this pair.
Market sentiment also appears to be turning positive as more investors are beginning to take interest in this project. If momentum continues in line with technical signals, USUALUSDT may see significant upside in the near term, making it an appealing candidate for both short-term trading opportunities and long-term investment positioning.
✅ Show your support by hitting the like button and
✅ Leaving a comment below! (What is You opinion about this Coin)
Your feedback and engagement keep me inspired to share more insightful market analysis with you!
USUALUSDT Forming Falling WedgeUSUALUSDT is currently displaying a falling wedge pattern, one of the most reliable bullish reversal signals in technical analysis. The narrowing price action indicates that selling pressure is fading, while buyers are gradually gaining strength. With trading volume remaining healthy, the setup points toward a potential breakout, with expected gains in the range of 90% to 100% once momentum fully shifts to the upside.
This structure often precedes strong rallies as it reflects accumulation by investors who anticipate significant upward movement. In the case of USUALUSDT, market participants are increasingly taking interest, positioning themselves ahead of a potential breakout. The wedge formation highlights the compression of price before expansion, which can fuel rapid gains when resistance is broken.
Investor sentiment around this project continues to improve, supported by consistent volume and growing market activity. This alignment of technical signals and investor participation strengthens the likelihood of a bullish move. Traders who monitor this setup closely may find a high-probability opportunity as the breakout level approaches.
In conclusion, USUALUSDT has all the elements of a bullish setup, with the falling wedge pattern pointing toward a breakout rally of 90% to 100%. Strong volume support and increasing investor confidence could push this pair into a powerful upward trajectory in the near term.
✅ Show your support by hitting the like button and
✅ Leaving a comment below! (What is You opinion about this Coin)
Your feedback and engagement keep me inspired to share more insightful market analysis with you!
USUALUSDT 1D#USUAL is moving within a falling wedge pattern on the daily chart. If it breaks out above the pattern resistance and the daily EMA50, the potential targets are:
🎯 $0.0829
🎯 $0.0997
🎯 $0.1133
🎯 $0.1268
🎯 $0.1461
⚠️ Always remember to use a tight stop-loss and follow proper risk management.
USUAL/USDT — End of Pressure? Breakout or Breakdown Ahead📊 Full Analysis (Daily Chart):
Since peaking around $1.65, USUAL/USDT has remained under heavy selling pressure, forming a clear long-term downtrend with a descending trendline acting as a major resistance. Price is now trading near $0.0614, exactly at the critical $0.05–0.07 support zone.
The structure is shaping into a descending triangle, where price keeps making lower highs while holding a flat support base. This pattern is often seen as a bearish continuation, but if bulls manage to break above the trendline with strong volume, it could trigger a major trend reversal.
---
🔼 Bullish Scenario (Potential Reversal)
Trigger: Daily close above $0.07–0.08 with convincing volume.
Extra confirmation: Successful retest of the broken trendline as new support.
Upside targets:
1. $0.1110 (minor resistance)
2. $0.1786 (mid supply zone)
3. $0.2622 – $0.5861 (major recovery levels if momentum expands).
Risk management: Stop loss below $0.05 to avoid false breakouts.
📌 Interpretation: A breakout could signal the end of prolonged selling, inviting bargain hunters and possibly triggering a short squeeze rally.
---
🔽 Bearish Scenario (Continuation of the Downtrend)
Trigger: Daily close below $0.05 with heavy selling volume.
Downside targets: $0.03 → $0.02 (psychological support levels + measured move projection of the descending triangle).
Risk management: For shorts, stop loss above $0.075–0.08.
📌 Interpretation: If the support base fails, the descending triangle confirms as a bearish continuation pattern, likely driving price to new lows.
---
🔎 Technical Pattern in Play
Descending Triangle: A structure often seen as bearish, but also a potential launchpad if broken upward with volume.
Breakout Case: A strong bullish breakout would flip market sentiment and shift momentum upward.
Breakdown Case: Failure to hold support would accelerate downside pressure.
---
🎯 Trading Outlook
USUAL/USDT is now at a make-or-break level. Price compression between the trendline and support is setting up for a decisive move. Patience is key here — waiting for a daily close with strong volume confirmation is safer than guessing the direction.
Short-term traders may play the current range, while swing traders should wait for a confirmed breakout or breakdown before committing to larger positions.
---
#USUAL #USUALUSDT #CryptoAnalysis #Altcoin #TechnicalAnalysis #Breakout #Bearish #Bullish #DescendingTriangle
USUAL · Futures Trading Trade-NumbersAre you going to focus on the short-term or the long-term?
Are you a day-trader or an investor?
How are you approaching this market?
Look at USUALUSDT: In our reality, this is a great opportunity. In our world, this is an awesome chart.
USUAL is trading at bottom prices but with a bullish bias. USUAL is now trading within the "opportunity buy zone." The best possible entry level before a major bullish cycle.
The bullish bias comes from the fact that the market already experienced a major bearish wave. This wave is hard to ignore on the chart (left side).
Since USUALUSDT already went through this corrective process, we know it doesn't need to go through the same. That's one.
The next one is the fact that prices are higher in August 2025 compared to the April low. A higher low. Sellers are not present. Nobody is selling at the bottom and that's why support is found higher. And, this is the second one, also supports higher prices.
_____
LONG USUALUSDT
ENTRY: 0.0660 - 0.0710 (STOP: 0.0655)
TARGETS: 0.0774, 0.1031, 0.1444, 0.1702, 0.1958
_____
Thanks a lot for your continued support.
If you enjoy the content, choose to follow me.
Questions are welcomed in the comments section. Opinions as well.
Namaste.
Usual Protocol 5000% Bullish Potential ExposedThe highest volume since December 2024 happened last month, July. This is a high volume bar that signals the bulls are back in the game.
As USUALUSDT was moving lower volume was also dropping. After the bottom was hit, volume did rise but on the buying side. The bearish wave lost its momentum and ran its course.
This is going to be a huge project. I should say, this trading pair will produce big gains. You can see with me the huge growth potential shown on the chart. These numbers are based on the 2024 high, and we have 3,000% and 5,000% potential for growth. Imagine what numbers we would get if we had data coming from 2021.
Some pairs I mention more than others because they are safe and have huge potential for growth. It is easier to choose if you see a pair often.
When in doubt, keep reading.
If you don't know what to choose and there are too many options, then you need to read some more. There is always time and the market always offers a second chance. Keep reading and everything becomes clear.
It is normal to not understand at first. It is normal to start understanding things after several weeks. It is very normal to have a map of what is happening after just a few months. You will be able to tell the difference easily from when you are reading and when you are not. The market is not going away. But, if you want to know what the market is actually doing, read @MasterAnanda
Thank you for your continued support.
Namaste.
USUALUSDT Ready to Explode? Major Breakout From Downtrend?USUALUSDT is currently displaying a very compelling technical structure on the daily timeframe. After a long downtrend since early 2025, the price is now forming an accumulation pattern with increasing buying pressure.
---
📊 Pattern & Chart Structure Overview:
🔹 Descending Triangle Formation:
The price has been forming a series of lower highs with a gradually rising base, indicating a classic compression or accumulation pattern that often precedes a major breakout.
🔹 Rising Buying Pressure:
Notice the formation of higher lows since early July—this suggests that buyers are gradually stepping in, despite the macro downtrend still intact.
🔹 Low Volume = High Breakout Potential:
Volume remains relatively low, which is typical in the final stages of consolidation. Once a breakout occurs, it’s likely to be accompanied by a significant spike in volume.
---
🟢 Bullish Scenario (Confirmed Breakout):
If the price breaks above the descending trendline (~0.1110) with a strong daily candle and increased volume, it may ignite a bullish move with the following targets:
🎯 Upside Targets:
1. 0.1786 – Previous consolidation resistance
2. 0.2622 – Psychological zone and prior seller control area
3. 0.5861 – Medium-term target if momentum builds
4. 1.0143 and 1.4488 – Long-term bullish targets upon full trend reversal
🚀 The upside potential is massive as the price has a lot of room above once resistance is broken.
---
🔴 Bearish Scenario (Failed Breakout):
If the price gets rejected at the descending resistance and breaks down below the ascending support:
📉 Downside Targets:
1. 0.0650 – Minor support from July's accumulation zone
2. 0.0490 – 0.0370 – Previous cycle lows and potential bounce zones
⚠️ A breakdown would invalidate the current accumulation setup and suggest sellers still dominate.
---
🔍 Conclusion & Strategy:
USUALUSDT is now at a critical decision zone. The combination of a descending triangle, rising higher lows, and low volume makes it clear that a major move is brewing.
📌 Breakout = Big swing trade opportunity
📌 Breakdown = Avoid entries, wait for lower support zones
---
📈 Trader Recommendations:
✅ Set alerts above 0.1110
✅ Confirm breakout with strong candle + volume
✅ Aggressive stop loss below 0.0750
✅ Swing trade targets based on historical resistance & fib levels
#USUALUSDT #CryptoBreakout #AltcoinSetup #DescendingTriangle #CryptoAnalysis #BullishSetup #BearishSetup #BreakoutIncoming #TechnicalAnalysis
USUALUSDT-26072025Below writing is a dummy text. Ignore that and see the video only.
===============================
Lorem Ipsum is simply dummy text of the printing and typesetting industry. Lorem Ipsum has been the industry's standard dummy text ever since the 1500s, when an unknown printer took a galley of type and scrambled it to make a type specimen book. It has survived not only five centuries, but also the leap into electronic typesetting, remaining essentially unchanged. It was popularised in the 1960s with the release of Letraset sheets containing Lorem Ipsum passages, and more recently with desktop publishing software like Aldus PageMaker including versions of Lorem Ipsum.