WTI Crude Oil — XTIUSD | Weekly Structure & Liquidity Map▪️ My read: Crude is mid-impulse, not mid-reversal. XTI ran off the July base at 71.90–74.30 and has repriced roughly 30 pts higher into the low-100s, now coiled at 103.19 in a tight consolidation directly beneath a clean overhead corridor. There is no graded supply between spot and the ★★ Bear Liquidity Cluster at 116.98–117.27 — the lone overhead pool on the board — which makes that zone the natural draw. Demand below is stacked and heavy: two POWER 10/10 bull clusters anchor the floor. Thin above, loaded below.
▪️ Below, the standout structure is the ★★★★ 8.1/10 VERY STRONG SUPPORT at 86.00 to 88.00 — 14 retests, sitting directly under the POWER 10/10 bull cluster and forming the primary reversal-long. Base case: while 98.00 holds, favor the trend-aligned push through the 104.59/107.26 pivots up into the 116.98–117.27 cluster — treat the first tag as a liquidity run, not a confirmed breakout, unless price reclaims and holds above 117.27. Lose 98.00 and the book inverts down toward the 86–90 confluence for the reaction long, with the 71.90–74.30 macro base as the deeper magnet. The Fed and the weekly EIA print are the wildcards that decide which side runs. Edges pay, the middle chops.
▪️ XTIUSD is trading near 103.19, up off the ~72 July low and mid-continuation after tagging ~108 and rotating back to the 101.94/104 pivot band. Price is coiled just under the 104.59 pivot with 107.26 and 110.15 as the next waypoints, and no graded supply until the Bear Liquidity Cluster at 116.98 to 117.27 — the single overhead pool. Below, the floor is loaded: a –2.9/10 FORMING SUPPORT · 2 retests around 98.00 to 100.00 is the first shelf, then a ★ 4.3/10 WEAK SUPPORT · 2 retests near 92.00 to 94.00 with the 95.66 pivot just above, a Bull Liquidity Cluster at 88.00 to 90.30 overlapping a ★★★★ 8.1/10 VERY STRONG SUPPORT · 14 retests at 86.00 to 88.00, a ★★★ 7.9/10 STRONG SUPPORT · 46 retests at 80.00 to 81.50, and a POWER 10/10 · 28.98% bull cluster at 71.90 to 74.30 overlapping a ★★★ 7.3/10 STRONG SUPPORT · 71 retests. Supply above is thin, demand below is heavier.
▪️ Primary outlook: ride the continuation, buy the deep demand on a flush. The yellow paths run price up through the 104.59/107.26 pivots toward the 116.98–117.27 cluster and, on strength, into fresh discovery above — the trend-aligned leg into the lone overhead pool to run stops. The red paths are the corrective leg: reject the cluster or lose 98.00, print a lower high, and roll down into the 86.00–90.30 confluence where the high-value long sits, with 95.66 as the first waypoint. Lose 86.00 and the 80.00–81.50 shelf then the 71.90–74.30 macro base become the magnets.
🔴 CEILING · overhead supply and sell-side liquidity ▪️ 104.59 to 107.26 · continuation pivot band · immediate overhead, price coiled just under it · roughly +1 to +4 pts ▪️ 110.15 · interim waypoint · clean-air continuation marker · roughly +7 pts ▪️ 116.98 to 117.27 · Bear Liquidity Cluster · the only overhead pool and key bull-flip line · roughly +13.8 to +14.1 pts
🟢 FLOOR · demand and buy-side liquidity ▪️ 98.00 to 100.00 · –2.9/10 FORMING SUPPORT · 2 retests · first shelf, low conviction · roughly -3 to -5 pts ▪️ 92.00 to 94.00 · ★ 4.3/10 WEAK SUPPORT · 2 retests · secondary shelf, 95.66 pivot just above · roughly -9 to -11 pts ▪️ 88.00 to 90.30 · Bull Liquidity Cluster overlapping ★★★★ 8.1/10 VERY STRONG SUPPORT · 14 retests at 86.00 to 88.00 · primary reversal-long, nearest high-value demand · roughly -13 to -17 pts ▪️ 80.00 to 81.50 · ★★★ 7.9/10 STRONG SUPPORT · 46 retests · heavily validated structural floor · roughly -22 to -23 pts ▪️ 71.90 to 74.30 · Bull Liquidity Cluster overlapping ★★★ 7.3/10 STRONG SUPPORT · 71 retests · deepest floor and range base · roughly -29 to -31 pts
▪️ ORDER FLOW / ZONE MAP ▪️ Overhead: 104.59/107.26 pivot band → 110.15 waypoint → Bear Cluster 7/10 at 116.98 to 117.27. The corridor is clean air with no graded supply until the cluster; that is the single overhead level a continuation is drawn to and the line a bull discovery has to clear and hold. ▪️ Below: –2.9/10 forming at 98.00 to 100.00 → 4.3/10 weak at 92.00 to 94.00 → Bull Cluster POWER 10/10 plus 8.1/10 VERY STRONG at 86.00 to 90.30 → 7.9/10 STRONG at 80.00 to 81.50 → Bull Cluster POWER 10/10 · 28.98% plus 7.3/10 STRONG at 71.90 to 74.30. The demand stack is the heaviest structure on the board — two POWER 10/10 clusters and three graded supports cushioning every dip.
🔍 SCENARIO PATH ▪️ Continuation / liquidity draw (dominant while 98.00 holds): push through the 104.59/107.26 pivots up into the 116.98–117.27 cluster to run stops — treat the first tag as a liquidity grab, not a breakout, unless reclaimed and held. ▪️ Rejection: reject the cluster, print a lower high, roll back down. ▪️ Down rotation: drive into the 86.00–90.30 confluence where the primary long fires, with 95.66 as the mid waypoint. ▪️ Bounce / reversal: lift off 86.00–90.30 back toward the 104.59 pivot band and the cluster. ▪️ Deeper flush if 86.00 fails: the 7.9/10 STRONG at 80.00 to 81.50 becomes the magnet, then the POWER 10/10 cluster plus 7.3/10 STRONG at 71.90 to 74.30 as the last floor. ▪️ Bull continuation / discovery: a clean reclaim and hold above the Bear Cluster at 117.27 negates the range and reopens fresh highs.
⚠️ MACRO CATALYST · FOMC + EIA this week ▪️ Two-sided risk into mid-week. The weekly EIA Petroleum Status Report is the direct supply-side driver — a larger-than-expected crude build pressures the tape toward the red rotation into 86–90; a draw supports the yellow extension into 117. Layered on top, the FOMC decision transmits through the dollar and demand channel: a hawkish outcome and firmer USD is a headwind for dollar-denominated crude and reinforces the downside; a dovish surprise supports risk appetite and the reach into the cluster. OPEC+ supply-policy headlines and any shift in the geopolitical risk premium remain the tails that override structure intraday. Expect erratic spikes into and just after the prints — the reaction, not the headline, sets the next leg. Size down and let the level confirm before committing.
🔒 Levels and paths from the zone model. No signals, no repaint, a scenario, not a promise. Not financial advice — the Fed and EIA prints can override any technical level in seconds.
▪️ ProjectSyndicate Levels Desk · weekly S/R and liquidity zones for metals, energies, FX, XAUUSD, GBPUSD, NVDA, NQ, ES, GC and WTI. Subscribe to stay up to date.
#WTI #CrudeOil #XTIUSD #Oil #Commodities #OOTT #EIA #FOMC
In-depth trading ideas
Oil Rally Losing Momentum? Key Levels to WatchOil Rally Losing Momentum? Key Levels to Watch
Based on our previous analysis, the price of oil is rising only slowly, showing no signs of a trend reversal.
Despite the crazy situation in the Middle East and widespread discussion regarding high inflation driven by oil prices, we observe that the price continues to rise at a slow pace.
Something is preventing an immediate surge in oil prices to high levels, despite the conflict; we are not seeing the same price reaction that occurred during the Russia-Ukraine conflict.
It is worth noting that Trump frequently speaks about lowering oil prices in cooperation with OPEC+ and oil companies.
It remains unclear when this might happen, but the current price level could offer a clue. Developments at this level are worth monitoring, as the price might show signs of exhaustion before falling further.
If the price begins to drop, I am watching the 94 and 83.00 levels.
You can find more details on the chart.
Thank you! 🍀
⚠️PS: Do your own analysis and use your own strategy to join the trade.
❤️ If this analysis helps your trading day, please support it with a like or comment ❤️
CRUDE OIL (USOIL): Bullish Accumulation PatternI see a classic promising ascending triangle pattern on the 4-hour timeframe.
To confirm a bullish continuation, a breakout above the neckline would be necessary.
A 4-hour candle closing above 105.0 would serve as a reliable confirmation.
In that event, an increase toward the 107.0 resistance level may be anticipated.
OILUSD Technical Analysis: Resistance Test & Liquidity Zone🔹 OILUSD price action remains bullish, with a clear sequence of higher highs and higher lows developing from the August low. Price has advanced along a rising structure and recently pushed toward the highlighted resistance area around 107–108. The latest candles show some hesitation below resistance, suggesting a potential short-term consolidation or rejection. The marked liquidity area near 89–90 remains an important structural zone, while the broader market structure continues to favor the upside unless key support levels are lost.
🔸 A bullish scenario could remain relevant if OILUSD holds its current structure and breaks above resistance with confirmation, potentially opening room for further price discovery. Alternatively, rejection from the resistance zone could lead to a retracement toward lower liquidity areas, with the 89–90 region acting as an important reference point. Traders may wait for clear price confirmation before considering any trade. A sustained failure of the current bullish structure could shift the technical outlook toward deeper correction.
This analysis is for educational purposes only and does not constitute financial or investment advice. Always conduct your own research before making trading decisions.
USOIL 30Min Engaged ( Bearish Reversal Detected )HANZO MARKET LIQUIDITY REPORT
USDJPY
Timeframe: 30min (Volume Basis)
Scale: Higher Timeframe Context / Deep Volume analysis
━━━━━━━━━━━━━━━━━━━━━━
Market Observation
This analysis is focusing on structural behavior, liquidity zones, Volume analysis
and key areas of interest within the current range.
━━━━━━━━━━━━━━━━━━━━━━
Market Bias
Full liquidity Map
━━━━━━━━━━━━━━━━━━━━━━
🔥Bearish Reversal
Key Volume Zone : 101.25 Area
━━━━━━━━━━━━━━━━━━━━━━
Structure Factors:
• Higher timeframe Volume reaction level
• High-volume / Hidden
• Range Defend structure
• Volume Stacking
• Quarter Volume
Crude Oil SMC Analysis | Demand Zones & Market StructureWTI Crude Oil (USOIL) 4H — SMC & Price Action Analysis
WTI is currently trading around 103.25, with the chart showing a strong bullish structure from the 80.70 demand area toward the recent 106.55 weak high.
🔹 Market Structure
Price established a sequence of higher highs and higher lows, supported by multiple BOS (Break of Structure) confirmations. The bullish displacement from the lower demand zones shows strong buying interest.
The latest move pushed price toward 106.55, which is marked as a Weak High / Buy-Side Liquidity area. The recent reaction from this level suggests that a short-term retracement is possible, but confirmation is required before assuming a reversal.
🔻 Potential Retracement
If sellers gain control after a rejection from 106.55, the marked levels become important downside reference points:
106.55 → 100.55 → 95.48 → 91.07
These are potential support/liquidity areas shown on the chart, not guaranteed targets.
🟦 Key Demand Zones
100.55: Immediate support / demand area
91.07: Higher-timeframe demand
80.70: Major demand and structural support
75.00: Lower higher-timeframe demand
72.00: Strong Low / major liquidity reference
📌 Candle Confirmation
The candles near 106.55 should be monitored for rejection, displacement, MSS or ChoCH. A single bearish candle is not enough confirmation for a reversal.
If price instead breaks and holds above 106.55, the bearish retracement scenario becomes less relevant and traders should reassess the structure using the new highs and retests.
⚠️ Trading Plan
Wait for liquidity + market-structure confirmation + candle close before entering. Define stop-loss and risk in advance, and avoid chasing extended moves.
Educational analysis only — not financial advice. Trade with proper risk management.
USOIL 30Min Engaged ( Bearish Reversal Detected )HANZO MARKET LIQUIDITY REPORT
USDJPY
Timeframe: 30min (Volume Basis)
Scale: Higher Timeframe Context / Deep Volume analysis
━━━━━━━━━━━━━━━━━━━━━━
Market Observation
This analysis is focusing on structural behavior, liquidity zones, Volume analysis
and key areas of interest within the current range.
━━━━━━━━━━━━━━━━━━━━━━
Market Bias
Full liquidity Map
━━━━━━━━━━━━━━━━━━━━━━
🔥Bearish Reversal
Key Volume Zone : 102.80 Area
━━━━━━━━━━━━━━━━━━━━━━
Structure Factors:
• Higher timeframe Volume reaction level
• High-volume / Hidden
• Range Defend structure
• Volume Stacking
• Quarter Volume
THE KOG REPORT - OILTHE KOG REPORT – OIL
Quick look at Oil which is another main instrument for us other than gold. Still looking higher on this but a retracement here would be ideal. 95.00 looks decent for a tap, a RIP there would be ideal to continue higher. Breaking below, we’ll look lower for the retracement but we remain bullish above on this.
Please do support us by hitting the boost button, leaving a comment, and giving us a follow. We’ve been doing this for a long time now providing traders with in-depth free analysis, education, targets and indicators on Gold, so your likes and comments are very much appreciated.
As always, trade safe.
KOG
Hellena | OIL (4H): SHORT toward the 96.143 support area.Last week, I expected OIL to begin correcting, but the decline toward my target did not materialize. Buyers remained in control, and bullish wave "3" extended significantly.
The main wave sequence remains intact. According to the updated count, intermediate wave "3" is developing within higher-degree bullish wave "C". The chart now shows a high at 104.682, close to the 104.526 resistance area.
Wave "3" may already be complete, with the first stages of corrective wave "4" underway. However, another test of resistance and a marginal new high remain possible before a more substantial decline develops.
I continue to focus on a correction and see this week as a likely window for it to unfold. However, confirmation must come from price action rather than a calendar deadline.
My revised bearish target is the 96.143 support area, approximately 96. This is where I expect intermediate wave "4" could complete. The previous 89.359 target no longer applies to this trade idea.
Once the correction ends, another advance in wave "5" remains possible. My focus is therefore on a local decline within an ongoing bullish structure.
The fundamental backdrop still supports oil: fresh attacks on Saudi energy infrastructure and risks to maritime supplies have intensified concerns about shortages. These factors could extend the rally, so I will consider short positions only after a reliable bearish reversal signal.
For now, 104.682 is a reference high to monitor, rather than a firm invalidation level. If wave "3" extends further, the timing and potential depth of the correction will need to be reassessed.
Manage your capital properly and wisely! Enter trades only based on reliable patterns!
USOIL 30Min Engaged ( Bullish Reversal Detected )HANZO MARKET LIQUIDITY REPORT
USOIL
Timeframe: 30min (Volume Basis)
Scale: Higher Timeframe Context / Deep Volume analysis
━━━━━━━━━━━━━━━━━━━━━━
Market Observation
This analysis is focusing on structural behavior, liquidity zones, Volume analysis
and key areas of interest within the current range.
━━━━━━━━━━━━━━━━━━━━━━
Market Bias
Full liquidity Map
━━━━━━━━━━━━━━━━━━━━━━
🔥Bullish Reversal
Key Volume Zone : 103.00 Area
━━━━━━━━━━━━━━━━━━━━━━
Structure Factors:
• Higher timeframe Volume reaction level
• High-volume / Hidden
• Range Defend structure
• Volume Stacking
• Quarter Volume
USOIL 30Min Engaged ( Bearish Reversal Detected )HANZO MARKET LIQUIDITY REPORT
USDJPY
Timeframe: 30min (Volume Basis)
Scale: Higher Timeframe Context / Deep Volume analysis
━━━━━━━━━━━━━━━━━━━━━━
Market Observation
This analysis is focusing on structural behavior, liquidity zones, Volume analysis
and key areas of interest within the current range.
━━━━━━━━━━━━━━━━━━━━━━
Market Bias
Full liquidity Map
━━━━━━━━━━━━━━━━━━━━━━
🔥Bearish Reversal
Key Volume Zone : 104.45 Area
━━━━━━━━━━━━━━━━━━━━━━
Structure Factors:
• Higher timeframe Volume reaction level
• High-volume / Hidden
• Range Defend structure
• Volume Stacking
• Quarter Volume
WTICOUSDWest Texas Oil is trading near $100.35 as it consolidates inside the key decision range between $99.504 and $104.896 on the 4h chart.
The first scenario (Bullish) forecasts a bounce off support at $99.504, followed by a breakout above resistance at $104.896 (Weak High) to open the path for a strong upward move toward the primary target around $120.693.
The second scenario (Bearish) projects a rejection and breakdown below $99.504, driving price down toward intermediate support near $88.194, with further downside expansion targeting $79.632.
Both projected paths rely on how price reacts inside this critical consolidation range before giving a clear directional expansion.
Look for clear confirmation on lower timeframes inside the decision zone before entering trades.
Strictly enforce risk management rules with stops set outside key levels in case of a clear breakout or breakdown.
OILUSD: Harmonic XABCD Points to Further DownsidePrice was pushing upward, but momentum was already starting to fade. And now the structure has become much clearer: X, followed by A, B, C and finally D.
Price completed the harmonic structure near point D around the previous resistance area. The final push into D was strong, but buyers failed to hold the highs and price quickly rejected lower.
Once point D is completed and rejection begins from the reversal zone, the probability starts to favor a deeper move to the downside especially when price is already showing weakness after the final bullish leg. This is where the bearish scenario becomes more obvious.
The first major downside target I’m watching is around 83.000.
WTI CRUDE OIL — BULLISH REBOUND SETUP
**Entry Zone:** 95.0–97.0
**Target 1:** 101.36
**Target 2:** 106.0–106.5
**Support:** 94.5–95.0
**Invalidation:** Sustained break below 94.5
WTI Crude Oil is showing a bullish rebound from the marked **support zone** around 95. The structure remains constructive, with price attempting to recover toward the **101.36 resistance/target level**. A confirmed break above 101.36 could open the way toward the higher **106 area**. Traders may watch for bullish confirmation while price holds above the support zone.
*Targets are chart-based levels, not guarantees.*
Available next action: Create a downloadable PDF file here in this chat containing the findings and recommendations above
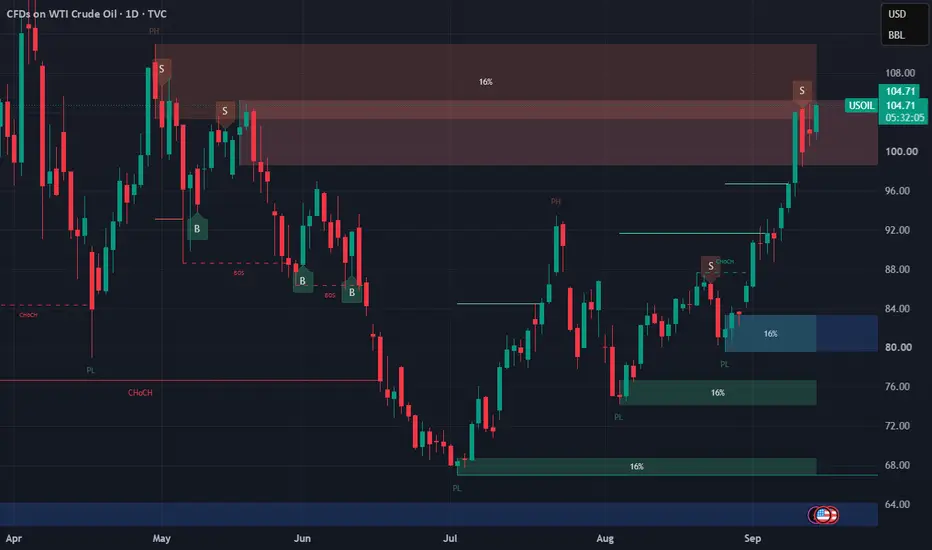
Distribution or a violent breakout?Look at the daily USOIL chart right now—we have been riding a beautiful, steady uptrend, but we just hit a massive brick wall. The price has officially tapped into the daily bearish Order Block at the top.
The candles are already hanging out inside this institutional supply zone, and this is where traders usually make or break their accounts. Here is why you need to be extremely careful tomorrow and over the next few days:
The SMC Logic for Tomorrow: A daily Order Block after a long uptrend is prime real estate for institutions to distribute their contracts and take profits. However, just because price touches a block doesn't mean you blindly click the short button. We need to see what happens inside the zone.
The Fundamental Noise: Geopolitics are keeping the oil market super volatile right now. Any sudden headline about pipeline halts or shipping lane drama can easily invalidate the technicals and push the price higher. On the flip side, macro data remains bearish with OPEC pushing lower demand expectations.
Bearish Confirmation: If tomorrow’s candle leaves a long upper wick (liquidity sweep) and we shift structure on the 4H or 1H charts, I’ll look for a short-term pullback play.
Bullish Continuation: If the daily candle closes hard and body-only above this block, the supply is cooked, and the bulls will squeeze everyone attempting to short the top.
Educational purposes only.
USOIL (D) — back above $100 inside the monthly supply zoneTVC:USOIL
WTI crude trades at $103.51 and moves above one hundred for the first time since May, after Thursday's candle opened at $96.88, printed $104.04 and closed at $103.94, a 7.5% advance in a single session. Friday gave part of it back down to $99.98, Monday closed at $101.88 after touching $104.95, and today's session opens at $102.01 and works in the upper part of the range. What matters is where the move comes from. From the August 26 low at $79.62 price has climbed 31.8% to this week's high in under three weeks, and from the July floor at $67.04 the rebound adds up to 54.4%. The moving average stack is ordered upward and wide open, with the EMA 5 ($100.61) and the EMA 9 ($97.66) right below price, the EMA 20 ($92.43) sitting at the breakout area of early September and the EMA 50 ($87.47), the EMA 100 ($85.31) and the EMA 200 ($81.29) far behind. The daily MACD works upward with its main line (5.14) above its signal (3.59) and a histogram at 1.55 that keeps growing. The TRIX keeps its bullish bias, although its strength is starting to fade. The stochastics sit at the very top, with the Stoch 89 (91), the Stoch 50 (92), the Stoch 14 (88) and the Stoch 5 (79), and the Stoch 14 has just crossed below the 89 line in Monday's session. The RSI 14 (71.50) already trades in overbought and the RSI 2 (79) confirms the short term read. Daily structure is bullish, with its last change of character to the upside alive and two active demand zones below. The range reading explains the tension on the chart, because price has exited above the previous range between $79.62 and $93.50 and no longer trades inside it. No volume read is possible, because the reference contract does not publish it.
Monthly Analysis. The larger timeframe tells the full story of this year and it is where the ceiling that needs respect sits. March opened with a gap at $75, printed the yearly high at $119.48 and closed at $101.55, 51% above the February close, and from there crude spent five months digesting the impulse down to the July low at $67.04. September opens at $86.31 and is already up 19.9%, which puts price back inside the monthly supply block between $101.61 and $107.65, the area where the market turned down in May. The EMA 5 ($90.57), the EMA 9 ($85.62) and the EMA 20 ($79.14) sit below in ascending order, with the EMA 50 ($75.23), the EMA 100 ($72.16) and the EMA 200 ($67.87) acting as the cycle floor. The monthly MACD works upward with its main line (5.20) above its signal (1.90) and a histogram at 3.30, and the TRIX keeps its bullish bias with expanding strength. All four stochastics point upward from the middle zone, with the Stoch 89 (71), the Stoch 50 (57), the Stoch 14 (58) and the Stoch 5 (55), and the RSI 14 (61.90) is not saturated. Monthly structure is bullish with its last change of character to the upside alive, and price trades above the ceiling of its previous range between $63.61 and $94.99. The monthly demand zone holding this entire leg sits between $68.63 and $78.77.
Weekly Analysis. The intermediate timeframe is the one carrying the most strength right now. Last week opened at $92.26, printed $104.46 and closed at $99.98, up 9.6%, and the current one opens at $102.25 and has already touched $104.95. Price trades above the entire stack, with the EMA 5 ($94.93) and the EMA 9 ($90.85) as the first cushion and the EMA 20 ($86.99), the EMA 50 ($80.84), the EMA 100 ($76.83) and the EMA 200 ($74.79) staggered below. The weekly MACD has its main line (3.77) above its signal (2.19) with a histogram at 1.59, and the TRIX is crossed up and expanding, which is the cleanest read of the three frames. All four stochastics point upward, with the Stoch 89 (67), the Stoch 50 (67), the Stoch 14 (88) and the Stoch 5 (89), after the Stoch 14 crossed above the 89 and the 50 lines in the week of August 24. The RSI 14 (61.75) has room and the RSI 2 (94.67) is exhausted in the short term. Weekly structure keeps its change of character to the upside and leaves two active demand zones, the most recent one between $90.09 and $100.50, where the break of one hundred was born. The range reading places price at 69.5% of the run between $67.04 and $119.48, in the expensive half but still far from the ceiling.
Crude rises because every week there are more barrels that cannot reach the market and fewer safe routes to move the ones that do. The trigger for Thursday's candle was the precautionary shutdown of Saudi Arabia's East-West pipeline after a wave of drone attacks, an infrastructure with a capacity of around seven million barrels per day that serves to bypass the Strait of Hormuz, while the threat spreads toward the Red Sea. OPEC put shut-in production at 6.7 million barrels per day in August, global inventories have been draining for months, and the talks between Iran and the Gulf states to open a temporary shipping corridor through Hormuz have been postponed without a date. The risk sits on the other side of the scale, because the International Energy Agency expects global demand to fall this year, the U.S. EIA places Brent around $90 for the second half and at $77 for the second quarter of 2027 once Gulf production restarts, and the Federal Reserve meets tomorrow with a rate hike almost fully priced. A deal on Hormuz or a pipeline restart would strip the risk premium at once.
Key levels:
- Resistance 1: $104.95 (high of the week)
- Resistance 2: $107.65 (top of the monthly supply)
- Resistance 3: $110.30 and $113.97 (weekly supply block and April high)
- Yearly high: $119.48 (March)
- Dynamic support: $100.61 and $97.66 (daily EMAs 5 and 9)
- Support 1: $96.50 (base of the breakout demand)
- Support 2: $92.43 and $90.09 (daily EMA 20 and weekly demand base)
- Structural support: $88.72-$87.47 (demand zone and daily EMA 50)
Setup Rating — 3/5 ⭐⭐⭐⭒⭒ (Bullish trend on the three frames and expanding weekly momentum, against an overbought daily, a price sitting inside the monthly supply and a geopolitical premium that can vanish with one headline)
✅ Positive factors:
- Price above the entire moving average stack on the daily, the weekly and the monthly
- MACD rising on the three frames, with the monthly at 5.20 above 1.90
- Weekly and monthly TRIX crossed up and with expanding strength
- Bullish structure with the change of character alive on all three scales
- Fresh demand zone between $96.50 and $103.31 left by the breakout candle
- More than six million barrels per day off the market and inventories draining
⚠️ Cautions:
- Daily RSI 14 at 71.50, in overbought, with the Stoch 14 crossed down on Monday
- Price inside the monthly supply block from $101.61 to $107.65, where it turned down in May
- A 31.8% rise in under three weeks with barely any pullback, and the daily EMAs wide open
- Fed tomorrow, the Hormuz corridor under negotiation and a Saudi pipeline that can reopen at any time
👍 As long as daily closes respect the $100.61 to $96.50 area, where the EMA 5 and the base of the demand left by Thursday's candle meet, the impulse stays alive and the normal path is for price to spend several sessions digesting between $96.50 and $107.65 before deciding. A weekly close above $107.65 would take price out of the monthly supply and open the way toward $110.30, the April high at $113.97 and finally the yearly ceiling at $119.48. Having the daily unwind its stochastics sideways without losing the fast averages would be the best possible news for the next leg.
👎 Losing $96.50 on a daily close would leave the break of one hundred as a failure inside the monthly supply and put the focus on the EMA 20 ($92.43) and on the weekly demand base at $90.09. That leg would still be a healthy correction, because it would return price to the inside of the previous range without touching the weekly structure. Only below $88.72 and the daily EMA 50 ($87.47) would the thesis need a review, and the level that would fully invalidate it is the monthly demand zone between $78.77 and $68.63.
What else are you watching alongside crude this week: the dollar, energy stocks, gold? 👇
WTI Crude Oil — The Range Is Running Out of Room🛢️WTI has been in a strong recovery after finding a major low, gradually building a sequence of higher highs and higher lows as buyers regained control.
Price has now pushed back toward the upper part of the structure and is consolidating just below a major resistance area. The marked zones have reacted beautifully throughout the move, making the next breakout especially important.
🏆 Previously:
📈 Bullish scenario
The bullish structure remains clearly intact, with buyers continuing to defend higher levels after the recovery from the lows. The recent consolidation below resistance looks like another potential accumulation phase rather than a major reversal.
If price breaks and holds above the current resistance zone, the next marked zones become the natural upside targets. A successful breakout could trigger another strong expansion as momentum continues to build.
Resistance breakout → zone reclaim → bullish expansion.
📉 Bearish scenario
The current resistance remains the key obstacle for buyers. If price fails to break it and gets rejected, the market could pull back toward the lower structural zones before attempting another move higher.
A deeper breakdown through the nearby support would weaken the current bullish structure and could bring the lower demand zone back into focus.
Resistance rejection → support loss → deeper retracement.
🎯 Outlook
WTI is sitting at an important decision point after an impressive recovery. The structure is still bullish, but price needs to clear the upper resistance zones to unlock the next leg higher.
The marked zones below remain important areas for buyers, while a confirmed breakout could open the way toward the next resistance levels.
Hold the structure → bullish momentum remains intact.
Break the resistance → further upside opens up.
Lose the support → deeper retracement becomes likely.
Compression → breakout → next expansion.
Crude oil daily analysis 14/09/2026Oil prices surged after Saudi Arabia shut a major crude pipeline following attacks, disrupting a key alternative route to the Strait of Hormuz. The shutdown raised concerns that a prolonged outage could force Saudi Arabia to cut production, while a planned meeting between Iran and Gulf nations on a temporary shipping lane through Hormuz was postponed. Iranian-backed Houthi advances in Yemen also increased risks to shipping through the Bab el-Mandeb strait. Oil has now rallied more than 75% this year amid widespread supply disruptions, with stronger Chinese demand adding further support. Tightening market conditions and growing concerns over near-term supply point to continued upside risks for prices.
Crude oil remains strongly bullish on the daily chart, with price trading near $100 after breaking above the 61.8% Fibonacci level at $92 and the 78.6% level at $98. Price is also well above both moving averages, confirming the broader upward trend. However, the Stochastic oscillator is deep in overbought territory, with the %K around 93, suggesting momentum is stretched and the risk of a short-term pullback is elevated. Holding above $98 would keep the bullish structure intact, while a sustained break higher could target the $100–$104 area. A move back below $98 would increase the likelihood of a correction toward $92.
Disclaimer: The opinions in this article are personal to the writer and do not reflect those of Exness.
WTI OIL Is $150 even possible?Yes and the reason is on this chart. WTI Oil (USOIL) has been trading within a macro Channel Up since the February 2016 Low and only broke during the March 2020 COVID melt-down, a Black Swan event that saw barrels going to negative prices.
The two Bullish Legs of this pattern had similar % rises (+189.22% and +173.72%). Perhaps the most common characteristic is that every test of the 1 - 0.786 Fibonacci range has been a sell opportunity (Sell Zone) and similarly every 0.236 - 0 Fib range test has been a buy opportunity (Buy Zone).
Right now we are technically on the 3d Bullish Leg and since the market recovered the April - June correction, it is aiming again for that Sell Zone. A +173.22% from its bottom would test the 0.786 Fib at $150.
Notice also that just last month, a 1W Golden Cross was completed. Every time the market formed such a pattern, it moved higher.
---
** Please LIKE 👍, FOLLOW ✅, SHARE 🙌 and COMMENT ✍ if you enjoy this idea! Also share your ideas and charts in the comments section below! This is best way to keep it relevant, support us, keep the content here free and allow the idea to reach as many people as possible. **
---
💸💸💸💸💸💸
👇 👇 👇 👇 👇 👇
Crude Oil Tests Descending Trendline After Demand ReactionUSOIL Reacts From Demand Within a Bearish Structure
USOIL is trading around 102.36 after a strong decline from approximately 106.50. The market continues to respect a descending trendline, showing that the short-term structure remains under bearish pressure.
Price recently reached the highlighted 101.00–101.55 demand zone and produced a noticeable reaction. However, this recovery is now approaching the descending trendline, making the current area important for determining whether buyers can extend the recovery or sellers regain control.
Speculative Outlook
If USOIL breaks and sustains above the descending trendline, price could attempt a recovery toward the 102.80–103.00 resistance area. Acceptance above that region would strengthen the short-term recovery scenario.
On the other hand, rejection from the trendline could push price back toward the 101.00–101.55 demand zone. If this demand fails decisively, the structure could open room for further downside toward the broader lower support area near 98.50.
For now, I would focus on the trendline reaction and demand-zone behavior rather than anticipating either direction too early.
WTI Crude Oil 4H: Inverse Head & Shoulders SetupHi!
WTI Crude Oil is forming a major bullish reversal structure on the 4H chart, currently testing a key resistance zone.
📉 Technical Highlights:
Pattern: Inverse Head & Shoulders (ih&s) structure, with the Head supported by a primary Supply & Demand zone around $73.50 – $75.00.
Current Action: Price is pressing against the ascending neckline resistance around the $87.50 – $88.00 area.
Support: 100 SMA continues to slope upwards, providing dynamic support beneath the Right Shoulder.
🎯 Trade Setup:
Bullish Trigger: A solid breakout above the $88.00 neckline, followed by a pullback/retest to confirm support, provides the entry trigger.
Target Area: $95.50 – $97.00 zone (projected height of the inverse H&S formation).
Invalidation: A decline back below the Right Shoulder low (~$80.00) invalidates the bullish pattern.
⚠️ Wait for a clean 4H breakout and retest before looking for long entries.