VANAUSDT Forming Ascending ChannelVANAUSDT is forming a clear ascending channel pattern, a classic bullish wave signal that often indicates an upcoming breakout. The price has been consolidating within a well-defined upward channel, suggesting that selling pressure is weakening while buyers are steadily regaining control. With consi
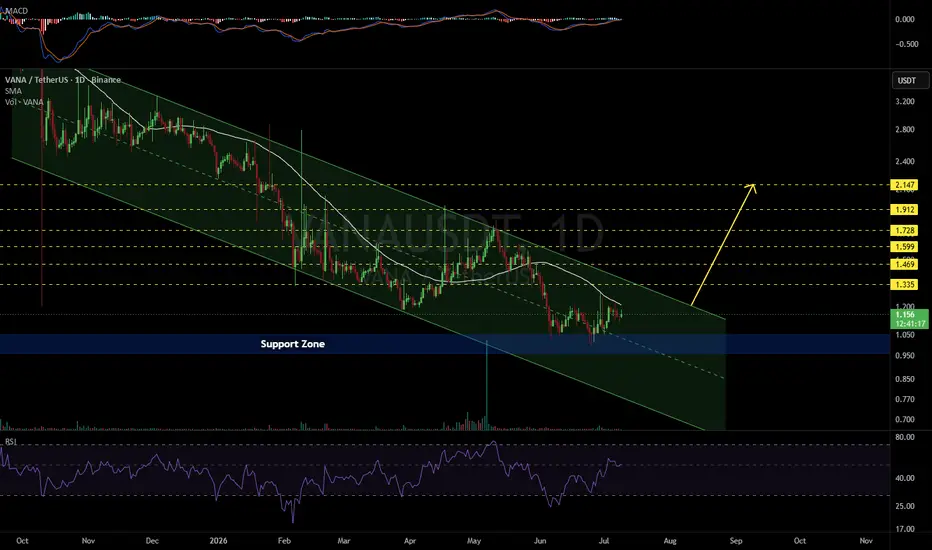
VANAUSDT 1D#VANA is moving inside a descending channel on the daily chart. Consider accumulating a small position here and adding near the support zone.
In case of a breakout above the daily SMA50 and the channel resistance, the potential upside targets are:
🎯 $1.335
🎯 $1.469
🎯 $1.599
🎯 $1.728
🎯 $1.912
🎯 $2.
Vana's bull market in progress · The market flush but in reverseHere we find another. VANAUSDT has been rising since 28-March, together with Bitcoin.
Just recently, the highest volume appeared on a single session, 7-May. Notice the size of this volume bar, this is at least 50 times the daily average on green days—more. Can be 70 times higher compared to the ave
VANA Testing Upper Boundary of Descending ChannelVANA is currently trading near the upper boundary of a long-term descending channel, making this a key decision area. Price has respected this structure for a long time, and the current move represents a clear resistance test, not support.
If price manages to break and hold above the upper trendlin
VANAUSDT 1D#VANA is moving inside a descending channel on the daily chart. It has rejected from the midline of the channel and the daily EMA50. Buy a small bag and hold.
The short-term targets are:
🎯 $3.492
🎯 $3.794
🎯 $4.095
The mid-term targets, in case of a breakout above the channel resistance, are:
🎯 $4.
VANA/USDT - Breakout completed a final shakeout and liquidity sweep below the $4.00 zone, which marked the last stage before a reversal. Following this move, price has now successfully reclaimed the $4.00 level, confirming a trend reversal.
This area presents a strong DCA opportunity, with buyers regaining control and
VANAUSDT Forming Falling WedgeVANAUSDT is currently trading within a classic falling wedge pattern, a bullish structure known for its potential to produce explosive upside breakouts. This pattern indicates that bearish momentum is losing steam while buyers are gradually stepping in. The narrowing of the price range combined with
See all ideas
Summarizing what the indicators are suggesting.
Oscillators
Neutral
SellBuy
Strong sellStrong buy
Strong sellSellNeutralBuyStrong buy
Oscillators
Neutral
SellBuy
Strong sellStrong buy
Strong sellSellNeutralBuyStrong buy
Summary
Neutral
SellBuy
Strong sellStrong buy
Strong sellSellNeutralBuyStrong buy
Summary
Neutral
SellBuy
Strong sellStrong buy
Strong sellSellNeutralBuyStrong buy
Summary
Neutral
SellBuy
Strong sellStrong buy
Strong sellSellNeutralBuyStrong buy
Moving Averages
Neutral
SellBuy
Strong sellStrong buy
Strong sellSellNeutralBuyStrong buy
Moving Averages
Neutral
SellBuy
Strong sellStrong buy
Strong sellSellNeutralBuyStrong buy
Displays a symbol's price movements over previous years to identify recurring trends.