VANA / TetherUS
No trades
No trades
In-depth trading ideas
VANA Descending Trendline Under Pressure, Breakout or Rejection?📊 Technical Analysis — VANA/USDT
⏳ Time Frame: 4D
📌 Pattern: Descending Trendline / Downtrend Structure
💰 Price on the chart: around 0.90 USDT
🔻 Visible Low: around 0.815 USDT
---
📉 Descending Trendline Structure
🔻 The VANA/USDT chart shows a clear long-term downtrend structure, characterized by a series of lower highs connected by a descending trendline since early 2025.
📉 As long as price remains below the Descending Trendline, bearish pressure remains dominant from a structural perspectiv
VANAUSDT Forming Bullish MomentumVANAUSDT is forming a clear bullish momentum pattern, a classic bullish reversal signal that often indicates an upcoming breakout. The price has been consolidating within a narrowing range, suggesting that selling pressure is weakening while buyers are beginning to regain control. With consistent volume confirming accumulation at lower levels, the setup hints at a potential bullish breakout soon. The projected move could lead to an impressive gain of around 90% to 100% once the price breaks abov
VANAUSDT | Inverse H&S BreakoutVANAUSDT has broken above the neckline of an inverse head and shoulders structure on the 4H timeframe.
The neckline sits around $0.904, and price is currently trading near $0.925.
The breakout is constructive, but continuation still depends on holding above the neckline and maintaining the structure.
Key Levels
🎯 Target 1: $0.980 (+5.95%)
🎯 Target 2: $1.050 (+13.51%)
🎯 Target 3: $1.130 (+22.16%)
🚀 Target 4: $1.237 (+33.73%)
⚠️ Invalidation: $0.855 (-7.57%)
A move back below this level would
VANAUSDT Forming Ascending ChannelVANAUSDT is forming a clear ascending channel pattern, a classic bullish wave signal that often indicates an upcoming breakout. The price has been consolidating within a well-defined upward channel, suggesting that selling pressure is weakening while buyers are steadily regaining control. With consistent volume confirming accumulation at lower levels, the setup hints at a potential bullish breakout soon. The projected move could lead to an impressive gain of around 20% to 30% once the price brea
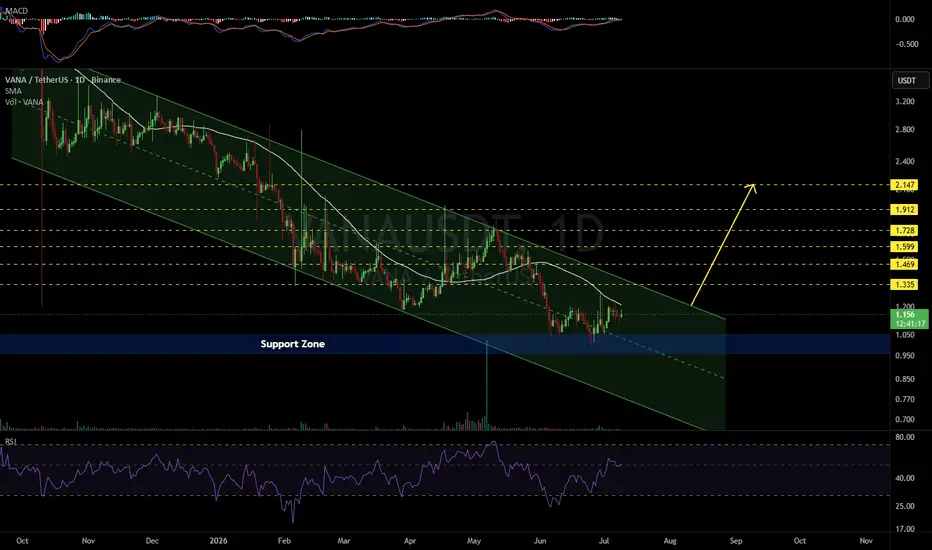
VANAUSDT 1D#VANA is moving inside a descending channel on the daily chart. Consider accumulating a small position here and adding near the support zone.
In case of a breakout above the daily SMA50 and the channel resistance, the potential upside targets are:
🎯 $1.335
🎯 $1.469
🎯 $1.599
🎯 $1.728
🎯 $1.912
🎯 $2.147
⚠️ Always remember to use a tight stop-loss and maintain proper risk management.
Vana's bull market in progress · The market flush but in reverseHere we find another. VANAUSDT has been rising since 28-March, together with Bitcoin.
Just recently, the highest volume appeared on a single session, 7-May. Notice the size of this volume bar, this is at least 50 times the daily average on green days—more. Can be 70 times higher compared to the average daily volume.
There is no need to speculate as to what is coming as here we have proof.
The all-time low happened June 2025. VANA has a double flush.
The lowest close happened March this year
VANA Testing Upper Boundary of Descending ChannelVANA is currently trading near the upper boundary of a long-term descending channel, making this a key decision area. Price has respected this structure for a long time, and the current move represents a clear resistance test, not support.
If price manages to break and hold above the upper trendline, it would indicate a potential trend shift and open room for a stronger upside move. However, a rejection from this level would likely keep price moving lower within the channel.
RSI is hovering ne
VANAUSDT 1D#VANA is moving inside a descending channel on the daily chart. It has rejected from the midline of the channel and the daily EMA50. Buy a small bag and hold.
The short-term targets are:
🎯 $3.492
🎯 $3.794
🎯 $4.095
The mid-term targets, in case of a breakout above the channel resistance, are:
🎯 $4.854
🎯 $5.576
🎯 $6.298
🎯 $7.326
🎯 $8.635
⚠️ Always remember to use a tight stop-loss and maintain proper risk management.
VANA/USDT - Breakout completed a final shakeout and liquidity sweep below the $4.00 zone, which marked the last stage before a reversal. Following this move, price has now successfully reclaimed the $4.00 level, confirming a trend reversal.
This area presents a strong DCA opportunity, with buyers regaining control and setting the stage for the next bullish leg toward higher targets.
VANAUSDT Forming Falling WedgeVANAUSDT is currently trading within a classic falling wedge pattern, a bullish structure known for its potential to produce explosive upside breakouts. This pattern indicates that bearish momentum is losing steam while buyers are gradually stepping in. The narrowing of the price range combined with good volume suggests a breakout could be on the horizon. The falling wedge has historically marked the bottoming phases of many altcoins before massive surges, and VANAUSDT appears poised for a simil
VANAUSDT 1D#VANA is moving inside a falling wedge pattern on the daily timeframe. It was recently rejected from the wedge resistance, partly due to BTC’s drop and the fact that VANA was in the overbought RSI zone. Consider buying VANA within the support zone ($5.327–$5.172) and near the $4.818 support level in case of a deeper dip. In case of a breakout above the wedge resistance, the targets are:
🎯 $6.287
🎯 $6.774
🎯 $7.803
🎯 $9.028
🎯 $10.253
🎯 $11.998
⚠️ Use a tight stop-loss and manage your risk wisely
Vana, Easy Short-Term 180% Target—Profits vs Greed—350% NextI am giving you this one as a short-term chart setup. Vana has been rising since mid-March and I sense this chart becoming stronger by the day. The fact that the action is still happening at bottom prices after months of sideways is also good. This means that the breakout will be a surprise and super strong. Our target can hit within days once resistance break.
Something like more slowly rising challenging upper resistance. Once this break, a huge big candle with 50-60% green. Then another one
Vana 1111% Potential? Consolidation Continues (Trading Strategy)Consolidation as in bullish consolidation because prices have been moving up for months, the bottom was hit mid-March.
Good evening my fellow Cryptocurrency trader, I hope you are having everything that you wish to have in this moment in this time in this life.
I hope you are having a beautiful week and a wonderful day.
How are you feeling?
Good, let's just focus on the chart, ok?
The best time is now to trade.
To trade or not to trade. What does it mean to trade?
What is trading all about?
$VANA/USDT BREAKOUT ALERT🚨 BREAKOUT ALERT $VANA/USDT 🚨
After months of grinding in a sideways market, BME:VANA has finally broken out with strong momentum! 270% upside potential from the breakout zone is now on the table!
📈 Accumulation done. Expansion phase activated.
Are you riding this wave?
DYRO, NFA
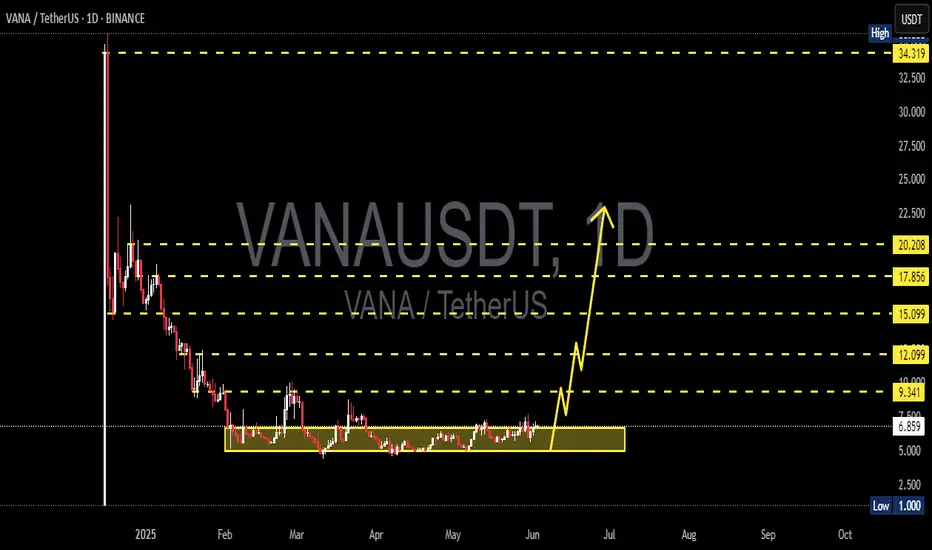
Vana long to $7.23Just now opened a long position on #vana
Target: $7.23
Stop: $6.5 or lower
Roughly 2.8RR
Betting on trend momentum with this one as i didn't wait for confirmation just because I think perhaps by the time I do the RR would be less than I would like and market might push strongly so made an exception for this trade.