$VANRYUSD Is Testing a Key Breakout Zone... Is This the Moment?CRYPTOCAP:VANRY Is Testing a Key Breakout Zone... Is This the Moment?
VANRY has been respecting a descending trendline for quite some time, and we're now approaching another important test. After several rejections, buyers are starting to show more strength. The recent price action looks healthier than before, and the RSI has moved back above the 50 level, which is a positive sign for momentum.
The area I'm watching most is the trendline itself. If we get a strong 4H candle close above it, followed by buyers holding that breakout, the next upside targets could be 0.00613, 0.00716, and 0.00809. I'm not interested in chasing green candles—I'd rather wait for confirmation than enter too early.
That said, this setup is not confirmed yet. A rejection from the trendline, a move back below 0.00523, or RSI slipping under 50 would weaken the bullish case. If price loses 0.00485, this long idea is no longer valid and I'll step aside until the market forms a new structure.
In-depth trading ideas
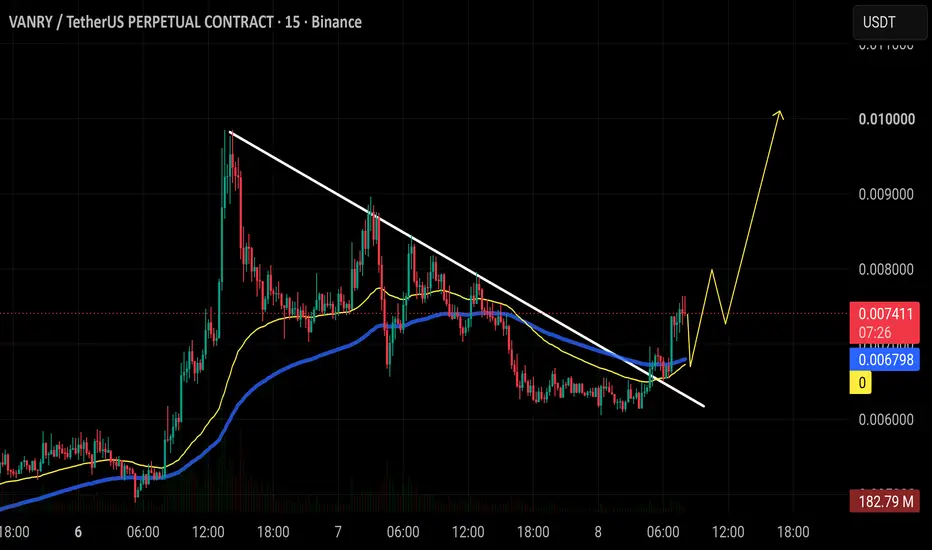
$VANRY is finally showing some strength after spending days tradCRYPTOCAP:VANRY is finally showing some strength after spending days trading under the descending trendline.
The breakout looks promising, but now the important part is holding above it. If buyers can defend this level and keep the momentum going, there's a good chance we'll see another leg higher.
For now, the bulls are in control, but the next few 4H candles will tell us whether this breakout has enough strength to continue.
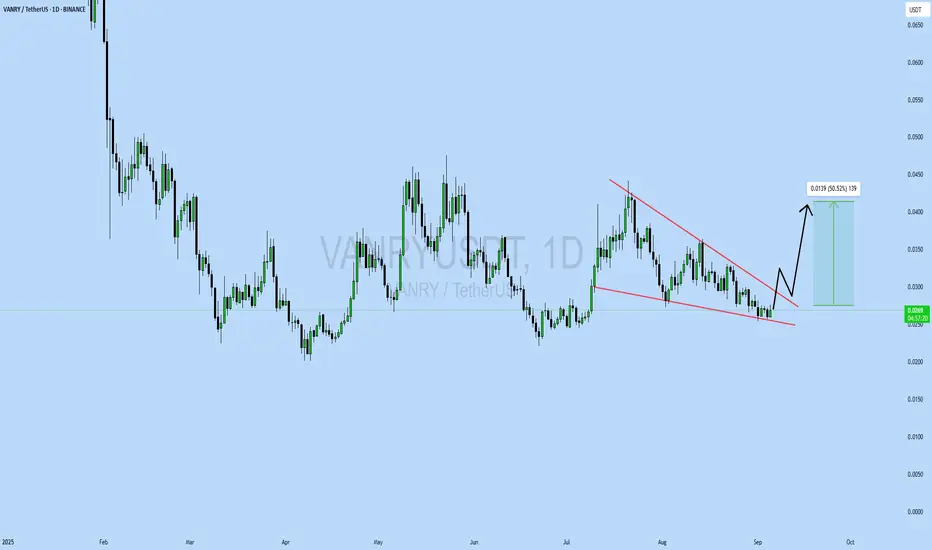
VANRYUSDT: Ready for a Potential 50% PumpVANRY is showing signs of bullish momentum and may be preparing for a strong breakout. A confirmed move above the current resistance zone, supported by volume, could open the path toward a potential 50% upside move.
Watch for a clean breakout and successful retest before expecting continuation. Manage risk—this is a market idea, not financial advice.
VANRYUSDT.P: short setup from support at 0.005460SETUP CONTEXT:
BINANCE:VANRYUSDT.P is globally in a downtrend. Recently, the asset tried to push higher, but the momentum failed, and we are moving down again. Right now, the price has hit the support level at 0.005460, where we've been consolidating for the third day—this is the logical pause of the decline.
An additional short signal comes from yesterday's daily candle: there was an attempt to grow, but almost half of the upward move was aggressively sold off. Today, we are pressing against the support level again, indicating a high probability for a short trade.
LEVEL PROFILE:
Name: Halt of the drop
Price: 0.005460
Timeframe: D1
WHAT I WANT TO SEE:
trend alignment
volatility contraction on approach
close retest
OBSERVED RISKS:
lack of accumulation (no base)
Do you see this setup differently? Let me know your thoughts in the comments.
If this logic aligns with your trading plan, support the idea with a boost!
Disclaimer: This publication is part of my public trading journal. The material is strictly for educational purposes, reflects my market perspective, and is not financial advice. Trading facts, not expectations.
VANRY: Price Reaches Expected SupportVANRY: Price Reaches Expected Support – Patiently Waiting for the Trigger to Optimize Risk-to-Reward Ratio
VANRY's price action is unfolding precisely according to the technical pullback scenario projected in our previous analysis. As anticipated, short-term profit-taking following the explosive breakout has driven the chart to undergo a healthy correction to gather fresh market liquidity. Currently, the price has swiftly returned and converged directly into the ideal support cluster we previously mapped out in preparation for a buy (Long) setup.
Observing the visual data from chart , the price candles are retesting a critical technical intersection: the upper boundary of the old consolidation triangle and the dynamic MA100 moving average line. This technical decline back into support is a positive signal to flush out previous late buyers. However, instead of rushing to open positions immediately, the smart trading behavior right now is to wait a bit longer for the candle structure to completely stabilize at this technical barrier.
Exercising patience to monitor a definitive price rejection in this zone will secure two major advantages. First, it maximizes our potential risk-to-reward (RR) ratio to its highest potential. Second, it allows us to compress our stop-loss placement to the absolute tightest distance just below the support level, safeguarding capital securely before aiming for the next major profit target around the $0.015 round number region.
Disclaimer: This is not financial advice, DYOR.
VANRY: Epic BreakoutVANRY: Epic Breakout – Patiently Waiting for a Technical Pullback to Optimize Long Position
VANRY has just triggered an incredibly powerful bullish wave, drawing massive capital flow from the market. The chart recorded a steep upward impulse from the $0.00274 support floor all the way to $0.0098, before encountering short-term profit-taking that left a prominent upper wick just as it approached the $0.01 psychological round number. Looking at the prior structure on chart , the price previously formed a consolidation triangle and broke downward. However, the selling pressure failed to sustain and was rapidly overwhelmed by a sudden surge in buying volume.
While the potential for continued mid-term growth remains highly convincing, chasing the market due to FOMO at this stage carries elevated risks. Because the price has surged nearly 4x within a short period, the market fundamentally needs to undergo a healthy technical correction to accumulate fresh liquidity. The most ideal zone to map out a buy (Long) setup is during a retest of the upper boundary of the old triangle pattern.
This specific entry area not only converges with the MA100 moving average line to provide a reliable technical cushion, but also optimizes the setup with a tight stop-loss distance to securely safeguard your trading capital. Once demand stabilizes at this support cluster, the next projected profit target will look toward the $0.015 round number region.
Disclaimer: This is not financial advice, DYOR.
VANRYUSDT Forming Falling WedgeVANRYUSDT is forming a clear falling wedge pattern, a classic bullish wave signal that often indicates an upcoming breakout. The price has been consolidating within a narrowing range, suggesting that selling pressure is weakening while buyers are beginning to regain control. With consistent volume confirming accumulation at lower levels, the setup hints at a potential bullish breakout soon. The projected move could lead to an impressive gain of around 90% to 100% once the price breaks above the wedge resistance.
This falling wedge pattern is typically seen at the end of downtrends or corrective phases, and it represents a potential shift in market sentiment from bearish to bullish. Traders closely watching VANRYUSDT are noting the strengthening momentum as it approaches a key breakout zone. Good trading volume adds confidence to this setup, showing that market participants are positioning early in anticipation of a potential reversal.
Investors’ growing interest in VANRYUSDT reflects rising confidence in the project's long-term fundamentals and current technical strength. If the breakout confirms with sustained buying volume, this could mark the beginning of a fresh bullish leg. The ongoing consolidation phase suggests that buyers are steadily accumulating positions while bearish pressure continues to weaken, creating favorable conditions for a strong upward move.
Traders might find this a valuable setup for medium-term gains, especially as the falling wedge pattern nears completion and buying momentum continues to accelerate. A confirmed breakout above resistance could attract additional market participation and potentially drive the price toward its projected upside target over the coming weeks.
✅ Show your support by hitting the like button!
✅ Leave a comment below! (What is your opinion about this coin?)
Your feedback and engagement keep me inspired to share more insightful market analysis with you!
VANRYUSDT - Descending TrendLine, Reversal or Another Rejection?📊 On the 4-Day timeframe, VANRYUSDT remains in a strong long-term downtrend, with the price consistently respecting a major Descending TrendLine that has acted as dynamic resistance since the previous macro high.
📉 After months of continuous selling pressure, the price is now trading near its cycle low while approaching the descending resistance line. This creates a high-probability decision zone, where the next breakout or rejection could determine the medium-term trend.
🕯️ The recent long lower wick also suggests that buyers have begun defending the current support area. However, confirmation is still required before declaring a genuine trend reversal.
---
📐🔍 Pattern Explanation – Descending TrendLine
The chart displays a Descending TrendLine, formed by connecting a series of lower highs throughout the prolonged downtrend.
✨ Characteristics of this Pattern
📉 Bearish Market Structure
Sellers continue to dominate the overall market trend.
📍 Dynamic Resistance
Every recovery rally has been rejected at or near the descending trendline.
⏳ Momentum Compression
The longer the price respects the trendline, the stronger the breakout signal may become once it is finally broken.
🚀 Bullish Breakout Potential
A confirmed breakout above the trendline could trigger fresh buying momentum and potentially mark the beginning of a long-term trend reversal.
⚠️ Continuation Risk
Failure to break above the trendline would keep the bearish structure intact and increase the probability of another downward move.
📌 At the moment, VANRY is testing one of the most critical technical levels since the beginning of its macro downtrend.
---
🟢🚀 Bullish Scenario
For buyers to regain control, several confirmations are required:
✅ A strong 4-Day candle close above the Descending TrendLine.
✅ A successful reclaim of the nearest resistance level.
✅ Increasing trading volume supporting the breakout.
🎯 If confirmed, the next upside targets are:
🥇 Target 1: 0.006320 USDT
🥈 Target 2: 0.008920 USDT
🥉 Target 3: 0.011680 USDT
🏅 Target 4: 0.014600 USDT
👑 Target 5: 0.022400 USDT
💥 A breakout above the Descending TrendLine would invalidate the long-term lower-high structure and significantly increase the probability of a larger bullish reversal.
---
🔴📉 Bearish Scenario
The bearish trend remains dominant until buyers prove otherwise.
❌ If the price fails to break above the Descending TrendLine:
🔻 Sellers may reject the price once again.
🔻 The sequence of lower highs will remain intact.
🔻 The price could revisit the recent swing low around 0.002700 USDT.
⚠️ If that support fails, further downside cannot be ruled out.
📍 As long as the price remains below the Descending TrendLine, every rally should still be viewed as a potential resistance test rather than a confirmed trend reversal.
---
📊💡 Technical Conclusion
⚖️ VANRY is approaching one of the most important technical decision zones on the higher timeframe.
📉 The long-term Descending TrendLine continues to control the overall price action, while the recent recovery attempt indicates that buyers are beginning to defend the lower price range.
🚀 A confirmed breakout above the trendline could trigger a strong relief rally toward multiple resistance levels.
📉 However, another rejection would reinforce the existing bearish trend and increase the probability of retesting the cycle low.
🎯 Patience is key—wait for a confirmed breakout before anticipating a long-term trend reversal.
---
⚠️ Risk Disclaimer
📌 This analysis is based purely on technical analysis and should not be considered financial advice.
📚 Always Do Your Own Research (DYOR).
🛡️ Practice proper risk management, use stop-loss orders, and wait for confirmation before entering any trade.
#VANRY #VANRYUSDT #Crypto 🚀 #Cryptocurrency #TechnicalAnalysis 📊 #PriceAction #DescendingTrendLine #TrendlineBreakout #Bullish 🟢 #Bearish 🔴 #Altcoins #Binance #SupportAndResistance #Breakout
VANRYUSDT 1DKeep an eye on #VANRY daily chart. It is heading toward a retest of the broken trendline, which is also aligned with the daily SMA100. In case of a successful retest, the potential upside targets are:
🎯 $0.006819
🎯 $0.007465
🎯 $0.008110
🎯 $0.009029
🎯 $0.010200
⚠️ Always use a tight stop-loss and maintain proper risk management.
#VANRYUSDT (Watchlist) 2-2024is exhibiting a symmetrical triangle breakout. A move to $0.065 could pave the way for further gains to $0.078-0.10 . However, VANRY is currently approaching a resistance area, warranting close monitoring. A significant event would be a close below $0.0558 on the daily or weekly timeframe, signaling a sell-off for VANRY.
Consider for Watchlist:
When we recommend adding a coin to your watchlist, it's typically due to forming a pattern, nearing a historical bottom, or approaching a strong support level. It may also show increased trading volume, reversal candles, or be in an accumulation stage. While we haven't observed a bullish reaction yet, we advise monitoring it until an optimal entry point emerges.
PS:
We avoid trading coins associated with gambling, prostitution, human trafficking, etc.
Note:
This is not financial advice but an analysis of coin movements. Conduct your own research and practice risk management before making any investment decisions. Remember, the cryptocurrency market carries significant volatility and risks.
Best wishes to all,
we ask Allah reconcile and repay. 🙏
VANRYUSDT Forming Bullish MomentumVANRYUSDT is forming a clear bullish momentum pattern, a classic bullish reversal signal that often indicates an upcoming breakout. The price has been consolidating within a narrowing range, suggesting that selling pressure is weakening while buyers are beginning to regain control. With consistent volume confirming accumulation at lower levels, the setup hints at a potential bullish breakout soon. The projected move could lead to an impressive gain of around 140% to 150% once the price breaks above the wedge resistance.
This falling wedge pattern is typically seen at the end of downtrends or corrective phases, and it represents a potential shift in market sentiment from bearish to bullish. Traders closely watching VANRYUSDT are noting the strengthening momentum as it nears a breakout zone. The good trading volume adds confidence to this pattern, showing that market participants are positioning early in anticipation of a reversal.
Investors’ growing interest in VANRYUSDT reflects rising confidence in the project’s long-term fundamentals and current technical strength. If the breakout confirms with sustained volume, this could mark the start of a fresh bullish leg. Traders might find this a valuable setup for medium-term gains, especially as the wedge pattern completes and buying momentum accelerates.
✅ Show your support by hitting the like button and
✅ Leaving a comment below! (What is your opinion about this Coin?)
Your feedback and engagement keep me inspired to share more insightful market analysis with you!
VANRYUSDT UPDATE#VANRY
UPDATE
VANRY Technical Setup
Pattern: Falling Wedge Pattern
Current Price: $0.0138
Target Price: $0.0207
Target % Gain: 51.36%
Technical Analysis: VANRY has broken out of a falling wedge pattern on the 4H chart, indicating bullish momentum. Price is retesting the breakout zone with rising volume, confirming buyer interest and suggesting a potential continuation toward the target.
Time Frame: 4H
Risk Management Tip: Always use proper risk management.
VANRYUSDT 1D#VANRY is moving inside a falling wedge pattern on the daily chart. For the bullish scenario, it must bounce from the wedge support line and break above the pattern resistance and the daily EMA100. If that happens, the potential targets are:
🎯 $0.0268
🎯 $0.0337
🎯 $0.0392
🎯 $0.0448
🎯 $0.0527
🎯 $0.0628
⚠️ Always remember to use a tight stop-loss and maintain proper risk management.
VANRY/USDT — Critical Support, Accumulation or Breakdown?The VANRY/USDT pair on the 2D timeframe is currently at a decisive stage. After a prolonged downtrend since early 2025, price is now consolidating at the key support zone of 0.02014 – 0.02362 USDT (yellow box). This zone has acted as a strong “buyer defense” multiple times in the past and remains highly significant.
---
🔎 Technical Overview
1. Main Trend: Overall downtrend remains intact, but price is showing signs of sideways / re-accumulation at the lows.
2. Support Zone: 0.02014 – 0.02362 → the foundation for any potential reversal.
3. Key Resistance Levels:
0.03367 – 0.04414 → nearest resistance and first breakout test.
0.07673 – 0.11156 – 0.13336 – 0.16694 – 0.18500 → extended upside targets if bullish momentum strengthens.
4. Volume: Breakouts must be supported by increasing volume to confirm strength; without it, risks of false breakout remain high.
---
🟢 Bullish Scenario
If price holds above 0.02014 and forms a bullish reversal candle, first target lies at 0.03367 (TP1).
A confirmed breakout above 0.03367 opens the door to 0.04414 (TP2), with extended targets up to 0.07673 – 0.11156.
Conservative strategy: wait for a confirmed 2D close above 0.03367.
Aggressive strategy: enter near support with tight SL below 0.020 (higher risk but high R:R).
Example R:R (entry 0.0236, SL 0.019):
TP1 = 0.0336 → +42% upside, R:R ≈ 2.18.
TP2 = 0.0441 → +86% upside, R:R ≈ 4.4.
---
🔴 Bearish Scenario
A confirmed breakdown below 0.02014 with strong volume signals bearish continuation.
Next major target sits near 0.014, a psychological and historical support level.
False breakdowns (bear traps) are possible — watch for rapid recoveries back above support.
---
📌 Chart Pattern
Currently forming a horizontal range / box consolidation at the bottom of a downtrend.
Possible double bottom or accumulation pattern if support holds and a reversal forms.
Failure to hold → pattern shifts into bearish continuation breakdown.
---
🎯 Conclusion
0.020 – 0.0236 zone is the key battleground.
Holding support → potential for reversal rally.
Breakdown → bearish continuation toward 0.014.
Traders can adjust based on risk profile: conservative wait for breakout, aggressive trade support with tight SL.
For long-term investors, this zone could be an accumulation area, but risk of deeper downside remains.
---
#VANRY #VANRYUSDT #crypto #altcoin #support #resistance #breakout #bearish #bullish #priceaction #riskmanagement
VANRYUSDT UPDATE#VANRY
UPDATE
VANRY Technical Setup
Pattern : Bullish Falling Wedge Pattern
Current Price: $0.0269
Target Price: $0.041
Target % Gain: 50.52%
Technical Analysis: VANRY is consolidating within a falling wedge on the 1D chart and showing signs of a potential breakout. A move above the wedge resistance could trigger bullish momentum toward $0.041.
Time Frame: 1D
Risk Management Tip: Always use proper risk management.
$Vanry LOOKS Bullish with (RSI) bullish divergence The Relative Strength Index (RSI) bullish divergence is a pattern in technical analysis that signals a potential upward reversal in an asset's price. It occurs when an asset's price reaches lower lows, but the RSI, a momentum oscillator, forms higher lows.
VANRYUSDT 1D#VANRY is moving within a symmetrical triangle on the daily chart. Wait for either a breakout or breakdown before entering this coin. In case of an upside move, the targets are:
🎯 $0.0413
🎯 $0.0545
🎯 $0.0651
🎯 $0.0757
🎯 $0.0908
🎯 $0.1101
In case of a breakdown below the triangle support:
🎯 $0.0201
⚠️ As always, use a tight stop-loss and proper risk management.
VANRY/USDT – Symmetrical Triangle, Major Breakout Approaching!🔎 Chart Overview
VANRY/USDT is currently in a consolidation phase after a prolonged downtrend since early 2025. Key observations:
Price is stuck inside the demand zone 0.028 – 0.036 USDT (yellow box), which has acted as strong support for months.
A symmetrical triangle pattern is forming, indicating accumulation before a decisive move.
The descending trendline is still pressing the price down, but the apex is approaching → a major breakout or breakdown is imminent.
---
🚀 Bullish Scenario
Trigger:
✅ Daily close above 0.036 USDT with strong volume → breakout from the triangle and descending trendline.
Potential targets:
🎯 First target: 0.040 – 0.04382 USDT (minor resistance + triangle height projection).
🎯 Next target: 0.04930 USDT (key resistance).
🎯 With strong momentum: extension toward 0.07305 USDT, and potentially 0.109 – 0.133 USDT in the mid-term.
Additional bullish confirmation:
Successful retest of 0.036 as new support after breakout.
Increased buying volume confirming buyer dominance.
---
🐻 Bearish Scenario
Trigger:
❌ Daily close below 0.030 – 0.028 USDT → breakdown of the demand zone and triangle.
Potential targets:
🎯 First target: 0.026 USDT.
🎯 Next target: 0.024 USDT (triangle breakdown projection).
🎯 If selling pressure intensifies, price may revisit the historical low at 0.02014 USDT.
Additional bearish confirmation:
Breakdown supported by high volume.
Weak or no rebound after falling below 0.028.
---
📌 Conclusion
VANRY is at a critical stage. The symmetrical triangle within the demand zone signals price compression that will soon resolve.
A breakout above 0.036 USDT could spark a strong rally.
A breakdown below 0.028 USDT could open the way toward 0.02014 USDT.
👉 Key levels to watch: 0.036 (bullish breakout) and 0.028 (bearish breakdown) with daily close and volume confirmation.
#VANRY #VANRYUSDT #CryptoAnalysis #PriceAction #SymmetricalTriangle #Breakout #CryptoTrading #AltcoinAnalysis #TechnicalAnalysis
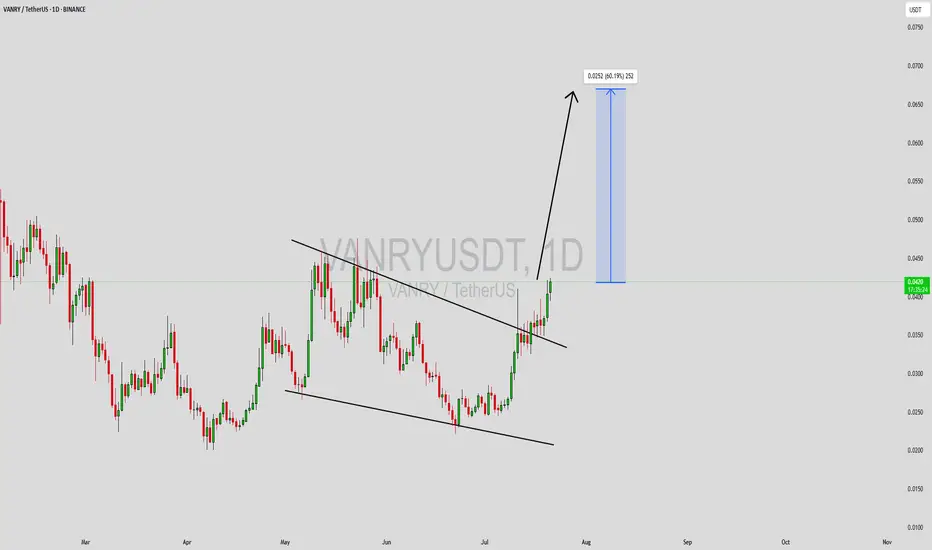
VANRYUSDT Forming Potential BreakoutVANRYUSDT is currently showing a potential breakout pattern, making it one of the more exciting altcoins to keep an eye on in the short term. The price structure has tightened in recent sessions, often a precursor to explosive movement. With strong volume backing the recent price action, the possibility of an upward breakout becomes increasingly likely. Based on the technical setup and broader sentiment, an expected gain of 50% to 60%+ could be achievable in the coming weeks if momentum sustains.
Vanar Chain (VANRY) is beginning to catch the attention of investors due to its innovative blockchain infrastructure and expanding ecosystem. As the project builds utility and demonstrates consistent development, interest from both retail and strategic backers is on the rise. This growing traction is contributing to the observed increase in trading activity, further fueling the potential breakout scenario from a technical standpoint.
The current chart suggests price consolidation near a key resistance level, which, once breached, could trigger a significant upward push. Traders watching this setup may consider entering upon confirmation of the breakout with volume, targeting higher levels based on recent price history and measured move projections. This makes VANRYUSDT an attractive play for breakout traders and momentum investors.
✅ Show your support by hitting the like button and
✅ Leaving a comment below! (What is You opinion about this Coin)
Your feedback and engagement keep me inspired to share more insightful market analysis with you!
VANRY/USDT: Major Breakout from Downtrend – Is This the Start?
After months of downward pressure, VANRY/USDT has finally shown a strong technical breakout, potentially marking a shift in momentum and the beginning of a bullish phase.
📊 Technical Pattern & Market Structure
🔻 1. Descending Trendline Breakout
Price has successfully broken above a long-term descending trendline that has capped the market since November 2024. This breakout is a key signal of a potential trend reversal, suggesting the sellers are losing control.
🟨 2. Accumulation Zone Breakout
For over 3 months, the price consolidated within a clear accumulation zone between 0.02600 – 0.03300 USDT. The breakout from this zone indicates that accumulation may be complete, and price is now entering a markup phase.
🔁 3. Retest Confirmation
After the breakout, VANRY has successfully retested the previous resistance as new support (0.03300 – 0.03500), confirming the breakout as valid. This is often considered a textbook bullish setup.
✅ Bullish Scenario
As long as the price holds above the breakout zone, the bullish outlook remains intact. Key resistance levels to watch:
Target Price Level Notes
🎯 Target 1 0.04393 USDT Minor resistance
🎯 Target 2 0.04902 USDT Key psychological level
🎯 Target 3 0.07311 USDT Mid-term bullish target
🎯 Target 4 0.10610 – 0.13427 USDT Long-term rally potential
🚀 Final Target 0.17085 USDT Previous swing high
> As long as price sustains above 0.035, these targets remain highly achievable in the coming weeks.
❌ Bearish Scenario
In case of a failed breakout or rejection from key resistances, the bearish case still exists:
🔻 Drop below 0.03200 could signal a failed breakout
📉 Downside targets: 0.02700 → 0.02200 → 0.02014 (strong historical support)
⚠️ Daily close below 0.03100 confirms a potential fakeout
🎯 Trading Strategy & Risk Management
Ideal Entry Zone:
→ Retest range of 0.03300 – 0.03550
Stop Loss:
→ Below 0.03100 (invalidates bullish thesis)
Take Profit Levels:
→ Scale out profits at 0.043 / 0.049 / 0.073 / 0.106 etc.
> Using a trailing stop or scaling out strategy can maximize profits as the trend develops.
🔍 Technical Summary
This is a classic Breakout + Retest setup. The combination of trendline breakout, horizontal resistance flip, and retest creates a high-probability bullish pattern.
From a Wyckoff perspective, this could be the transition from accumulation to markup phase, especially if volume increases.
📢 DISCLAIMER:
This analysis is for educational purposes only and does not constitute financial advice. Always do your own research and manage risk accordingly.
#VANRY #VANRYUSDT #CryptoBreakout #AltcoinSetup #BullishRetest #DescendingTrendlineBreakout #CryptoTechnicalAnalysis #WyckoffAccumulation #BreakoutStrategy