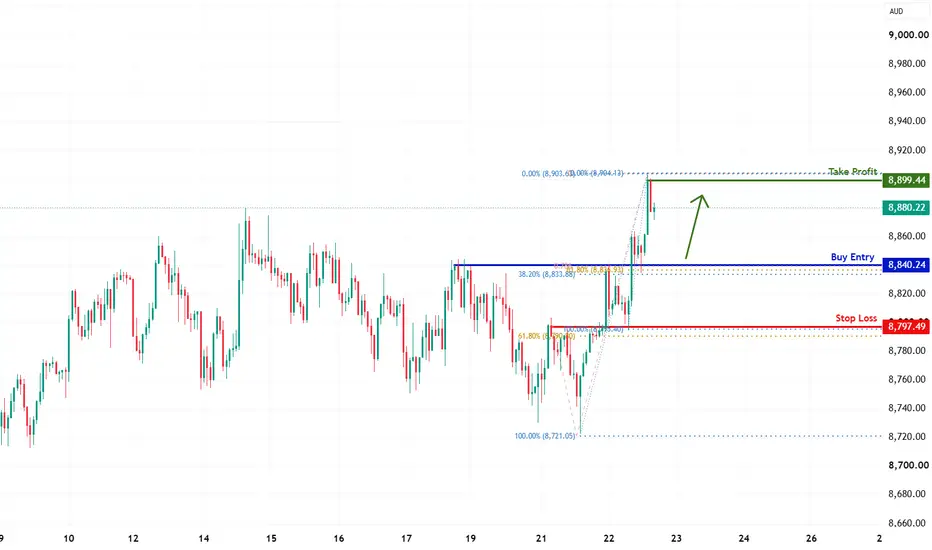
AUS200 H1 | Falling Toward Fib LevelBased on the H1 chart, we could see the price fall to our buy entry level at 8,840.24, an overlap support that aligns with the 38.2% and the 61.8% Fibonacci retracement and the 78.6% Fibonacci projection.
Our stop loss is set at 8,797.49, which is an overlap support that is slightly above the 61.8%
ASX200/AUS200 - time to SHORTTeam, stay sharp — structure is clean and we’re preparing for a controlled short position.
Follow the levels exactly, no rushing, no early entries.
SHORT ENTRY ZONE: 8906 – 8918
Let price tap into the range before executing.
ADD MORE SHORTS: 8946 – 8965
This is our second layer — controlled volume
ASX200/AUS200 - TIME FOR LONG ENTRYTEAM — AUS200 LONG SETUP 🔥
Team, yesterday we executed our SHORT at 8915–8930, and the move delivered 100–120 points clean.
Since then, the market has flushed over 180 points, giving us the perfect opportunity to flip and position for the next leg.
LONG ENTRY ZONE: 8750 – 8730
ADDITIONAL LONGS: 868
Australia 200 Eyes Buy-Side ExpansionAustralia 200 is holding near an important support zone after recent selling. If buyers remain active, the market could move higher and target buy-side liquidity.
A weaker US Dollar and better market sentiment may also support the next bullish move. Wait for confirmation before entering and always
ASX200 / AUS200 LONG SETUPTeam, stay focused — the structure is clean and we have a two‑stage entry plan today.
PRIMARY ENTRY ZONE: 8745 – 8726
ADDITIONAL BUY ZONE: 8686 – 8665
No rushing. No early entries. Let price tap our zones. Otherwise we can trade tomorrow during AUSTRALIAN market opening.
STOP LOSS: 8615
Target 1:
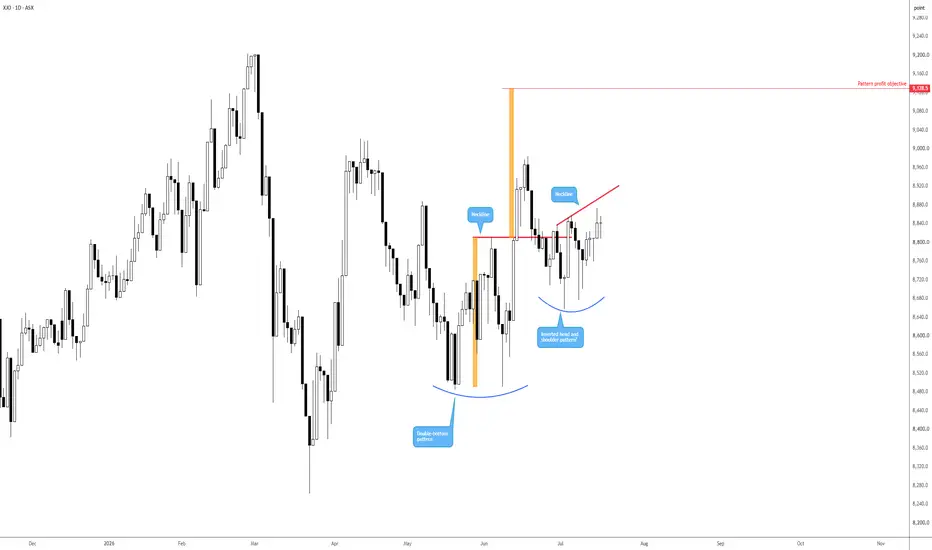
ASX 200 eyeing a pattern breakoutWe have some interesting price action brewing on the ASX 200.
Although a pullback from 8,983 occurred following the break of a double-bottom pattern’s neckline at 8,811, price is beginning to find a footing without breaching the pattern’s lows of around 8,485. The pattern’s profit objective is stil
AUS200
Same logic. Applied across every instrument.
Price over everything.
Every headline, every rumor, every report, and every opinion is reflected in price.
This AUS200 setup is built on one thing only. Pure price action. No indicators. No noise.
The footprints are there for those who know where to
See all ideas
Displays a symbol's value movements over previous years to identify recurring trends.
Frequently asked questions
S&P/ASX 200 Index Cash CFD (AUD) reached its highest quote on Mar 3, 2026 — 9,201.68 AUD. See more data on the S&P/ASX 200 Index Cash CFD (AUD) chart.
The lowest ever quote of S&P/ASX 200 Index Cash CFD (AUD) is 4,416.96 AUD. It was reached on Mar 23, 2020. See more data on the S&P/ASX 200 Index Cash CFD (AUD) chart.
S&P/ASX 200 Index Cash CFD (AUD) is just a number that lets you track performance of the instruments comprising the index, so you can't invest in it directly. But you can buy S&P/ASX 200 Index Cash CFD (AUD) futures or funds or invest in its components.