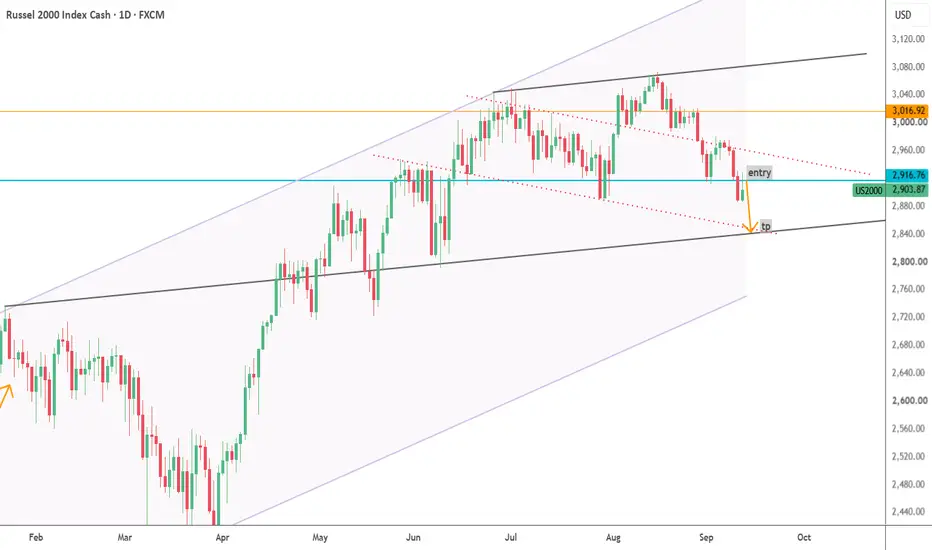
RUSSELL: targeting its 1D MA200 in the next days.Russell 2000 turned bearish on its 1D technical outlook (RSI = 39.006, MACD = -28.020, ADX = 51.578) as it is extending a bearish wave since August 14th. The long term Channel Up is correcting and the last bearish wave hit the 1D MA200. Target that for a new LL (TP =2,780).
See how our prior idea has worked out:
## If you like our free content follow our profile to get more daily ideas. ##
## Comments and likes are greatly appreciated. ##
In-depth trading ideas
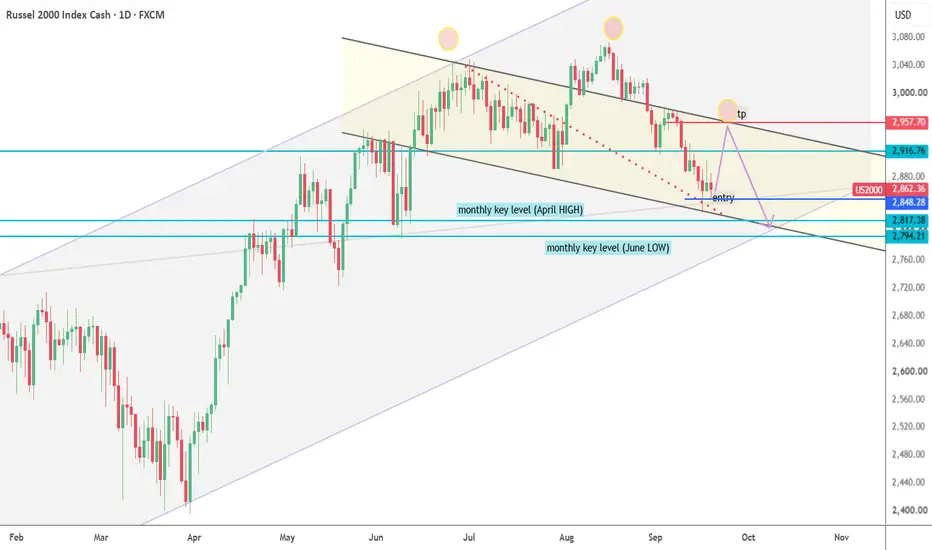
US2000--LONG--CorrectionUS2000 — Weekly Macro Channel & Head & Shoulders Retest
Higher-Timeframe Channel: US2000 has been respecting a gray ascending channel on the weekly chart (anchored from the 2025 low to the 2026 low, with the parallel upper boundary aligned with the 3rd week of 2026).
Market Structure: Price is currently retracing from the upper boundary toward the lower boundary of this channel, forming a Head & Shoulders pattern (pattern is clear on the daily or H4 timeframes)
Current Price Action: Following 5 consecutive bearish weeks, price has reached a critical support confluence. A bullish corrective move is expected from here.
Execution & Setup:
Entry: Marked in blue.
Target: The upper boundary of the yellow channel.
Macro Plan: Anticipating that this upside target will form the Right Shoulder of the Head & Shoulders pattern. Once price reaches that zone, I will monitor price action for a potential high-probability SHORT trade in the coming weeks..
US Small Cap 2000 Index — Bullish Setup Toward 3412US Small Cap 2000 Index — Bullish Setup Toward 3412 📈🇺🇸
The US Small Cap 2000 Index is presenting a constructive bullish structure, with price action showing improving upside potential and renewed strength across the broader small-cap segment.
The current technical formation suggests that buyers are gradually gaining greater influence over the market. The structure is being assessed through price behavior, momentum development, and the broader directional pattern, with the 3412 level positioned as the primary upside objective.
From the current formation, the market has room to extend higher as bullish momentum develops. A sustained move through the developing structure could open the way for further appreciation toward the projected 3412 target.
The setup is based on the broader sequence rather than a single price movement. As long as the bullish structure remains intact, the upside roadmap stays active and higher levels remain in focus.
Setup Overview
- Market: US Small Cap 2000 Index
- Instrument: Russell 2000
- Bias: Bullish 📈
- Direction: Buy
- Target: 3412
- Focus: Upside continuation
- Method: Structural price-action analysis
The 3412 level represents the projected objective of this setup. Price behavior and evolving market structure will remain important as the move develops.
The bullish structure is in focus, with 3412 mapped as the next major objective. 🎯
Huge Butterfly At Resistance.If you draw a fib on the 2020 pullback the 2021 high in the RUT was around the 1.61. Small head fake after trading at it for almost a year.
Recently the 2.61 of this swing hit, and it has complete inside of a huge butterfly pattern.
If that pattern is successful, this ends really badly.
Super melt up possible if these can break, but this is the most dangerous levels now.
Russell: Volume, Sellers, and the Area of Interest.Hello everyone :)
Something on the Russell chart caught my attention.
Whenever I get that feeling—that little spark in my eye—I feel like I have to understand what exactly caught my attention. It doesn't happen often, but when it does, I believe there's usually a reason for it.
I can see that buyers did react yesterday from the 2,915 area. This is a demand zone and potentially the last line of defense before a possible trend change on the daily timeframe.
However, there was one thing missing: volume.
The trading volume around that area was relatively average and not significant enough to aggressively push the price higher against all the momentum that has developed over the past several days.
The price is now approaching last week's trading range, and I'm very interested to see whether sellers will appear in that area.
More accurately, I wouldn't be surprised to see sellers showing up there.
If selling pressure develops, I will then be watching for another potential accumulation of energy around the 2,915 area.
There is no 100% certainty, and there is no perfection.
Just because a trade doesn't work doesn't mean I was wrong. Just because my stop loss gets hit doesn't mean I'm a bad trader.
It simply means that conditions changed compared to what I saw and interpreted at that specific moment when analyzing the chart.
No emotional attachment to profits, and no emotional attachment to losses.
Russell 2000 LONG — 12H ALMA Setup (WR 86% · avg RR 1.3)IG:RUSSELL · 12H · long only.
(Context: Russell 2000 — US small-cap beta via rates, breadth, and risk appetite — not a discretionary “buy the IWM dip” call.)
═
█ RESEARCH HUB
Category: Indices sentiment 32.4 (Fear) — built from 74 locked notes (11 constructive / 48 risk-off / 15 mixed); ticker verdicts +28 / −27. Fear is category-wide (USD / mega-cap stress in the verdict panel), not a Russell-only dossier.
Sector: same bucket as category (indices) — no separate GICS sleeve.
Asset: positive. Living one-liner is a Fed/Warsh global-investment growth read — constructive for risk beta
Tape:
- Category drivers skew risk-off on USD / large-cap proxies while JP / NQ verdicts stay constructive — breadth tape is two-sided into the jobs / FOMC week.
Calendar:
- 2026-09-02 · ADP Nonfarm + Fed Beige Book · indirect (US risk beta) · macro / cb
- 2026-09-04 · US August jobs / NFP (last print before FOMC) · indirect · macro
- 2026-09-16 · FOMC · indirect (rates / small-cap beta) · cb
Hub verdict: Indices fear vs a constructive asset one-liner — Hub is cautious on the index complex , not a veto. Small-cap Averaging fades the 12H wash into the jobs/FOMC week; the fear gauge is the backdrop, not a rate call.
═
█ MARKET EDGE
Long Edge 50.5 · Short Edge −40.6 ( 02 Sep ~ 2920 ).
Built from: TOTAL_BEAR phase · deviation stretch · ALMA overheat below · RSI oversold — discount board, not trend confirmation.
Positive factors
- ALMA — 1D SHORT OVERHEAT-S · S:5 vs SAvg:2.4 — daily band stretched below into the arm
- ALMA — 3D SHORT OVERHEAT-S · S:5 vs SAvg:3.0 — slow clock also stretched below
- EMA — 4H Below · Cur S:20 · Dev +1.8% · 1D Below · Cur S:5 · Dev +2.3% — validation clocks still discounted
- SMC — 4H OB Enter Normal Bull ~ 2924.8 ( 02 Sep ) · bounce up B 54.7% · break down Br45.3% (n=106) — mild demand at the fill pocket
- SMC — 1W FVG Enter Bull ~ 2970.3 ( 23 Aug ) · bounce up B 71.1% · break down Br28.9% (n=38) — weekly hold skew above the wash
- RSI 9 Oversold · 1D — oversold print on the daily clock
- Score skew long ~50.5 vs short ~−40.6 — board tilts discount / repair
Negative factors
- EMA — 1W Above · Cur L:63 · Dev −7.4% — weekly still long-side stretched; slow giveback risk if rates bite
- ALMA — 4H LONG · L:2 vs LAvg:3.5 — faster validation clock already above the band while 1D/3D stay OVERHEAT-S (TF war)
- ALMA — 1W SHORT · S:2 vs SAvg:2.7 — weekly below-band not fully stretched
- TL — Double Top (Classic) ( 31 Aug ) · bounce B 70% · break Br30% (n=53) — pattern bounce skew, but ceiling risk into the mid-2.9ks
- PA — Fractal High + Bearish FVG formed — local supply housekeeping at the arm
- Pyramid already 2 of 4 — thin cushion if the next 12H bars fail before lots 3–4 qualify
═
█ DESK
Hub is cautious (Indices fear · jobs/FOMC week). Edge is a clear discount long (Long 50.5 vs Short −40.6) from 1D/3D ALMA OVERHEAT-S and below-EMA stretch on 1H–1D. Alignment: fade the small-cap wash on the 12H Averaging clock — not a breadth breakout call. Separate from any open 6H Russell Idea on the profile.
Bar-close refill on 12H into the ~2920 pocket after the late-Aug / 01 Sep slide, not a chase of a one-bar bounce.
Takeaway: the 12H ALMA strategy and 86% WR / 1.3 avg RR support a disciplined two-lot arm ~2920 after the small-cap wash, with 1D/3D ALMA below-band overheat, 4H/1D bull demand skew (~55%), and weekly FVG bounce-up 71% framing repair fuel — but Indices Hub stays in Fear, weekly EMA is still −7.4% stretched above, 4H ALMA has already flipped LONG, and a Double Top print caps a clean breakout chase; nominal risk stays on the −10% hard stop / Pine exit path.
Base case: follow 12H ALMA Averaging · hold/add on qualifying 12H closes while the ~2915–2925 pocket digests · mean-revert toward the prior ~2955–2970 weekly FVG shelf if small-cap beta stabilizes without a gap through the stop.
Bear case: lose the ~2915–2920 demand cluster · jobs/FOMC headlines gap lower · template posts −10% toward ~2628 from the working average · wait for the next bar-close arm.
═
█ STRATEGY
ALMA Averaging Strategy: ALMA 3 / σ2, SD band 2, min diff 3/3, 25% per bar, up to 4 adds, hard stop −10% from the working average.
Lots (2 of 4):
- Lot 1 — 01 Sep 23:00 UTC ~ 2922.7
- Lot 2 — 02 Sep 11:00 UTC ~ 2916.2
Working average ~ 2919.5 . Hard stop −10% from that average ~ 2627.5 .
Adds 3–4 stay 25% per bar if lower 12H closes qualify.
Strategy Tester (RUSSELL 12H):
Win rate 86% · profit factor 4.2 · max drawdown 16%
Avg winning trade +6.0% · avg losing trade −4.7%
Typical hold ~56×12H bars on winners — US small-cap mean-reversion grid on the 12H Averaging template · 71-trade sample
Exits follow Pine ALMA flip + min diff or the −10% hard stop from the working average.
Chart: IG:RUSSELL 12H — ALMA Averaging Strategy.
Educational idea. Live position — past backtest ≠ future results. NFA.
Small Caps Could Be SputteringThe Russell 2000 has outperformed most of this year, but some traders may see downside risk.
The first pattern on today’s chart is the mid-August high of 3070. It was less than 2 percent above the previous high on July 1. The small-cap index failed to hold that level and ended last week under 3,000. Are we looking at a false breakout?
Second, MACD has made steadily lower highs for months. That could be viewed as bearish divergence.
Third, RUT advanced between July 31 and August 14. It tried to hold a 50 percent retracement of the move but violated that threshold on Friday. Prices also crossed below the 50-day simple moving average. Those signals may reflect intermediate-term weakness.
Next, the 8-day exponential moving average (EMA) crossed below the 21-day EMA. MACD is also falling. Those signals may suggest the short-term trend is weakening as well.
Finally, Federal Reserve Chairman Kevin Warsh leaned hawkish in his Jackson Hole speech on Friday. Tighter monetary conditions could present a headwind for small caps.
TradeStation has, for decades, advanced the trading industry, providing access to stocks, options and futures. If you're born to trade, we could be for you. Learn more here about TradingView’s Broker of the Year!
Past performance, whether actual or indicated by historical tests of strategies, is no guarantee of future performance or success. There is a possibility that you may sustain a loss equal to or greater than your entire investment regardless of which asset class you trade (equities, options or futures); therefore, you should not invest or risk money that you cannot afford to lose. Online trading is not suitable for all investors. View the document titled Characteristics and Risks of Standardized Options at www.TradeStation.com . Before trading any asset class, customers must read the relevant risk disclosure statements on www.TradeStation.com . System access and trade placement and execution may be delayed or fail due to market volatility and volume, quote delays, system and software errors, Internet traffic, outages and other factors.
Securities and futures trading is offered to self-directed customers by TradeStation Securities, Inc., a broker-dealer registered with the Securities and Exchange Commission and a futures commission merchant licensed with the Commodity Futures Trading Commission). TradeStation Securities is a member of the Financial Industry Regulatory Authority, the National Futures Association, and a number of exchanges.
TradeStation Securities, Inc. and TradeStation Technologies, Inc. are each wholly owned subsidiaries of TradeStation Group, Inc., both operating, and providing products and services, under the TradeStation brand and trademark. When applying for, or purchasing, accounts, subscriptions, products and services, it is important that you know which company you will be dealing with. Visit www.TradeStation.com for further important information explaining what this means.
Will Friday's Sellers Strike Again on Monday?During Friday's trading session, sellers entered the market with relatively strong intraday momentum around the 3,015 price area.
Currently, the price has broken below the 2,975 demand zone, and the short-term intraday momentum is clearly bearish. However, from a broader perspective and on the higher timeframes, the overall market structure remains bullish.
It is possible that the current break below the demand zone could turn out to be a false breakdown, with price potentially recovering and moving higher following Monday's market open. However, for me to consider this breakdown a false move, buyers would need to step in with relatively strong momentum and reclaim the area convincingly.
For now, any upside movement on the lower timeframes may be viewed as a potential retracement before further downside continuation.
I am currently looking for a potential short opportunity from an area that provides a comfortable and well-defined entry with proper risk management. My initial target would be around the 2,950 area.
The 2,900 level appears to be a significant area of interest, with the potential for strong buyers to step into the market around that zone.
US2000--SHORTBearish Reversal / Momentum Loss
Higher Timeframe Context: Price remains inside a massive ascending channel, but price action indicates that bullish momentum is losing steam.
Weekly Momentum: Last two weeks closed bearish.
Expectation: Expecting continued bearish momentum for the coming week.
RUSSELL overbought on 39-year pattern. 2300 correction possible.Russell 2000 (RUT) has been trading within a 39-year Channel Up pattern since its start and has been rallying aggressively ever since its last April 2025 Higher Low on the 1M MA100 (green trend-line).
This rally brought the index almost at the Top (Higher Highs trend-line) of the Channel Up, with the 1M RSI touching its multi-decade Sell Zone this June. As you can see, every time Russell entered this Sell Zone historically, a strong technical correction was initiated that hit at least its 1M MA50 (blue trend-line).
This is why we expect the market to pull-back to that level again and test the 1M MA50 around 2300.
Notice that on a multi-year basis, the index only turns into a very effective long-term buy opportunity when the 1M RSI hits its Buy Zone. If that takes place with the index on its 1M MA200 (orange trend-line) all the better, that has historically been a unique generational buy opportunity that only happened in March 2020 and October 2008.
---
** Please LIKE 👍, FOLLOW ✅, SHARE 🙌 and COMMENT ✍ if you enjoy this idea! Also share your ideas and charts in the comments section below! This is best way to keep it relevant, support us, keep the content here free and allow the idea to reach as many people as possible. **
---
💸💸💸💸💸💸
👇 👇 👇 👇 👇 👇
Part 1: Equities $MID vs $RUTSP:MID (S&P 400 Mid Caps)
Price is testing a major floor where the upward trendline and the 55 day average meet. Unlike the pullbacks in May and June where buyers stepped in quickly, buying energy has dropped significantly lower this time.
The momentum (TTM) bars have formed a lower high compared to the spring push. A full daily close below the 55 day (blue) line opens up a drop. How far? Hard to say. There is the the old price gap down as the bigger risk.
TVC:RUT (US Small Cap 2000)
Small caps are holding their upward channel better and sitting on their 50 day average.
Even though RUT looks steadier, price pushed to new highs while momentum simply matched its previous peak instead of growing. If MID breaks down first, expect small caps to follow and test that lower channel line.
US2000: Bulls vs 3200 Resistance | Russell 2000 Trade Map🔥💰 US2000 (Russell 2000) — Index CFD Market Trade Opportunity Guide 💰🔥
📅 Day Trade / Swing Trade | Live Market Update: 24 August 2026
━━━━━━━━━━━━━━━━━━━━━━━━━━━━━━━━━━━━━━━━━━━━━━━━━━━━━━━━━━━━━━━━━━
🎯 THE THIEF TRADING STYLE — BULLISH HEIST PLAN 🎯
━━━━━━━━━━━━━━━━━━━━━━━━━━━━━━━━━━━━━━━━━━━━━━━━━━━━━━━━━━━━━━━━━━
Greetings, Ladies & Gentlemen — Welcome back to the vault, Thief OG's! 🕵️♂️💼
Today's target? The US2000 (Russell 2000) Index CFD — the heartbeat of
America's small-cap battlefield. We're locking in a bullish heist plan and
heading straight for the vault. The crew is assembled, the charts have been
scouted, and the getaway route is mapped. Strap in — this is the Thief Trader
way. Let's move smart, trade smart, and walk away richer than we came. 🚀📈
📍 LIVE MARKET SNAPSHOT
━━━━━━━━━━━━━━━━━━━━━━━━━━━━━━━━━━━━━━━━━━━━━━━━━━━━━━━━━━━━━━━━━━
🔹 US2000 (Russell 2000) Spot Reference : ~3,017 – 3,045 (Latest Session Range)
🔹 Russell 2000 All-Time High : 3,069.71 (August 14, 2026)
🔹 YTD Performance (RUT) : +20.57% Year-to-Date
🔹 1-Year Performance : +31.59% over past 365 days
🔹 200-Day SMA : ~2,664 (price trading significantly above)
🔹 VIX (Fear Index) : ~15.13 – 16.01 (moderate volatility band)
🔹 US 10-Year Treasury Yield : ~4.74% (20-month high pressure zone)
🔹 DXY (US Dollar Index) : ~98.50 – 98.80 (3-month lows, weakening)
🔹 XAU/USD (Gold Spot) : ~$4,603 – $4,632 (surging on USD weakness)
🔹 SPX (S&P 500 Futures) : ~7,673 – 7,691
🔹 Russell 2000 Futures : ~3,044.90
📌 Thief Boss note: Always verify your exact entry price directly against your
live chart before executing. Forex and index CFD rates move every second — the
numbers above are the most current available at time of post.
💡 MY ANALYSIS — THE HEIST BLUEPRINT
━━━━━━━━━━━━━━━━━━━━━━━━━━━━━━━━━━━━━━━━━━━━━━━━━━━━━━━━━━━━━━━━━━
My analysis of the US2000 (Russell 2000) Index CFD points to a technically
constructive setup on the bullish side. The small-cap index has printed a strong
+20.57% year-to-date return, reclaimed the psychologically significant 3,000
level after brief consolidation, and is trading well above its 200-Day SMA near
2,664. The index hit an all-time high of 3,069.71 on August 14, 2026, and is now
in a brief pullback-and-retest phase which historically presents bullish
continuation opportunities when broader market risk appetite remains intact.
Price structure on the higher timeframes remains bullish, with higher highs and
higher lows intact. Momentum indicators are cooling from overbought conditions
post-ATH — a healthy sign of digestion rather than distribution. The DXY
weakness (testing 3-month lows near 98.50 – 98.80) historically acts as a net
tailwind for risk assets, including small caps. Meanwhile, gold surging above
$4,600 reflects investor unease with the dollar, which indirectly supports
domestic US equity risk appetite.
The week's key event risk centres on Fed Chair Kevin Warsh's Jackson Hole
keynote scheduled for Friday, August 28, 2026 — a high-impact event that could
either validate or challenge the current bullish positioning across risk assets.
📊 MY MARKET BIAS
━━━━━━━━━━━━━━━━━━━━━━━━━━━━━━━━━━━━━━━━━━━━━━━━━━━━━━━━━━━━━━━━━━
🟢 MY MARKET BIAS: BULLISH
The weight of technical evidence currently favours the upside scenario for
the US2000. Small-cap stocks in 2026 have shown extraordinary resilience —
outperforming large-cap benchmarks by a significant margin — driven by
domestic economic growth, a broadening market rally beyond mega-cap tech, and
elevated AI-sector capex filtering down to smaller supply chain and industrial
components within the index. The weakening dollar is a structural tailwind for
this trade.
Risk appetite is alive. The crew moves when conditions are right. This is the
window. 🔐
🛒 THE HEIST PLAN — HOW WE EXECUTE
━━━━━━━━━━━━━━━━━━━━━━━━━━━━━━━━━━━━━━━━━━━━━━━━━━━━━━━━━━━━━━━━━━
🚀 ENTRY STRATEGY:
YOU CAN ENTER THE MARKET AT ANY PRICE LEVEL.
This is an open / flexible entry approach. The Thief Trader method does not chase
a single tick or wait for a precise candle confirmation — we size in, manage risk,
and let the trade breathe. Whether you're entering on a pullback, on a breakout
retest, or on momentum continuation — this heist accommodates all styles. Position
sizing and patience are your greatest weapons. 💪
🏦 THE VAULT — TAKE PROFIT TARGETS:
🎯 Day Trader Target (TP1) → 3,100
First cash register of the heist. Intraday and short-swing traders: consider
booking profits here, tightening stops, or trailing into the next target.
Don't get greedy on the first ring of the bell. 🔔
🎯 Final Swing Target (TP2) → 3,200
This is where the big vault sits, Thief OG's. At this level, the POLICE
FORCE (strong overhead resistance) is thick, the overbought structure becomes
a trap for late bulls, and the probability of a sharp reversal increases
significantly. The escape hatch must be used BEFORE this level becomes
a problem. Escape with profits. Do not overstay your welcome.
🚨 POLICE ALERT: Heavy resistance, overbought signals, potential reversal
and trap zone identified at the 3,200 zone. Our final target is HERE — not
above it. 🚔
🛡️ ESCAPE HATCH — STOP LOSS:
⛔ Thief SL: 2,900
This is our safety net. If price violates 2,900 convincingly, the bullish
heist blueprint is invalidated. The escape hatch is set, the crew is
protected. We live to heist another day. 🏃♂️💨
📌 Dear Ladies & Gentlemen (Thief OG's) — I am not recommended to set only my
TP. Its your own choice — you can make money then take money at your own risk.
📌 Dear Ladies & Gentlemen (Thief OG's) — I am not recommended to set only my
SL. Its your own choice — you can make money then take money at your own risk.
🔮 POSSIBLE SCENARIO
━━━━━━━━━━━━━━━━━━━━━━━━━━━━━━━━━━━━━━━━━━━━━━━━━━━━━━━━━━━━━━━━━━
The possible scenario playing out on the US2000 (Russell 2000) Index CFD:
📌 Scenario A — BULLISH CONTINUATION:
Price holds above the 2,990 – 3,000 structural support zone, consolidates
briefly, then grinds higher toward TP1 at 3,100. A decisive close above 3,069
(August 14 ATH) would confirm the breakout and project the move toward the
final vault at 3,200. A dovish-leaning Warsh speech at Jackson Hole on
August 28 would be the rocket fuel for this scenario.
📌 Scenario B — DEEP PULLBACK THEN RESUME:
Price temporarily dips into the 2,963 – 2,990 zone (key pullback support
and Fibonacci confluence), absorbs liquidity, then resumes the bullish heist.
Traders using flexible entry benefit here — buying dips is part of the game.
Stop at 2,900 remains intact and gives the trade room to breathe.
📌 Scenario C — INVALIDATION:
A hawkish Warsh speech, a hot August CPI print (due September 11), or a
surprise rate hike signal could push price through 2,900, invalidating the
bullish case. In this scenario, exit is clean and losses are controlled.
📐 AREAS I AM WATCHING
━━━━━━━━━━━━━━━━━━━━━━━━━━━━━━━━━━━━━━━━━━━━━━━━━━━━━━━━━━━━━━━━━━
🔍 KEY LEVELS AND ZONES TO MONITOR:
📌 3,200 — Final vault / police force / overbought trap / reversal risk
📌 3,069 – 3,100 — ATH resistance cluster / TP1 zone / first decision point
📌 3,000 – 3,020 — Psychological magnet / recent range centre / current price zone
📌 2,963 – 2,990 — Fibonacci pullback support / buy-the-dip zone / institutional area
📌 2,900 — Thief SL / major structural support / heist invalidation line
📌 2,664 — 200-Day SMA (far below; confirms strong uptrend baseline)
📡 MACRO SIGNALS I AM MONITORING:
→ Jackson Hole keynote from Fed Chair Warsh (Friday August 28)
→ US 10-Year Treasury Yield direction (currently at ~4.74%, near 20-month highs)
→ DXY trend continuation below 98.80 (USD weakness = small-cap tailwind)
→ August PCE inflation data (Wednesday August 27 — pre-Jackson Hole)
→ September 11 August CPI release (next major inflation checkpoint)
→ September 16 FOMC decision (next rate decision)
→ Risk sentiment across SPX and Nasdaq 100
🌐 CORRELATED PAIRS & ASSETS WATCH
━━━━━━━━━━━━━━━━━━━━━━━━━━━━━━━━━━━━━━━━━━━━━━━━━━━━━━━━━━━━━━━━━━
Monitor these correlated instruments alongside your US2000 position. They act as
real-time confirmation gauges — the crew always checks the mirrors before moving:
📈 SPX500 / S&P 500 Index CFD
Current Level : ~7,673 (USD terms, CFD reference)
Correlation Type : POSITIVE — Direct correlated asset. SPX and US2000 move
broadly in the same direction during risk-on environments.
Key Point : When the S&P 500 holds above its 7,540 – 7,550 support zone
(50-day SMA region), it confirms broad US equity risk appetite
remains intact and validates the US2000 bullish case.
Watch SPX closely — if it breaks lower decisively, US2000
will follow. The two indices are best friends in both
bull and bear markets.
📈 US30 / Dow Jones Industrial Average CFD
Current Level : ~53,277 – 53,315 (USD terms, recent close)
Correlation Type : POSITIVE — Large-cap index that reflects industrial and
financial sector health.
Key Point : The Dow and Russell 2000 tend to move together during
broad US equity rallies. When the Dow is confirming
higher highs, small caps typically participate.
Financial sector strength inside the DJIA is particularly
relevant — regional banks are a major component of the
Russell 2000 and benefit from the same domestic tailwinds.
📉 DXY / US Dollar Index
Current Level : ~98.50 – 98.80 (3-month lows, USD weakening)
Correlation Type : INVERSE — A weaker dollar is a structural tailwind for
US small-cap equities and commodity-sensitive sectors.
Key Point : The DXY is trading near 3-month lows and has declined for
two consecutive weeks. Small-cap companies with domestic
revenue streams become relatively more attractive as the
USD softens. Continued DXY weakness is the invisible jet
engine behind this bullish heist. Watch 98.00 as key
support for the dollar — a break below accelerates the
tailwind for US2000.
📈 IWM / iShares Russell 2000 ETF
Current Level : ETF equivalent of ~3,017 – 3,045 on RUT
Correlation Type : DIRECT MIRROR — IWM is the most traded ETF tracking the
Russell 2000. Its options flow, volume, and price action
provide the most accurate real-time read on institutional
sentiment toward small caps.
Key Point : Watch IWM's daily volume and put/call ratio. Unusual
options activity in IWM is the earliest signal of large
smart-money positioning shifts. When IWM confirms the
same support levels as the RUT index, confluence is king.
📈 XAU/USD / Gold Spot
Current Level : ~$4,603 – $4,632 (surging; fifth consecutive weekly gain)
Correlation Type : INDIRECT POSITIVE (via DXY weakness) — Gold surging
alongside small caps signals USD weakness is the driver,
not safe-haven fear.
Key Point : Gold's recent rally above $4,600 is being driven by
dollar weakness and growing fiscal deficit concerns, not
geopolitical panic. When gold rises with equities (not
against them), it confirms a broad risk-on, dollar-off
macro environment — which is the exact backdrop the
US2000 bullish heist needs to flourish.
📉 US10Y / US 10-Year Treasury Yield
Current Level : ~4.74% (near 20-month highs)
Correlation Type : INVERSE PRESSURE — Rising yields increase financing costs
for the domestically focused small-cap companies inside
the Russell 2000, many of which rely on variable-rate
debt and bank credit.
Key Point : The 10-year yield at 4.74% is a headwind, not a tailwind.
This is the risk to watch. If the 10-year breaches 4.80%
and sustains, it could slow the Russell 2000 rally and
compress valuations. The Treasury's announced bond buyback
($4B+) is designed to cap yields — monitor its effectiveness
daily. A yield stabilisation or pullback below 4.60% would
be the green light the heist has been waiting for.
📰 FUNDAMENTAL & ECONOMIC FACTORS — NEUTRAL MARKET READ
━━━━━━━━━━━━━━━━━━━━━━━━━━━━━━━━━━━━━━━━━━━━━━━━━━━━━━━━━━━━━━━━━━
The following factors represent objective, unbiased market conditions as reported.
This section reflects what the market is saying — not what this trade needs it to say.
🏦 FEDERAL RESERVE MONETARY POLICY:
→ Current Federal Funds Rate: 3.50% – 3.75% (held at July 29 FOMC meeting)
→ Vote: 9-3 in favour of HOLD. Three regional bank presidents dissented,
advocating for an immediate 25bps rate hike (Beth Hammack, Neel Kashkari,
Lorie Logan). This internal division signals elevated hawk-dove tension.
→ Fed Chair: Kevin Warsh (took over as Chairman in May 2026). Known for
avoiding forward guidance and preferring "rigorous review" over signalling.
→ Warsh has stated: "What we did is not a pause — it is a rigorous review."
→ The full FOMC pencilled in ONE quarter-point hike possible by year-end 2026.
→ Next FOMC Decision: September 16, 2026. Rate hike odds at approximately
one-in-three as of current market pricing.
📊 INFLATION DATA — LATEST READINGS:
→ July 2026 CPI (YoY): 3.4% (down from 3.5% in June, in-line with consensus)
→ July 2026 CPI (MoM): +0.1% (modest, energy-driven moderation)
→ July 2026 Core CPI (YoY): 2.5% (lowest in 5 months, matching forecasts)
→ July 2026 Core CPI (MoM): +0.2%
→ Shelter inflation: +3.2% YoY (easing from 3.3%)
→ Gasoline prices: +24.6% YoY (elevated but easing from +26.7% in June)
→ Energy shock primary driver: US-Iran geopolitical tensions in Persian Gulf
→ August CPI release scheduled: September 11, 2026 at 08:30 ET
📈 BULLISH FUNDAMENTAL CATALYSTS (as reported by market):
→ US GDP growth tracking solid expansion; Q2 2026 GDP data showed resilience
→ US economy added solid job gains through mid-2026; July jobs showed 172,000
new positions, confirming a resilient labour market
→ Core inflation easing to 2.5% in July reduces the most hawkish Fed scenarios
→ DXY at 3-month lows supports domestic risk appetite and small-cap earnings
→ AI capital expenditure tracking ~40% growth in 2026; industrial and
technology small-cap constituents of RUT are benefiting from supply chain
spillover effects
→ Treasury bond buyback program ($4B+ per quarter) attempting to cap
long-dated yields — any success would directly benefit rate-sensitive
small-cap valuations
→ Russell 2000 YTD return of +20.57% reflects genuine fundamental
re-rating of small caps after years of underperformance
📉 BEARISH FUNDAMENTAL RISK FACTORS (as reported by market):
→ Three FOMC members dissented in favour of a RATE HIKE at July meeting —
a genuine signal of hawkish upside risk to rates
→ US 10-Year Treasury yield at 4.74%, near 20-month highs — a structurally
negative backdrop for leveraged small-cap companies with floating rate debt
→ US-Iran geopolitical tensions in the Persian Gulf remain unresolved;
energy price volatility could re-accelerate inflation
→ Headline CPI at 3.4% remains well above the Fed's 2% target; five years
of above-target inflation has eroded consumer purchasing power
→ Wage growth at 3.2% is BELOW the 3.4% inflation rate — real wages are
negative, which pressures domestic consumer spending (the lifeblood of
small-cap revenue)
→ 30-Year US Treasury yield at ~5.25% — signalling fiscal sustainability
concerns and potential for continued yield curve stress
→ Jackson Hole keynote (August 28) carries extreme binary risk — a hawkish
surprise from Warsh could reprice rate hike odds sharply higher
→ September 11 August CPI print could reset the entire macro narrative
if it comes in hotter than July's modest reading
📅 HIGH-IMPACT UPCOMING EVENTS — CALENDAR TO WATCH:
→ August 27, 2026 : US July PCE Inflation Data + Nvidia (NVDA) Q2 Earnings
→ August 27, 2026 : Jackson Hole Symposium begins (Federal Reserve annual summit)
→ August 28, 2026 : Fed Chair Kevin Warsh delivers first Jackson Hole keynote
(HIGH IMPACT — treat as equivalent to an FOMC press conference)
→ September 5, 2026 : US August Non-Farm Payrolls / Jobs Report
→ September 11, 2026: US August CPI Inflation Report (8:30 ET)
→ September 16, 2026: Next FOMC Rate Decision (Fed rate hold or hike decision)
📚 EDUCATIONAL BREAKDOWN — UNDERSTANDING THE US2000 / RUSSELL 2000
━━━━━━━━━━━━━━━━━━━━━━━━━━━━━━━━━━━━━━━━━━━━━━━━━━━━━━━━━━━━━━━━━━
For the Thief OG's who want to sharpen their edge — here is the knowledge vault:
🔹 WHAT IS THE US2000 / RUSSELL 2000?
The US2000 CFD tracks the Russell 2000 Index — a small-cap equity benchmark
composed of approximately 2,000 of the smallest companies within the Russell
3000 Index. Maintained by FTSE Russell (a subsidiary of the London Stock
Exchange Group), the index covers approximately 5% of total US public company
market capitalisation, with an aggregate value exceeding $3.5 trillion.
The median market cap of a constituent is $1.1 billion, ranging from ~$146M
to ~$2.7B. Unlike the S&P 500 (dominated by mega-cap tech), the Russell 2000
is dominated by financials, healthcare, industrials, and energy — sectors
that are far more sensitive to domestic interest rate conditions and the
US economic cycle.
🔹 WHY IS IT RATE-SENSITIVE?
Small-cap companies are disproportionately reliant on bank credit and
variable-rate financing. When the Fed holds or cuts rates, borrowing costs
stabilise or fall — directly boosting small-cap earnings capacity and
valuation multiples. Conversely, when rates rise or threaten to rise (as now,
with three Fed dissenters advocating a hike), small caps face immediate
pressure on margins and debt servicing. This is why the US2000 is the most
interest rate-sensitive US equity index.
🔹 WHY DOES DXY MATTER TO US2000?
A weaker USD reduces the real financing burden on domestically-focused
companies, supports commodity prices (which feeds energy and materials
constituents), and boosts overall risk appetite. The DXY's current
retreat to 3-month lows below 98.80 is one of the most important structural
tailwinds for the Russell 2000 at this moment in time.
🔹 WHAT IS THE POLICE FORCE (RESISTANCE) AT 3,200?
The 3,200 level represents a confluence of overbought RSI conditions on the
weekly and monthly timeframes, historical price memory where sellers have
previously overwhelmed buyers, and a psychological round-number resistance
that will attract profit-taking from institutions, swing traders, and
algorithmic systems simultaneously. This is exactly where the Thief Trader
crew makes its exit — not after, not before. Timing the escape hatch is
the craft. 🔐
🔹 CFD TRADING NOTE:
The US2000 CFD (traded on platforms such as TradingView's partnered brokers,
IG, Pepperstone, and others) mirrors the Russell 2000 Index price in real
time. Unlike owning the IWM ETF, CFDs allow short selling and leverage.
Always understand the margin requirements and overnight financing costs of
your specific CFD provider before entering.
✨ THIEF TRADER WISHES & MOTIVATION QUOTES
━━━━━━━━━━━━━━━━━━━━━━━━━━━━━━━━━━━━━━━━━━━━━━━━━━━━━━━━━━━━━━━━━━
🌟 "Small caps, big moves, bigger nerves. The Russell 2000 doesn't reward the
timid — it rewards the prepared." — Thief Trader 🕵️♂️
🌟 Good luck and good trading, Thief OG's! May the charts be in your favour
and the police force always be one step behind. 🚀💰
📣 COMMUNITY CALL TO ACTION — JOIN THE HEIST!
━━━━━━━━━━━━━━━━━━━━━━━━━━━━━━━━━━━━━━━━━━━━━━━━━━━━━━━━━━━━━━━━━━
💥 If this analysis cracked open the vault for you — show your support!
👍 SMASH the BOOST button — fuel the algorithm and push this idea to more traders!
❤️ DROP A LIKE — every one helps this heist reach more Thief OG's worldwide!
💬 COMMENT BELOW — tell the crew your thoughts, your questions, your trade updates!
⚠️ DISCLAIMER
━━━━━━━━━━━━━━━━━━━━━━━━━━━━━━━━━━━━━━━━━━━━━━━━━━━━━━━━━━━━━━━━━━
📌 Dear Ladies & Gentlemen (Thief OG's) — I am not recommended to set only
my TP. Its your own choice — you can make money then take money at your own risk.
📌 Dear Ladies & Gentlemen (Thief OG's) — I am not recommended to set only
my SL. Its your own choice — you can make money then take money at your own risk.
Trading involves substantial risk and is not suitable for all investors. Past
performance does not guarantee future results. This idea is for educational and
informational purposes only and should not be construed as financial advice.
Always conduct your own research and consult a qualified financial professional
before making any trading decisions. The Thief Trader takes no responsibility
for individual trading outcomes.
Russell 2000 LONG — 6H ALMA Re-entry (WR 76% · avg RR 1.1)█ SETUP
IG:RUSSELL · 6H · long only.
(Context: Russell 2000 — US small-cap beta — trades with rate-sensitivity and breadth risk appetite, not a discretionary “buy the small-cap bounce” call.)
ALMA Averaging Strategy: ALMA 3 / σ2, SD band 2, min diff 1/1, 25% per bar, up to 4 adds, hard stop −10% from average entry.
Strategy Tester (RUSSELL 6H):
Win rate 76% · profit factor 2.8 · max drawdown 20%
Avg winning trade +2.5% · avg losing trade −2.3%
Typical hold ~25×6H bars on winners — small-cap mean-reversion grid on the 6H Averaging template · 306-trade sample
═
█ WHY NOW
Fresh 6H ALMA re-entry after the prior Idea cycle closed — now two lots on this arm:
· lot 1 — 18 Aug 05:00 UTC ~ 3052.8
· lot 2 — 18 Aug 11:00 UTC ~ 3049.1 (2 of 4)
Working average ~ 3051 . Bar-close re-arm + same-day add into the ~3050 pocket, not a size-up on a breadth headline. Hard stop −10% from the working average ~ 2746 . Exits follow Pine ALMA flip + min diff or the hard stop. Scale-in stays 25% per bar, up to 4 adds, if lower bars qualify.
Sister 8H Averaging lots from mid-Jun remain open on a separate template (different WR) — this Idea tracks the 6H clock only.
═
█ MACRO
Sector: Russell 2000 = US small-cap complex — beta to rate-cut odds, regional-bank/credit tape, and market breadth vs Mag7 leadership.
Tape (17–18 Aug): index held the ~3050–3060 band into the mid-Aug board with mixed breadth vs mega-cap leadership; no single Russell-specific IR print on the fill bars. Execution is 6H ALMA Averaging on the re-arm closes — not a Fed-path or small-cap rotation forecast.
═
█ OUTLOOK
Factor board from 17 Aug ~ 3059.6 (long-score ~19.5 · short-score ~−9.6) — same ~3050s pocket as the 18 Aug fills.
Positive factors
- Tester: 76% WR · PF 2.8 · avg win +2.5% vs avg loss −2.3% (avg RR 1.1) · 306-trade sample — hit-rate edge with tight typical swings and a bounded −10% stop
- Clean re-entry after the prior public Idea closed — process reset at ~3050, not an open loser averaged in silence
- EMA — HTF still Above: 4H Above · Cur L:67 · Dev −0.5% · 1D L:13 · Dev −1.7% · 3D L:39 · Dev −4.2% · 1W L:61 · Dev −12.0% — slow clocks still long-side structure under the Idea
- SMC — 4H bull raids: FVG Raid Bull ~ 3058 ( 17 Aug ) near the arm — demand inefficiency into the session (bounce-up skew ~53/47 on the raid sample)
- SMC — 1D bull FVG: FVG Enter Bull ~ 3066 ( 13 Aug ) — daily demand print still overhead/at the pocket
- SMC — 1W: OB New Bull ~ 3070 ( 9 Aug ) + MS BOS — weekly structure still printing bull-side events
Negative factors
- Avg RR only 1.1 — payoff skew thin vs fat-tail crypto/equity grids; edge is hit-rate, not home-run size
- ALMA — 4H OVERHEAT-S / 1D SHORT: 4H SHORT · S:3 vs SAvg:2.9 · OVERHEAT-S · 1D SHORT · S:1 vs SAvg:2.4 — execution-adjacent clocks press against the fresh long
- EMA — 1H Below: Cur S:4 · Dev +0.1% — LTF still under the line into the add
- EMA — 4H/1W Above heavily time-stretched: Cur L:67 / L:61 with deep weekly Dev — HTF long structure can mean-revert hard if breadth fails; not a “cheap” discount long
- SMC — 4H two-way history: FVG Mitigated Bull same window as raids ~ 3068 — chop housekeeping, not clean expansion
- Open 8H sister (separate WR68 template) = correlated Russell beta, not diversification
- Pyramid only 2 of 4 — thin cushion if the next 6H bars fail
Takeaway: the 6H ALMA strategy and 76% WR support a disciplined re-arm + add ~3051 after the prior Idea closed, with HTF still Above EMA, 3D ALMA OVERHEAT-L, and 4H/1D/1W bull SMC near the pocket — but thin 1.1 avg RR, 4H ALMA OVERHEAT-S, 1H EMA Below, and time-stretched HTF Above-runs frame a small-cap chop grind, not a clean breadth trend leg; nominal risk stays on the −10% hard stop / Pine exit path.
Base case: 6H ALMA holds · digest toward ~3060–3070 if breadth stabilizes · adds only on qualifying lower closes.
Bear case: lose the ~3040–3050 pocket · 6H ALMA flips · −10% from ~3051 toward ~2746 · rates/breadth gap through the index book.
Chart: IG:RUSSELL 6H — ALMA Averaging Strategy.
Educational idea. Live position — past backtest ≠ future results. NFA.
US2000 H4 | Bullish Momentum To ContinueBased on the H4 chart analysis, we could see the price fall to our buy entry level at 2,963.09, a pullback support.
Our stop loss is set at 2,917.52, a pullback support.
Our take profit is set at 3,006.34, a pullback resistance that aligns with the 161.8% Fibonacci extension.
High Risk Investment Warning
65% of retail investor accounts lose money when trading CFDs with this provider. You should consider whether you understand how CFDs work and whether you can afford to take the high risk of losing your money.
Russell 2000 LONG — 6H ALMA Setup (WR 76% · avg RR 1.1)█ SETUP
IG:RUSSELL · 6H · long only.
(Context: Russell 2000 — US small-cap beta — trades with rate-sensitivity and breadth risk appetite, not a discretionary “buy the small-cap bounce” call.)
ALMA Averaging Strategy: ALMA 3 / σ2, SD band 2, min diff 1/1, 25% per bar, up to 4 adds, hard stop −10% from average entry.
Strategy Tester (RUSSELL 6H):
Win rate 76% · profit factor 2.8 · max drawdown 20%
Avg winning trade +2.5% · avg losing trade −2.3%
Typical hold ~29×6H bars on winners — small-cap mean-reversion grid on the 6H Averaging template · 306-trade sample
═
█ WHY NOW
Fresh 6H ALMA long on the 6 Aug 05:00 UTC bar ~ 3020.6 — lot 1 of 4 on this template.
Bar-close arm into a small-cap chop, not a size-up on a breadth headline. Hard stop −10% from fill ~ 2719 . Exits follow Pine ALMA flip + min diff or the hard stop. Scale-in stays 25% per bar, up to 4 adds, if lower bars qualify. Mark ~ 3002–3005 .
Sister 8H Averaging lots from mid-Jun remain open on a separate template (different WR) — this Idea tracks the **6H** clock only.
═
█ MACRO
Sector: Russell 2000 = US small-cap complex — beta to rate-cut odds, regional-bank/credit tape, and market breadth vs Mag7 leadership.
Tape (5–6 Aug): early-Aug rebound tape with mixed breadth; 4H board tagged bull FVG enter ~3008 with a same-bar bear raid — two-way housekeeping into the fill. Execution is 6H ALMA Averaging on the fill bar — not a Fed-path or small-cap rotation forecast.
═
█ OUTLOOK
Positive factors
- Tester: 76% WR · PF 2.8 · avg win +2.5% vs avg loss −2.3% (avg RR 1.1) · 306-trade sample — hit-rate edge with tight typical swings and bounded −10% stop
- ALMA — 3D / 1W long: 3D LONG · L:2 vs LAvg:3.4 · 1W LONG · L:1 vs LAvg:3.9 — slow ALMA not flipped against the 6H long
- SMC — 4H bull FVG tagged: FVG Enter Bull ~3008 ( 6 Aug 15:00) near the arm — demand inefficiency into the session
Negative factors
- Avg RR only **1.1** — payoff skew thin vs fat-tail crypto/equity grids; edge is hit-rate, not home-run size
- EMA: 4H Above · Cur L:25 vs Avg L:13.2 · 1D L:4 vs 13.4 · 3D L:36 vs 10.7 · 1W L:59 vs 14.9 — slow clocks still long-side structure under the Idea
- ALMA 1D SHORT young — LTF/execution-adjacent clocks press against the fresh long
- SMC — two-way 4H: same bar FVG Raid Bear alongside bull FVG ~3008 — chop, not clean expansion
- SMC — daily bear OB history: 1D bear OB ~3046 ( 3 Aug ) still overhead as first ceiling
- Mark already slightly soft vs ~3021 fill; first lot only
- Open 8H sister (separate WR68 template) = correlated Russell beta, not diversification
- No VWAP Touch row — no Active Support/Resistance levels here
Takeaway: the 6H ALMA strategy and 76% WR support a disciplined first-lot arm near ~3020 with HTF still Above EMA and a tagged 4H bull FVG, but thin 1.1 avg RR, 1H ALMA OVERHEAT-S, same-bar bear raids, and daily bear OB ~3046 cap upside into a small-cap chop grind — not a clean breadth trend leg; nominal risk stays on the −10% hard stop / Pine exit path.
Base case: 6H ALMA holds · digest toward ~3040–3050 if breadth stabilizes · adds only on qualifying lower closes.
Bear case: lose the ~3000–3020 pocket · 6H ALMA flips · −10% from ~3021 toward ~2719 · rates/breadth gap through the index book.
Chart: IG:RUSSELL 6H — ALMA Averaging Strategy.
Educational idea. Live position — past backtest ≠ future results. NFA.
Russell 2000 (US2000) Bullish Setup | Small Caps Ready to Rally🔥💰 US2000 (Russell 2000) — Index CFD Market Trade Opportunity Guide 💰🔥
📅 Day Trade / Swing Trade | Updated: 6 August 2026
━━━━━━━━━━━━━━━━━━━━━━━━━━━━━━━━━━━━━━━━━━━
🎯 THE THIEF TRADING STYLE — BULLISH HEIST PLAN 🎯
━━━━━━━━━━━━━━━━━━━━━━━━━━━━━━━━━━━━━━━━━━━
Greetings, Ladies & Gentlemen — Welcome, Thief Traders & OG Market Bandits! 🥷📈
We are stalking the US2000 (Russell 2000 Small-Cap Index CFD) for a
calculated Bullish Heist Setup. The plan is locked in. The vault door
is open. All we gotta do is walk in, take the loot, and escape CLEAN
before the cops (resistance + reversal zone) shut us down. Let's GO! 🚀💸
━━━━━━━━━━━━━━━━━━━━━━━━━━━━━━━━━━━━━━━━━━━
📊 ASSET DETAILS
━━━━━━━━━━━━━━━━━━━━━━━━━━━━━━━━━━━━━━━━━━━
Asset : US2000 — Russell 2000 Small-Cap Index (CFD)
Full Name : Russell 2000 Index — U.S. Small-Cap Benchmark
Market Type : Index CFD
Trade Bias : 📈 BULLISH (Day / Swing)
Live Price : ~2,931 (as of 6 Aug 2026)
Timeframe : Multi-Timeframe Confluence (1H / 4H / Daily)
━━━━━━━━━━━━━━━━━━━━━━━━━━━━━━━━━━━━━━━━━━━
📋 TRADE PLAN — THE HEIST BLUEPRINT
━━━━━━━━━━━━━━━━━━━━━━━━━━━━━━━━━━━━━━━━━━━
📌 STRATEGY:
Multiple Moving Average (MMA) Tap Strength Setup — Buyer Power Confirmed!
Price is bouncing off layered moving average support levels, confirming
bullish momentum with institutional buyer strength beneath the current
price structure. The moving averages are stacked in a bullish formation,
acting as a dynamic launchpad for our heist entry.
We are riding the trend with disciplined risk management, defined
profit escape zones, and tight heist-style stop loss protection below.
━━━━━━━━━━━━━━━━━━━━━━━━━━━━━━━━━━━━━━━━━━━
🟢 ENTRY ZONE — STEAL FROM ANY FLOOR
━━━━━━━━━━━━━━━━━━━━━━━━━━━━━━━━━━━━━━━━━━━
⚡ Entry : ANY PRICE LEVEL — Market Price / Limit / Pullback Entry
📌 Recommended Entry Style :
→ Enter on a Moving Average tap or bullish candle confirmation
→ Aggressive traders : Enter at current market price
→ Conservative traders : Wait for a minor pullback toward MA support
→ Scalpers : Enter on 15M / 30M bullish breakout candles
No specific single entry point. The trend is your friend. Ride with
proper lot sizing and money management. Risk only what you can afford
to lose. This is YOUR trade — own it! 💪
━━━━━━━━━━━━━━━━━━━━━━━━━━━━━━━━━━━━━━━━━━━
🎯 PROFIT TARGETS — THE ESCAPE ROUTE 💰
━━━━━━━━━━━━━━━━━━━━━━━━━━━━━━━━━━━━━━━━━━━
🏹 Target 1 (T1) : 3,100 — First Profit Zone / Partial Exit Level
🏹 Target 2 (T2) : 3,150 — Momentum Extension / Swing Profit Lock
🏹 FINAL TARGET : 3,200 🚨 POLICE FORCE ZONE — MAIN HEIST PAYDAY!
⚠️ WARNING AT 3,200 — COP ZONE ALERT! 🚔🚨
The 3,200 level is a HEAVY resistance zone acting as:
→ Major Historical Supply / Resistance Wall
→ Overbought RSI Confluence
→ Institutional Bull Trap Territory
→ Potential Sharp Reversal Point
🗣️ Dear Ladies & Gentlemen (Thief OGs) — I do NOT recommend setting
ONLY my TP as your take profit. Use your own judgment. Scale out at T1,
T2, and the Final Target based on YOUR risk appetite and account size.
Take the money and RUN before the cops catch you! 🥷💨
Use a Trailing Stop Loss to protect your profits on the move.
Lock in gains. Protect your bag. Be the smart thief, not the greedy one.
━━━━━━━━━━━━━━━━━━━━━━━━━━━━━━━━━━━━━━━━━━━
🔴 STOP LOSS — THIEF ESCAPE TUNNEL 🥷🛡️
━━━━━━━━━━━━━━━━━━━━━━━━━━━━━━━━━━━━━━━━━━━
🛑 Thief SL : 2,900
The Stop Loss is placed at a key swing low below multiple MA supports
and below the recent structure, protecting the trade from a full market
reversal invalidation. This is the point where the plan is off the table.
Exit clean. No ego. No revenge trading. 🧠
⚠️ NOTE: I do NOT recommend setting ONLY my SL blindly. Adjust your
stop loss based on YOUR risk tolerance, account size, and lot size.
Always calculate your risk BEFORE entering the trade. Protect your
capital FIRST. Profits come second. Capital is your weapon — keep it safe.
━━━━━━━━━━━━━━━━━━━━━━━━━━━━━━━━━━━━━━━━━━━━
📐 TECHNICAL ANALYSIS SNAPSHOT 🔍
━━━━━━━━━━━━━━━━━━━━━━━━━━━━━━━━━━━━━━━━━━━━
→ Multiple MAs (20 / 50 / 100 / 200) stacked bullishly on Daily chart
→ Price is currently hovering near the 20-Week Moving Average support
— a critical dynamic support zone being tested right now (Aug 2026)
→ RSI on Daily was in overbought earlier — now cooling toward neutral,
creating a fresh bullish reload opportunity
→ Fibonacci retracement 3,000 level (61.8%) was broken downward recently,
acting as a near-term resistance to reclaim
→ Buyers must reclaim 3,000 to re-accelerate the bullish momentum
→ Bullish divergence building on lower timeframes (1H / 4H)
→ Volume showing absorption at current support levels — institutional
accumulation signals present
→ Market structure: Higher Highs / Higher Lows still valid on Weekly
━━━━━━━━━━━━━━━━━━━━━━━━━━━━━━━━━━━━━━━━━━━━
🌍 REAL-TIME FUNDAMENTAL & ECONOMIC FACTORS
(6 August 2026 — Latest Market Intelligence)
━━━━━━━━━━━━━━━━━━━━━━━━━━━━━━━━━━━━━━━━━━━━
NOTE: The following fundamentals reflect WHAT THE MARKET IS SAYING
right now — not biased toward bullish or bearish. Read the data.
Trade the data. Stay neutral in mind, decisive in execution.
📌 1. EARNINGS GROWTH STORY — STRONGEST IN YEARS
Small-cap earnings fundamentals have continued to improve, with consensus
estimates indicating Russell 2000 earnings growth could meaningfully exceed
Russell 1000 in both 2026 and 2027. Consensus forecasts for Russell 2000
companies' 2026 earnings growth have climbed to 38% from about 23%
at the start of the year — reflecting broadening profit growth beyond
large-cap tech.
📌 2. AI RIPPLE EFFECT — THE SMALL-CAP CATALYST
The Russell 2000 has surged approximately 20% in 2026 — its best performance
since 2003 — as AI spending ripples beyond mega-cap tech into small caps.
Semiconductor and semiconductor equipment companies have been the biggest
winners, showing how the AI investment boom is filtering into the broader
small-cap universe. Small caps must now convert that AI infrastructure
positioning into real revenue growth to justify valuations going forward.
📌 3. FEDERAL RESERVE & INTEREST RATE SENSITIVITY
Small caps are hypersensitive to Federal Reserve policy. The Fed's rate
cuts in late 2025 (3 consecutive cuts to 3.50–3.75%) provided meaningful
relief to small-cap companies with high floating-rate debt exposure.
If the Fed maintains or continues a dovish path, liquidity conditions
remain favorable for the Russell 2000. Any hawkish surprise = negative
pressure on US2000. Watch Fed minutes and CPI data closely.
📌 4. VALUATION — STILL CHEAP VS LARGE-CAPS
As of mid-2026, small-cap stocks remained meaningfully less expensive
than large-caps based on EV/EBIT metrics. The Russell 2000 continues
to trade near the lower end of its historical relative valuation range
versus the Russell 1000. This relative discount continues attracting
capital rotation from richly valued mega-cap stocks.
📌 5. PROFITABILITY RISK — THE DARK SIDE
Over 40% of the Russell 2000 is currently unprofitable. This is a known
structural risk. Investors are increasingly rotating into quality small-cap
names with positive earnings. Watch for earnings misses in Q3 2026 —
they could trigger sharp selloffs within the index.
📌 6. DOMESTIC INSULATION — U.S. CONSUMER PLAY
Unlike the S&P 500, the Russell 2000 is less exposed to international
geopolitical shocks — Middle East tensions, European instability, and
China slowdown effects hit the index less directly. The index is a
pure play on the resilient U.S. domestic consumer and economic health.
Strong U.S. jobs data and consumer confidence = bullish for US2000.
📌 7. MACRO TAILWINDS TO WATCH
→ Reshoring / Infrastructure investment boom (domestically focused)
→ Tax policy and deregulation environment
→ AI productivity gains filtering into small-cap sectors
→ U.S. Manufacturing modernization cycle
→ Fed rate decisions (next FOMC meeting = key market event)
→ U.S. CPI / PPI inflation prints (upcoming — watch carefully)
→ U.S. Non-Farm Payrolls & Unemployment Rate — direct US2000 mover
→ Q2 / Q3 2026 Earnings Season — ongoing small-cap profit reports
━━━━━━━━━━━━━━━━━━━━━━━━━━━━━━━━━━━━━━━━━━━
🔗 RELATED PAIRS TO WATCH — CORRELATION RADAR 📡
━━━━━━━━━━━━━━━━━━━━━━━━━━━━━━━━━━━━━━━━━━━
📊 US EQUITY INDEX FAMILY (Direct Correlation):
→ US500 (S&P 500 Index CFD) — SPCFD:SPX
Correlation: HIGH POSITIVE ✅
When S&P 500 rallies with broad market participation, US2000 tends
to follow and often outperform. Risk-on breadth confirmation tool.
Watch if US500 breaks above key resistance — US2000 follows suit.
→ US30 (Dow Jones Index CFD) — AMEX:DJIA
Correlation: MODERATE POSITIVE ✅
Dow strength signals healthy blue-chip confidence. When the Dow
moves alongside US2000, it confirms broad market bullish sentiment
rather than narrow large-cap leadership only.
→ US100 (Nasdaq 100 Index CFD) — NASDAQ:NDX
Correlation: MODERATE POSITIVE / DIVERGENCE WATCH ⚠️
In 2026, US2000 has been OUTPERFORMING Nasdaq in many sessions —
a rotation signal. If Nasdaq corrects while US2000 holds — strong
bullish signal for small caps. If Nasdaq pumps while US2000 lags —
narrow market breadth, be cautious.
→ IWM (iShares Russell 2000 ETF) — AMEX:IWM
Correlation: NEAR PERFECT ✅
IWM is the ETF mirror of US2000. If IWM shows strong volume on
green days — institutional accumulation confirmed. Use IWM volume
data to validate US2000 momentum.
→ DXY (US Dollar Index) — TVC:DXY
Correlation: INVERSE / NEGATIVE 🔄
A weakening Dollar is generally BULLISH for US2000. A strong Dollar
pressures domestic small-cap earnings and sentiment. Watch DXY for
directional clues on US2000 momentum.
→ TNX (US 10-Year Treasury Yield) — TVC:TNX
Correlation: INVERSE / SENSITIVE 🔄
Rising yields = pain for unprofitable small caps (higher discount
rates). Falling yields = relief rally fuel for Russell 2000.
Watch the 10-year yield direction as a key confirmation signal.
→ VIX (CBOE Volatility Index) — TVC:VIX
Correlation: INVERSE ⚠️
VIX spike = risk-off = US2000 drops hard (small caps more volatile).
VIX below 20 = calm market = US2000 bullish environment.
Use VIX as a fear gauge before entering the trade.
→ GOLD (XAU/USD) — TVC:GOLD
Correlation: INDIRECT
Gold rising alongside equities = risk-on. Gold rising with falling
equities = fear hedge. Compare both for macro risk sentiment clarity.
━━━━━━━━━━━━━━━━━━━━━━━━━━━━━━━━━━━━━━━━━━━━
📅 UPCOMING NEWS & EVENTS TO WATCH 🗞️
━━━━━━━━━━━━━━━━━━━━━━━━━━━━━━━━━━━━━━━━━━━━
🔔 Key events that can directly impact US2000 / Russell 2000:
→ Federal Reserve FOMC Meeting Minutes & Rate Decisions
→ U.S. Consumer Price Index (CPI) Inflation Data
→ U.S. Non-Farm Payrolls (NFP) & Unemployment Rate Report
→ U.S. GDP Growth Rate (Q2 2026 Final Print)
→ U.S. ISM Manufacturing & Services PMI Data
→ Q2 / Q3 2026 Small-Cap Earnings Reports (ongoing season)
→ U.S. Consumer Confidence Index Updates
→ Any escalation in Geopolitical risks (Middle East / Russia-Ukraine)
→ AI sector earnings from Nvidia, Microsoft, AMD (ripple effect)
→ Tax policy / Deregulation announcements from Washington
━━━━━━━━━━━━━━━━━━━━━━━━━━━━━━━━━━━━━━━━━━━
THIEF TRADER MOTIVATION — THE OG CORNER
━━━━━━━━━━━━━━━━━━━━━━━━━━━━━━━━━━━━━━━━━━━
"The market is the world's biggest vault. But only patient, disciplined
and strategic thieves get to walk out with the bag." 🥷💰
"Don't trade what you FEEL. Trade what you SEE. The chart never lies.
Your emotions always do." 📊❌🧠
"A smart thief never gets greedy at the last second. Take your profits.
Lock your gains. And live to trade another day." 💸🔒
"Losses are tuition fees. Profits are your graduation gift. Keep paying
attention in class — the market is always the professor." 🎓📈
"Risk management IS your trading strategy. Without it, you're not a
trader — you're just a gambler with a fancy platform." 🛡️💪
"The best trade of your life might be the one you DIDN'T take.
Patience. Discipline. Process. Every. Single. Day." ⏳🥷
━━━━━━━━━━━━━━━━━━━━━━━━━━━━━━━━━━━━━━━━━━━
🙏 Dear Thief Traders & OG — Thank you for being here!
If this idea adds value to your trading day,
drop a 💬 COMMENT, and FOLLOW for daily Thief-style setups across
all major markets — Indices, Forex, Commodities & Crypto!
Remember: I am NOT your financial advisor. This is NOT financial advice.
This is a personal trade idea shared for educational and entertainment
purposes only. Always do your own due diligence. Trade your own plan.
Risk only what you can fully afford to lose. Capital protection FIRST. 🛡️
Good luck, stay sharp, stay patient —
and may the pips always flow YOUR way! 💰📈🥷
— The Thief Boss
Russel 2000 week 2-7 August 2026No Change:
The Russel 2000 closed this week at $2923.3 currently we have blown below our Fibonacci retracement of $3000.00 and have landed on downwards trend to test our 20 week moving average. Since the war on Iran is influencing the price of oil this week we are looking at testing the 20 week moving average closing next week down possibly 3%. If by chance we break down past the 3% landing at our next down leg of our retracement of around $2670 we may be looking at a deeper decline.
The Calm Before the Storm… or the Beginning of Something Bigger? Analysis | US2000 (Russell 2000) | 30-Minute Timeframe
Hello and welcome to all my TradingView friends and followers! 👋📈
I hope you're all having a great trading week. Today we're taking a look at the Russell 2000 Index (US2000), one of the most important benchmarks for U.S. small-cap companies and a valuable indicator of overall market risk sentiment.
🌍 Fundamental Outlook
Global financial markets are currently facing an unusually high level of uncertainty.
Recent geopolitical tensions and military conflicts in different regions have increased investor caution and reduced risk appetite. 🌍⚠️
At the same time, markets continue to deal with restrictive monetary policies, elevated interest rates, slowing economic expectations, and concerns about equity valuations.
As uncertainty rises, investors often reduce exposure to risk assets, hold more cash, and wait for stronger confirmation before committing capital. This environment usually leads to lower conviction and more volatile price movements. 💰📉
📊 Technical Analysis
Looking at the 30-minute timeframe, one feature immediately stands out:
The market has been trapped in a tight consolidation for nearly 50 trading days.
Buyers have repeatedly failed to push through the major resistance zone, while sellers have also been unable to break the key support area.
This type of prolonged compression often precedes a significant directional move. ⚡
Currently:
🔸 A descending dynamic resistance continues to pressure price from above.
🔸 A well-defined static support zone continues to absorb selling pressure.
As long as price remains inside this range, patience is essential.
A confirmed breakout from either side could provide the next high-probability trading opportunity.
✅ A bullish breakout above both the dynamic and static resistance could open the door toward previous highs.
❌ A breakdown below support could trigger a much stronger bearish move as sellers regain control.
🤔 The Big Question
Here's the question many traders are asking:
Could this prolonged lack of buying eventually turn into panic selling?
Is this lengthy consolidation simply the calm before a major move?
Are global markets approaching a deeper correction—or even the early stages of a broader financial downturn?
Or is this merely a healthy pause before another bullish continuation?
At this stage, there is no definitive answer, making disciplined risk management more important than ever. 🎯
📈 Possible Scenarios
🟢 Bullish Scenario
Break above dynamic resistance
Confirmation above the static resistance
Rising buying momentum
Move toward previous highs
🔴 Bearish Scenario
Breakdown below the current support
Increasing selling pressure
Stronger bearish momentum
Potential beginning of a much larger correction
📊 Community Poll
What do you expect next?
🟢 Bullish breakout
🔴 Major selloff
🟡 Continued consolidation
Share your opinion in the comments! 👇
⚠️ Disclaimer
This analysis reflects my personal interpretation of current market conditions based on technical analysis and macroeconomic factors. It is not financial advice or a recommendation to buy or sell any financial instrument.
Always perform your own research and practice proper risk management before entering any trade.
#US2000 #Russell2000 #Stocks #StockMarket #TechnicalAnalysis #FundamentalAnalysis #PriceAction #RiskManagement #TradingView #ForexCity #Support #Resistance #Breakout #MarketAnalysis #FinancialMarkets #Investing #Geopolitics #Volatility #MarketCrash #EconomicOutlook
Russel 2000 week of 25 - 31 July BearishThe Russel 2000 closed this week at $2934.90 currently we have blown below our Fibonacci retracement of $3000.00 and have landed on downwards trend to test our 20 week moving average (MA) . Since the war on Iran is influencing the price of oil this week we are looking at testing the 20 week moving average closing next week down possibly 3%. If by chance we break down past the 3% landing at our next down leg of our retracement of around $2670 (9% lower from where we currently are)we may be looking at a testing the 50 day moving average closing down close to 10%. If by luck things turn to the brighter side we could bounce and gain 2% back testing our $3000.00 retracement, but this is a long shot for the near term outlook. My thoughts for the upcoming week are BEARISH. project a 3% loss for the week closing on the 31st.
RUSSELL topped on a 19-year Cycle pattern. 2420 correction next?Russell 2000 (RUT) has been trading within a Channel Up since the March 2009 bottom of the Housing Crisis. On that Bear Cycle's Top (July 2007), a very distinct pattern started, which can be measured by the Time Cycles tool and shows (roughly) that every 3.5 - 4 years the Cycle tops and the index corrects on a Bear Cycle.
This is the first time that 4.5 years have passed (since the November 2021 Cycle Top) that we didn't have another Bear Cycle (early 2025 was a Bull Cycle correction).
All five Bear Cycles since the July 2007 Top, pulled back to at least the 1M MA50 (blue trend-line), hitting their respective 0.382 Fibonacci retracement levels in the process. Also, they all topped on Inner Higher Highs trend-lines as RUT did in June and now July. In addition, the 1M RSI has hit its Lower Highs trend-line and is reversing downwards.
As a result, there is a huge cluster of Resistances now and if Russell gets rejected (fails to close a 1M candle above), we expect a new medium-term Bearish Leg correction to start, targeting the 1M MA50 on the 0.382 Fib around 2420. That would also enter the 0.382 - 0.236 Channel Fib Zone, which is where the last two major market bottoms took place.
---
** Please LIKE 👍, FOLLOW ✅, SHARE 🙌 and COMMENT ✍ if you enjoy this idea! Also share your ideas and charts in the comments section below! This is best way to keep it relevant, support us, keep the content here free and allow the idea to reach as many people as possible. **
---
💸💸💸💸💸💸
👇 👇 👇 👇 👇 👇
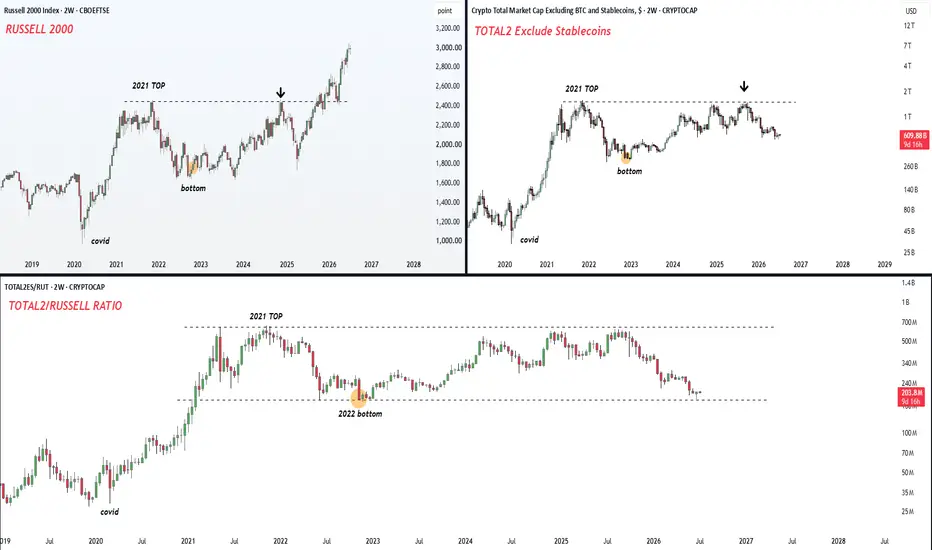
TOTAL2 Exclude Stablecoins vs Russell 2000his chart compares two different risk markets.
On the left, Russell 2000.
On the right, the crypto market excluding Bitcoin and stablecoins.
At the bottom, the relative ratio between the two.
The purpose is simple: Is the broader crypto market structurally dead, or is it still lagging behind traditional risk assets before a new rotation phase? Russell 2000 already completed its post 2021 repair.
It made the 2021 top.
It corrected.
It formed the 2022 bottom.
It retested the old high.
Then it broke out and moved into a new expansion phase.
TOTAL2 excluding BTC and stablecoins is following a similar broad structure, but with a clear delay.
It also made the 2021 top.
It also corrected into the 2022 bottom.
It also rebuilt through 2023 and 2024.
It also returned near the old high region.
But unlike Russell 2000, it has not confirmed a clean breakout yet.
That is the key difference. relative ratio is now near the same lower range that marked the 2022 bottom area. means the broader crypto market is not expensive versus Russell 2000 here.
It is deeply reset.
The ratio is sitting near a region where previous relative weakness reached exhaustion before recovery started.
That does not mean immediate expansion.
It means the market is back in a historical relative value zone.
For the bullish rotation thesis, two things matter now:
First, TOTAL2 excluding BTC and stablecoins must defend its higher base.
Second, the ratio against Russell 2000 must stop losing ground and start reclaiming the lower range. If that happens, the setup changes from lagging risk asset to relative recovery candidate. If the ratio breaks below the 2022 relative bottom and TOTAL2 loses its base, the structure weakens.
So the chart is not giving a completed signal yet.
It is showing a location.
Russell 2000 has already moved through its repair and breakout phase.
Crypto excluding BTC and stablecoins is still sitting at the delayed version of that same question. market is not asking whether altcoins are popular. Its asking whether the broad crypto risk curve can finally stop underperforming traditional small cap risk. the level to watch.