VELOUSDT Strong Short Opportunity at Trendline ResistanceVELOUSDT has reached a major descending trendline resistance after a sharp rally. This area offers a high-probability short setup if price confirms rejection.
Bearish target: 0.0032–0.0030 USDT.
A breakout and close above the trendline would invalidate the setup.
Trade your plan and always use pr
VELO / VELOUSDT Long Setup | Breaker Block ReclaimMARKET ANALYSIS
VELO is currently reacting from a key technical area highlighted on the chart.
As long as the protected support zone remains intact, the bullish market structure remains valid and higher liquidity targets may continue to attract price action.
A breakdown below the invalidation
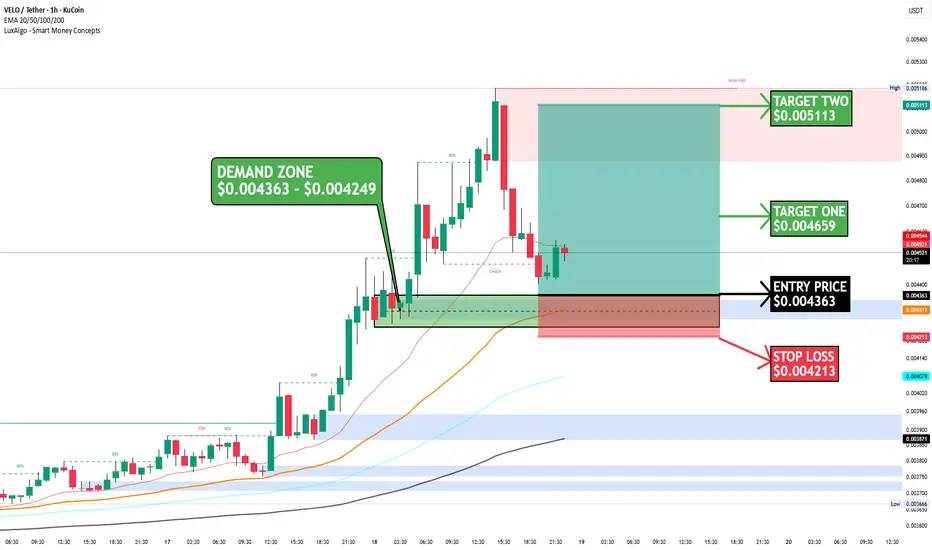
$VELO/USDT Looks Ready to BounceAlright fam, OKX:VELOUSDT just had a clean impulsive move up 📈 and now we’re seeing a healthy pullback into demand — not weakness, just structure doing its thing.
📊 Market Structure:
Bullish trend intact ✅
Higher highs + higher lows still in play
Current move = retest of demand after BOS
🟢 Key D
VELO price analysis — Potential End of Correction?CRYPTOCAP:VELO has been trading inside a broad multi-year range, and current price action suggests that the correction phase may be approaching exhaustion.
Key observations:
Price is near the middle boundary of a 4-year range
Volatility compression often precedes impulsive moves
Current marke
See all ideas
Summarizing what the indicators are suggesting.
Oscillators
Neutral
SellBuy
Strong sellStrong buy
Strong sellSellNeutralBuyStrong buy
Oscillators
Neutral
SellBuy
Strong sellStrong buy
Strong sellSellNeutralBuyStrong buy
Summary
Neutral
SellBuy
Strong sellStrong buy
Strong sellSellNeutralBuyStrong buy
Summary
Neutral
SellBuy
Strong sellStrong buy
Strong sellSellNeutralBuyStrong buy
Summary
Neutral
SellBuy
Strong sellStrong buy
Strong sellSellNeutralBuyStrong buy
Moving Averages
Neutral
SellBuy
Strong sellStrong buy
Strong sellSellNeutralBuyStrong buy
Moving Averages
Neutral
SellBuy
Strong sellStrong buy
Strong sellSellNeutralBuyStrong buy
Displays a symbol's price movements over previous years to identify recurring trends.