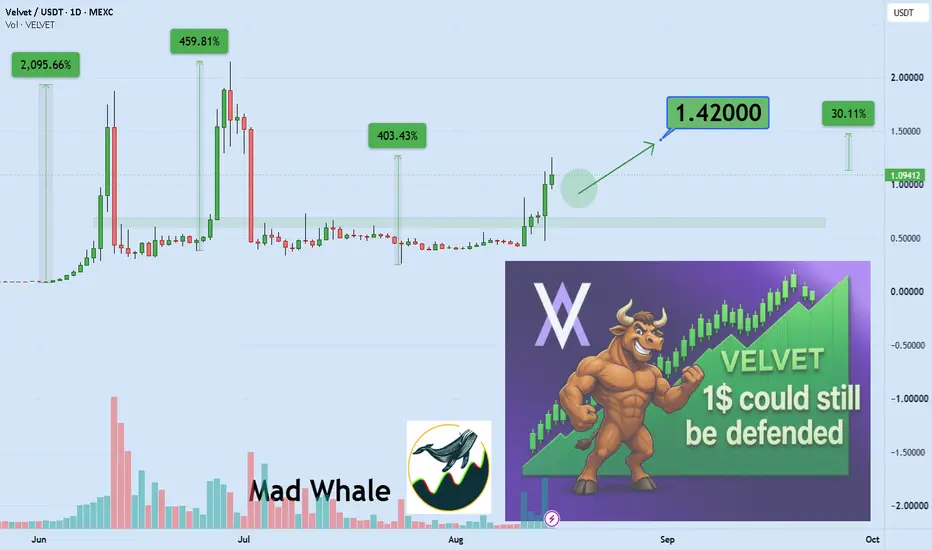
VELVETUSDT Forming Bullish MomentumVELVETUSDT is forming a clear bullish momentum pattern, a classic bullish wave signal that often indicates an upcoming breakout. The price has been consolidating within a narrowing range, suggesting that selling pressure is weakening while buyers are beginning to regain control. With consistent volume confirming accumulation at lower levels, the setup hints at a potential bullish breakout soon. The projected move could lead to an impressive gain of around 90% to 100% once the price breaks above the wedge resistance.
This bullish momentum pattern is typically seen at the end of downtrends or corrective phases, and it represents a potential shift in market sentiment from bearish to bullish. Traders closely watching VELVETUSDT are noting the strengthening momentum as it nears a breakout zone. The healthy trading volume adds confidence to this pattern, showing that market participants are positioning early in anticipation of a reversal.
Investors’ growing interest in VELVETUSDT reflects rising confidence in the project’s long-term fundamentals and current technical strength. If the breakout confirms with sustained buying volume, this could mark the start of a fresh bullish leg. Traders might find this a valuable setup for medium-term gains, especially as the momentum pattern completes and buying momentum accelerates.
✅ Show your support by hitting the like button and
✅ Leaving a comment below! (What is You opinion about this Coin)
Your feedback and engagement keep me inspired to share more insightful market analysis with you!
In-depth trading ideas
$VELVET | 4H | BUY SETUP | Hey traders 👋
What are your thoughts on MEXC:VELVETUSDT here?
We're looking at a bullish pullback and retest pattern on $VELVETUSDT. Price has recovered sharply off the chart low, currently sitting more than 68% above it and only just under 2% below the recent high, which points to strong underlying demand rather than a rejection.
The key level here is the $0.59191 to $0.54573 demand zone. This is the area buyers need to defend to keep the recovery structure intact, making it the main decision point for the trade.
In the short term, the focus is on whether price holds this zone on a retest rather than chasing the highs. A confirmed hold here is what keeps the bullish case alive.
On the bullish side, a confirmed hold of the demand zone with structure staying intact above $0.59271 opens the path toward $0.72800 as the first target, with $0.89271 as the next level up if momentum continues.
On the bearish side, a break below $0.53271 would invalidate the setup entirely. Worth noting too, MEXC:VELVETUSDT has a heavy vesting schedule running through June 2029, so supply pressure remains a background risk even if the chart holds up.
Let me know how you're reading this one, drop a like and share your thoughts in the comments 👇
Good luck with your trades ❤️
VELVET Featured as Top Low Cap PickCRYPTOCAP:VELVET Capital was shortlisted in a CoinMarketCap community article as one of the best low cap crypto projects for August 2026. It's backing from Binance Labs, and its core utility as a non-custodial DeFi asset management protocol for building tokenized funds. Risks noted include low total value locked (TVL) and a crowded DeFi+AI landscape. This is bullish for VELVET because it signals growing recognition and validates its fundamental proposition during a search for quality small cap projects. However, it underscores the need for the platform to boost user adoption and TVL to sustain momentum. CRYPTOCAP:VELVET 's price jumped with 24-hour volume soaring. This is bullish in the short term, demonstrating strong trader interest and successful catalyst execution. However, it's tempered by extreme supply concentration (top 100 wallets hold 99.81%), creating high volatility and distribution risk if large holders sell. Velvet is currently capitalizing on strategic exchange listings, analyst validation, and potent trading incentives, though its trajectory remains tightly linked to user growth and navigating its concentrated token supply. Will the platform's utility-driven model outlast the typical hype cycle of low cap altcoins?
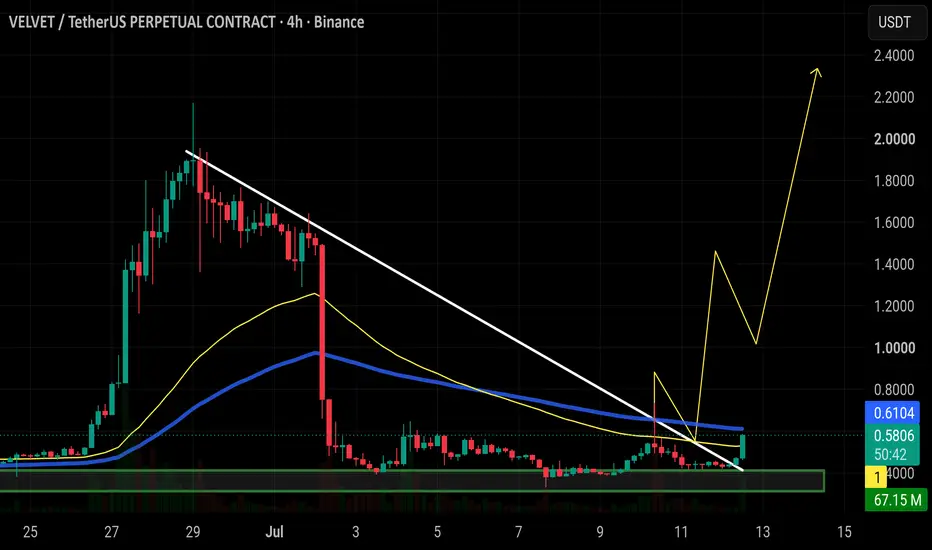
$VELVET has finally confirmed the breakout after the previous faCRYPTOCAP:VELVET has finally confirmed the breakout after the previous fakeout. This time, buyers managed to push price above the descending trendline.
Price is now testing the 50 & 99 EMAs, which are still acting as the key resistance. A strong 4H close above these levels, followed by a successful hold, would confirm growing bullish momentum and increase the chances of a continuation higher.
For now, the breakout is holding, and the next focus is reclaiming the EMAs.
$VELVET is finally testing the descending trendline after spendiCRYPTOCAP:VELVET is finally testing the descending trendline after spending days building a base above the demand zone.
Price is also pushing into the 50 & 99 EMA resistance. A clean 4H close above this area would confirm the breakout and could kick off the next strong leg higher.
This is a key decision point. Break and hold above resistance, and momentum can accelerate fast.
Beware velvet!Revelation 17:4 — "And the woman was arrayed in purple and scarlet colour, and decked with gold and precious stones and pearls, having a golden cup in her hand full of abominations."
VELVET was dressed in finery. The cup was full.
But the cup was always poisoned.
0.45 is where the scarlet woman fleeth with the gold.
The devs have left the building. So it was written.
$VELVET has already rallied more than 375%, and after a brief paCRYPTOCAP:VELVET has already rallied more than 375%, and after a brief pause it's trying to break above resistance once again.
This is the level I'm watching closely. If buyers can keep price above it and turn it into support, I think there's a good chance the move continues. The trend is still looking strong, and as long as this breakout holds, another push higher wouldn't be surprising. 🚀
VELVET - Wedge Pop into Compression
VELVET had a strong **wedge pop** off the lows.
Now the market is doing the important part:
It’s digesting the move.
Not dumping.
Not cleanly breaking yet.
Just compressing under supply while the 1H EMAs catch up underneath.
And getting **tight**
That’s where the opportunity starts to form.
🔭 HTF Context
The higher timeframe move came from a clean wedge pop and expansion through the 10/20 structure.
After that kind of move, I’m not looking for random continuation.
I want to see if participants are willing to **accept higher prices** after the first leg.
So far, VELVET is still holding the post-pop base. The EMAs are tightening. Volume has cooled off. Price is sitting near the upper side of the range.
That is constructive Crossback behavior.
But it is not confirmed yet.
🧱 LTF Structure
On the 1H, VELVET is compressing under a descending trendline.
What stands out:
• Lower highs pressing from above
• Support building underneath
• 10/20/50 EMAs tightening below price
• Volume drying up after expansion
• Price continuing to work back toward the top of the base
This is the kind of structure where I want to see **compression → expansion**, not chase inside the range.
♻️ Cycle Position
Current phase:
**Wedge Pop → Crossback attempt**
The wedge pop already happened.
Now the question is simple:
Does this base turn into continuation, or does price reject and rotate back through the range?
That answer comes from acceptance or rejection at the top of compression.
🟢 Continuation Scenario
Continuation improves if VELVET breaks the descending trendline and starts accepting above the recent highs.
What I’d want to see:
• Break above compression
• Strong close near highs
• Volume expansion
• EMAs turning up underneath price
• Pullback holding above the breakout zone
If that happens, this starts to shift into a cleaner **Crossback Breakout** setup.
🔴 Failure Scenario
Failure starts if price rejects the trendline again and loses the 1H EMA cluster.
What weakens the structure:
• Breakout attempt with no participation
• Upper wick rejection back into the range
• Loss of the 10/20/50 structure
• Acceptance below the recent base lows
If that happens, the wedge pop likely needs more repair before continuation can be trusted.
🎯 Execution Mindset
This is not a blind long because it’s coiled.
The trade only improves if price confirms acceptance above compression.
Until then, VELVET is still inside the base and still dealing with overhead rejection.
I’m watching the trendline, EMA cluster, and volume.
Break.
Accept.
Defend.
That’s the process.
**Not a signal. Just how I’m reading structure and participation.**
VELVET USDT SHORT SIGNALVelvet /USDT – Trade Setup (SHORT)
📈 Position Type: SHORT
🕒 Timeframe: 1 H
📊 Market: Futures
💰 Entry Zone:
1.84
🛑 Stop-Loss:
1.91
🎯 Take-Profit Targets:
• TP1: 1.6763
• TP2: 1.5655
• TP3: 1.4518
• TP4: 1.3411
TP5: 1.3353
TP6: 11937
⚙️ Leverage:
5-3
⚠️ After reaching TP1, move Stop-Loss to Entry Price.
📌 Risk Management:
Risk only 1–2% of your capital per trade.
Always confirm the setup on your chart before entry
$VELVET delivered exactly as expected.CRYPTOCAP:VELVET delivered exactly as expected. 🚀
The breakout from the multi day consolidation was clean, and once buyers reclaimed the key resistance, momentum accelerated fast. Every target was hit, with price rallying more than 117% from the breakout zone.
Congratulations to everyone who trusted the analysis and held through the breakout. More opportunities are always around the corner. 📈🔥
$VELVET breakout is officially live! Broke right through CRYPTOCAP:VELVET breakout is officially live! Broke right through that descending trendline and reclaimed the MAs on the 3H frame. If buyers hold the line here, momentum is going to accelerate fast. Next stops: 0.50, 0.70, and then the macro targets. Let's see if the bulls can deliver. 🔥
#VELVETUSDT 1h#VELVETUSDT 1h
VELVET has grown around 1800% in 11 days.
Red zones are suitable for short positions, and blue zones are suitable for long positions after confirmation.
Leverage: 5x or up to 10x.
Long entries are generally easier with 1–2% risk per trade. Shorts require more caution since the main trend is bullish, so risk should be kept small.
On this timeframe, we are seeing a CAPS pattern, which is more suitable for traders who are strong in price action.
We’re watching it closely.
#VELVET
CRYPTOCAP:VELVET
VELVETUSDT.P Bearish Divergence Alert | Potential Short Setup#VELVETUSDT.P has been trading in a strong uptrend backed by solid volume, showing clear bullish momentum over the past sessions. However, the market is now displaying the first signs of weakness.
On the 1-hour timeframe, a bearish divergence has formed between price action and momentum, often considered an early warning signal that buyers may be losing strength.
Key Observations:
Strong uptrend remains intact
High-volume market participation
Bearish divergence on the 1H timeframe
Potential trend exhaustion developing
Trade Plan:
I am not entering immediately. For additional confirmation, I will wait for price to break below the previous support level. A confirmed breakdown could trigger a bearish move and provide a high-probability short opportunity.
Entry: After confirmed support breakdown
Stop Loss: Above recent swing high
Target: Based on the next major support zone
Risk Management: Never risk more than your trading plan allows
Remember, divergence is a warning signal—not a trade signal by itself. Patience and confirmation are key.
What's your view on #VELVETUSDT.P?
Do you expect a deeper correction or continuation of the uptrend? Share your analysis in the comments!
👍 Like • 💬 Comment • 🔔 Follow for more crypto trade setups and price action analysis.
#VELVETUSDT #VELVET #CryptoTrading #CryptoSignals #PriceAction #TechnicalAnalysis #TradingView #CryptoAnalysis #BearishDivergence #ShortSetup #DayTrading #SwingTrading #Altcoins #CryptoMarket #SupportBreakdown #RiskManagement #TradingStrategy #ChartAnalysis #SmartMoneyConcepts #SMC #ICTTrading #BinanceFutures #FuturesTrading #TraderLife #Cryptocurrency
An Open Letter to Crypto Exchanges: LAB, BEAT, VELVET — The Rug
This week, three tokens with nothing in common — LAB, BEAT and VELVET — printed the same chart at the same time. A flat line. A vertical candle. Then leveraged retail liquidated on both sides. LAB is up over 7,700% year-to-date. BEAT ran ~1,480% in thirty days. VELVET did ~1,290% in seven. Nobody who has watched this market for more than one cycle believes that is organic.
The playbook is public knowledge now, documented by on-chain investigators like ZachXBT and Bubblemaps across the same family of tokens: RAVE, LAB, SKYAI, RIVER, SIREN. Keep the real float tiny — analysts estimate insiders hold over 84% of BEAT's supply and over 95% of LAB's. Get a top-tier listing, because retail reads a major exchange listing as due diligence. Light up the trending page. List perpetuals so the move can be levered. Pump into illiquidity, harvest the longs who chase and the shorts who get squeezed, and exit into the only real buyers in the book: the exchange's own customers.
The investigators have documented who runs the scheme. But the exchanges sell the tickets. You collect the listing fee, the trading fees, and the liquidation revenue — and when the token is down 90%, you move quietly to the next listing. You are not a neutral venue. You choose what to list, what to promote, and how much leverage to offer on a token with weeks of history and no verifiable float. Those are editorial decisions, and you are accountable for them.
And this — exactly this — is why people do not believe in crypto. Not because the technology failed. Because every cycle, a new wave of users learns on their first deposit that the structure is built against them, and they never come back. You are converting your own future customer base into exit liquidity. The serious, long-term capital this industry says it wants will not allocate to venues where a vertical candle on a 95%-insider token passes surveillance without comment. You will never have good players at a table everyone can see is rigged.
What would change this is not complicated:
— Independently verified circulating float and holder-distribution disclosure before any listing.
— Market-maker agreement terms made public.
— No leveraged perpetuals on a token until float and spot liquidity mature.
— Price bands and circuit breakers on new and low-float listings.
— A public post-mortem, with data, every time a listing prints a candle like LAB, BEAT and VELVET just did.
— Actual compliance with MiCA Title VI for EU clients: detect, prevent and report manipulation. Articles 91 and 92 are law, not suggestions.
Until then, every "trade responsibly" banner is decoration on a casino door — and every chart like these three is another thousand people who tell their friends crypto is a scam. They are not wrong about the experience you sold them.
Manel
Founder, Convexa Capital — Porto, Portugal
$VELVET $1.50+ loading… don't say you weren't warned MEXC:VELVETUSDT will tap the demand zone ($0.65 – $0.57) and bounce HARD 💥
After a monster 765% weekly pump, this dip was just a reload 🔄
Demand zone held perfectly on the 1H chart 📊
Supertrend still screaming BULLISH at $0.60 ✅
Trade.xyz integration = fresh catalyst still in play 🔥
Bulls defend this zone → $1.00 is the next stop 🎯
Break above ATH → price discovery, NO resistance above 🚀
This ain't a top. This is a retest before the next leg up 📈
#VELVET #DeFi #Crypto #AltSeason
VELVET – 45% Correction Ahead? VELVET has posted strong gains, but after an extended rally, signs of profit-taking are starting to appear. If momentum continues to weaken and key support levels fail to hold, a 45% correction could become a realistic scenario.
While a pullback of this size may seem significant, it’s not uncommon after major upside moves and can help reset market sentiment before the next trend develops. Traders should watch volume and support zones closely for clues about the next direction.
The coming sessions could be crucial in determining whether VELVET continues higher or enters a deeper correction phase.
VELVET/USDST - Reversal Setup with 30% UpsideAfter a prolonged downtrend, price is showing signs of stabilization and potential bottoming. Support is being established, and any bullish confirmation from this zone could trigger a strong reversal move. The setup offers a high upside potential (~30%) with clearly defined risk below the recent lows.
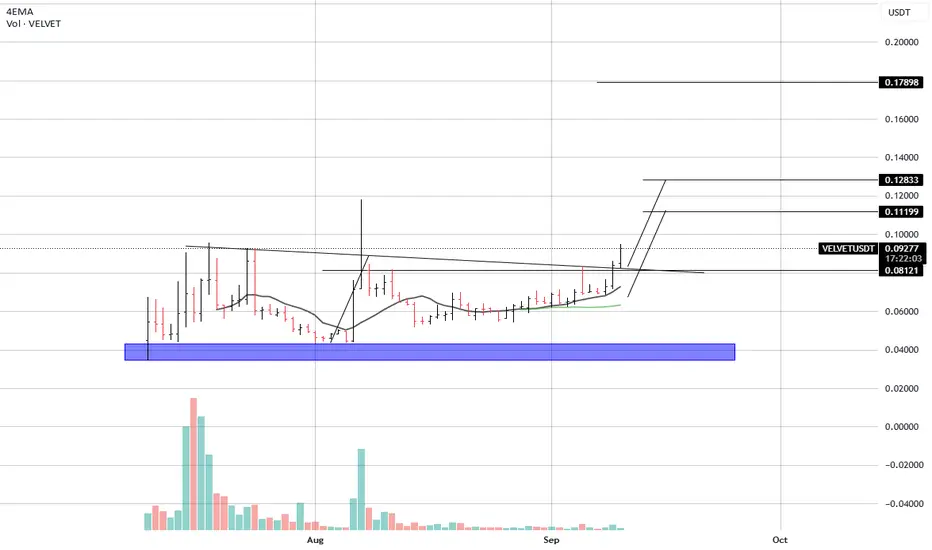
VELVET/USDT – Breaking Out of the Shadows!Hey there! Here i am :-)
Date: September 10, 2025
VELVET has been quietly consolidating, but now the chart is showing signs of life. After weeks of low-volume sideways action, price is finally breaking above resistance and looks ready to test higher levels.
🔍 Technical Snapshot:
Current Price: $0.092
EMA Levels:
4EMA: $0.0726
Key support: $0.0812
👉 Price has cleanly reclaimed moving averages, suggesting momentum is shifting to the upside.
📊 Chart Structure & Price Action:
A long accumulation phase built a strong base around $0.04 (blue support zone).
Multiple rejections at $0.081–0.082 created a resistance lid that is now breaking.
The breakout is backed by a steady increase in volume, giving credibility to the move.
📉 Supports to Watch:
$0.0812 (former resistance, now support)
$0.063 (short-term EMA support)
$0.04 (major demand zone)
📈 Upside Targets:
First target: $0.1119
Next: $0.1283
Full extension: $0.1789
📊 Momentum & Volume:
RSI (not shown but implied by setup) is climbing, yet not overextended — leaving room for continuation.
The breakout comes after tight compression, often a sign of strong upcoming volatility.
🎯 Creative Bullish Outlook:
VELVET has been like a sleeping giant, consolidating in silence while traders lost interest. Now, with price breaking above $0.09, it’s waking up. If momentum holds, we could see a wave of buyers chasing higher levels toward $0.11 and $0.12.
The real acceleration would come if $0.128 is cleared — opening the door to $0.178, where major liquidity sits.
📉 Invalidation:
A failed breakout and close back under $0.081 would weaken the setup.
Losing $0.063 would confirm the move was a fake-out, bringing price back to the $0.04 base.
⚡ Summary:
VELVET is breaking out of months-long consolidation. As long as price stays above $0.081, momentum favors bulls with targets at $0.11 → $0.128 → $0.178.
good trading :-)