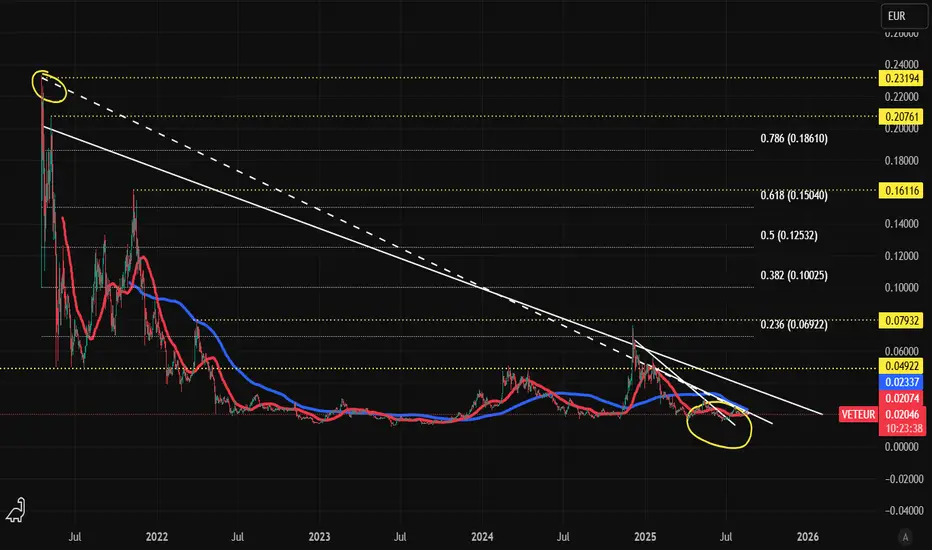
Can anyone help me charting VET?Can anyone help me with charting VET. I am trading at the Daily. Daily stock heading to the bottom. Still in A phase. 50/200MA cross about to come. I want to sort out my TP. The yellow dotted lines are resistances. I took a Fib from ATH at dec 2021 to the bottom (yellow circles). Did I draw the Fib
 Long
Long