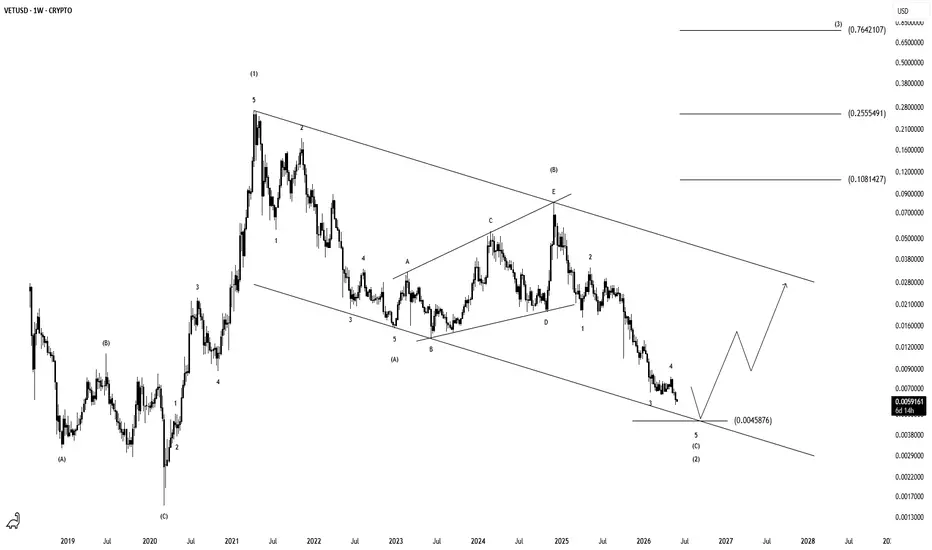
VET/USDI think the VECHAIN currency is in a correction process after 5 years. It is approaching the end of the time and price correction and after completing wave 5 of C of super wave 2 in the price range specified on the chart, you can be a buyer and I think it is worth holding. For wave 3, it has a very high price target and you can count on this currency as a profitable investment for the next 2 years. I am looking at a minimum profit of 2000% and remember that big profits come with patience. Finally, it should be noted that these analyses are purely personal opinions and I have no responsibility for your buying and selling. Thank you for your attention to this issue.
In-depth trading ideas
VeChain near critical support as traders position for upside moCurrent Price: 0.0115
Direction: LONG
Confidence level: 47%(Trader insights cluster around the same support and recovery levels, but overall conviction remains cautious due to limited data breadth)
Targets
Target 1: 0.0125
Target 2: 0.0130
Stop Levels
Stop 1: 0.0110
Stop 2: 0.0105
Wisdom of Professional Traders:
This setup pulls together the collective thinking of professional traders who have been analyzing VeChain across several detailed market breakdowns. When I step back and look at the crowd wisdom, traders consistently frame VeChain as an altcoin deep into a macro correction, now approaching levels where downside pressure historically slows. Even without aggressive optimism, the repeated focus on the same price zones gives us a usable short-term framework for this week.
Key Insights:
Here’s what’s driving this trade. Several traders repeatedly highlighted the 1.25 cent area as the key level that would signal a shift toward recovery. They stressed that VeChain doesn’t need explosive volume yet, but it does need to defend the lower range around 1.0–1.1 cents to avoid further weakness. With price currently around 1.15 cents, we’re sitting much closer to support than resistance, which tilts risk-reward upward for a tactical long.
Another important theme is positioning. Many traders pointed out that VeChain is down roughly 80–85% from previous cycle highs. In their view, this kind of extended drawdown often leads to sharp countertrend moves once sellers are exhausted. The tone across analyses wasn’t hype-driven; it was patient and structural, which I generally trust more for short-term mean reversion trades.
Recent Performance:
You can see this context reflected in recent price action. VeChain has slipped gradually over the past week and is trading near $0.0115 with about $14 million in daily volume. Momentum is soft, but the decline has been orderly rather than panic-driven. That kind of slow drift into support often sets the stage for a bounce if buyers step in.
Expert Analysis:
What caught my attention is how consistent the level discussion was across different trader analyses. Multiple traders clearly said they want to see price reclaim 1.25 cents before turning more aggressive, but they also emphasized watching the current zone closely rather than pressing shorts here. That tells me downside conviction is limited at these levels, which supports a cautious long bias for a weekly trade.
News Impact:
On the news front, there’s no fresh negative catalyst hanging over VeChain right now. With headlines relatively quiet and broader crypto markets stabilizing, price action is being driven mainly by technical structure. Web-based market commentary leaned constructive, pointing to ecosystem development and partnerships as longer-term positives, which helps limit downside pressure in the near term.
Trading Recommendation:
Putting it all together, I’m going LONG on VeChain for a short-term trade this week. Price is sitting near support zones that many professional traders flagged as critical, with defined upside toward $0.0125 and $0.0130 if momentum improves. This isn’t a high-conviction setup, so I’d keep position size modest and manage risk tightly. A clean break below $0.011 would invalidate the idea quickly, while a move higher offers an attractive reward relative to risk.
VLong
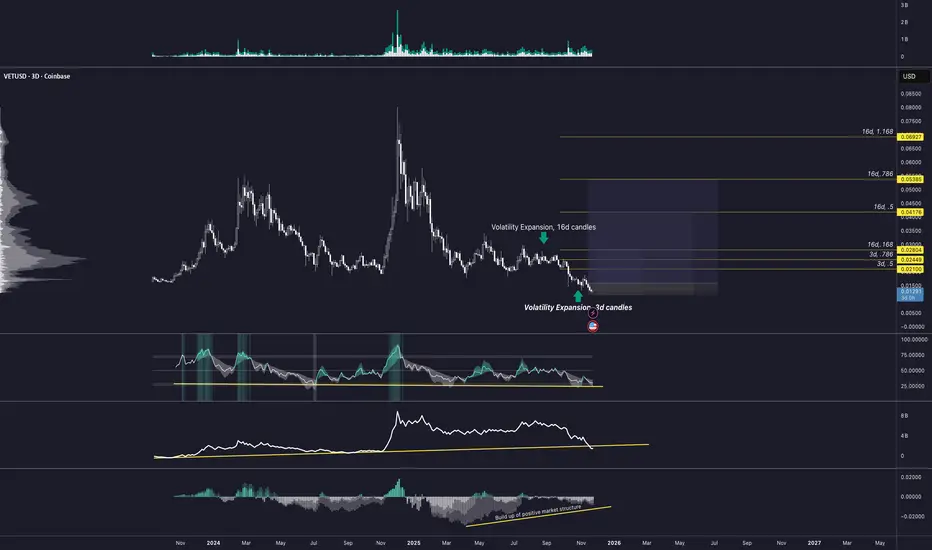
VET - BullishThis chart highlights how VET behaves when volatility expansion occurs at major swing levels.
There are two clear reference points marked.
The first is the expansion that lasted sixteen candles. That move defined the prior expansion cycle and shows how price behaves when it breaks out of a compressed range with rising volatility. It also provides a baseline for cycle duration and expected reach.
The second is the current three day expansion signal on the right side of the chart. Price is pressing into a multi-month support floor while the market has been contracting for an extended period. This is the same condition that preceded the last major expansion. The repeated small-range candles, declining volatility, and low momentum readings all confirm compression.
The expansion targets are mapped using both the three day and sixteen day fib projections. The initial levels sit at zero point zero two four four nine and zero point zero two eight two zero four. The extended cycle levels sit at zero point zero four one seven six, zero point zero five three eight five, and zero point zero six nine two seven. These reflect the historical reach of prior volatility expansion cycles and outline the potential move if the current base holds.
The shaded zones represent the probable path of expansion if volatility normalizes. The key point is that price is forming another expansion trigger at the bottom of the range while the broader structure remains unchanged. When these conditions align, the market has repeatedly responded with strong multi-week expansion cycles.
$VET Contracting Diagonal ScenarioNYSE:VET could be forming a contracting diagonal
If true, wave 3 can be a 4000% from here
Thank you for your support
Łama
VLong
VeChain revisits its 2020 demand zone## **VeChain (VET/USD) — Macro Structural Analysis | Monthly Outlook**
### 🧭 **Market Context**
As of **October 2025**, VeChain (VET) has returned to the **same macro demand zone** that formed in **October 2020**, the foundation of its previous bull cycle.
The **flash crash this month** brought the price down to a historical accumulation level between **$0.009 – $0.013**, creating a structural mirror of the early 2020 setup before the 2021 rally.
This move suggests that VET is now testing a **critical long-term support**, aligning with the broader market phase where altcoins typically consolidate before a new expansion cycle.
---
### 📊 **Technical Structure**
* **Support Zone:** $0.009 – $0.013
* **Resistance Range:** $0.035 – $0.050
* **Macro Invalidation:** Monthly close below $0.009
The current monthly candle shows **a deep wick and strong price rejection**, signaling possible *liquidity absorption* at the lows.
Maintaining this structural base above **$0.013** could confirm a **macro bottom formation**, with potential continuation toward **$0.05 – $0.07** during **Q2–Q3 2026**, particularly if **Bitcoin dominance** begins to decline as projected.
---
### 🪙 **Fundamental Overview**
VeChain remains one of the leading **enterprise-focused Layer-1 blockchains**, providing real-world solutions in **supply chain management, logistics, and carbon tracking**.
* **Market Cap:** ≈ $1.25B
* **Circulating Supply:** ≈ 72.5B VET
* **On-Chain Metrics:** Stabilizing activity and rising VTHO consumption indicate renewed network usage.
This fundamental resilience supports the idea that VeChain could be entering a **re-accumulation phase**, mirroring the 2020–2021 structural rhythm.
---
### 🔭 **Outlook**
If this historical symmetry continues, VeChain could remain within a **sideways accumulation structure** until **April 2026**, before initiating a new bullish expansion phase.
A confirmed break above **$0.035** would likely mark the first signal of structural recovery across the altcoin sector.
---
### ⚠️ **Disclaimer**
This analysis is for **educational and informational purposes only** and does **not constitute financial advice**.
All opinions represent my **personal market perspective** and may change without notice.
Trading cryptocurrencies involves **significant risk**, and investors should perform their own research or consult a licensed financial advisor before making decisions.
VeChain Stock Chart Fibonacci Analysis 090325Trading Idea
1) Find a FIBO slingshot
2) Check FIBO 61.80% level
3) Entry Point > 0.024/61.80%
Chart time frame:B
A) 15 min(1W-3M)
B) 1 hr(3M-6M)
C) 4 hr(6M-1year)
D) 1 day(1-3years)
Stock progress:A
A) Keep rising over 61.80% resistance
B) 61.80% resistance
C) 61.80% support
D) Hit the bottom
E) Hit the top
Stocks rise as they rise from support and fall from resistance. Our goal is to find a low support point and enter. It can be referred to as buying at the pullback point. The pullback point can be found with a Fibonacci extension of 61.80%. This is a step to find an entry-level position. 1) Find a triangle (Fibonacci Speed Fan Line) that connects the high (resistance) and low (support) points of the stock in progress, where it is continuously expressed as a Slingshot, 2) and create a Fibonacci extension level for the first rising wave from the start point of the slingshot pattern.
When the current price goes over the 61.80% level, that can be a good entry point, especially if the SMA 100 and 200 curves are gathered together at 61.80%, it is a very good entry point.
As a great help, TradingView provides these Fibonacci speed fan lines and extension levels with ease. So if you use the Fibonacci fan line, the extension level, and the SMA 100/200 curve well, you can find an entry point for the stock market. At least you have to enter at this low point to avoid trading failure, and if you are skilled at entering this low point, with the fibonacci6180 technique, your reading skill of to chart will be greatly improved.
If you want to do day trading, please set the time frame to 5 minutes or 15 minutes, and you will see many of the low points of rising stocks.
If you prefer long-term range trading, you can set the time frame to 1 hr or 1 day
$VET Vetchain - A very generous Bullish scenario (ShortTerm)NOT FINANCIAL ADVICE
This is a very generous idea that considers the bullish scenario for $VET.
The risk/reward ratio is 7.5 (317% upside vs42.5% downside).
However, this is only due to the really high beta that NYSE:VET posits.
It's a risky trade, sure, but the rewards are sweet -- if this plays out.
V
VETUSD – VeChain’s Wave Finale: Road to $0.62VeChain (VETUSD) is showing bullish intent with momentum accelerating out of a defined trend channel. I would like to highlight the technical analysis suggesting a potential wave culmination at the $0.62 mark—a sharp leap from its current price of $0.0247. Backed by strong volume and RSI movement, the setup hints at investor optimism and possible breakout continuation.
- Wave Projection: Interpret the technical channel and present a wave count culminating in the $0.62 target.
- Price Action: Emphasize the recent surge (+13.18%) as a catalyst for bullish sentiment.
- Volume & RSI: Use indicators shown in the chart to validate potential continuation.
- Risk Disclosure: Note that speculative wave targets should be assessed with broader market confirmation.
“Do you see VET following through to the projected wave target, or do you anticipate a mid-wave correction? Drop your analysis and let’s discuss.
VLong
VET - Garbage (For This Cycle) Until Proven Otherwise20 minute technical work-through.
VET has a terrible chart and may be one of quite a few coins to be printing a multi cycle bear market..
This means that anyone holding VET this cycle or even from previous cycle may see their positions erode significantly or even lose everything.
Just to be clear I have been bullish Bitcoin and bought many altcoins and made many bullish threads since January 2023...
But the point is that it takes skill to pick the best coins and when to buy them.
The days of hodling with 0 technical awareness are over.
Buying coins with "great fundamentals" that perhaps performed well in previous cycles, is now a great way to donate to the market and lose everything.
I'll attach my bearish THETA thread as well as some bullish threads that I have made through this cycle.
For those of you that dont know of my content, I posted a lot of successful bearish content in the previous market cycle also and I will post my bearish VET thread from 2021 also.
These days TrandingView only allows 5 linked threads - check them out if you like 👍
Not advice.
VShort
VET about to start new impulse upVET is oversold, sitting at rising RSI support line and has developed similar pattern as XRP. Last capitulation dip seem also done - expanded flat correction.
If so we can expect from here strong bounce up and push toward ATH range where some consolidation before breaking to new ATH - targets being fibb 1.272 and fibb 1.618 extensions.
VLong
VeChain: Struggling…VeChain is struggling to stay above the key support at $0.018, but the anticipated low of the orange corrective wave ii should form above this red line – or may have already done so. Once the bottom is indeed settled, we expect the orange wave iii to break out impulsively, pushing well beyond the $0.08 resistance, where the entire orange five-wave move should ultimately complete the blue wave (iii). However, if VET falls below $0.018, the broader green wave alt. will reach a new bear market low (probability: 38%). Primarily, we consider wave as already finished.
V
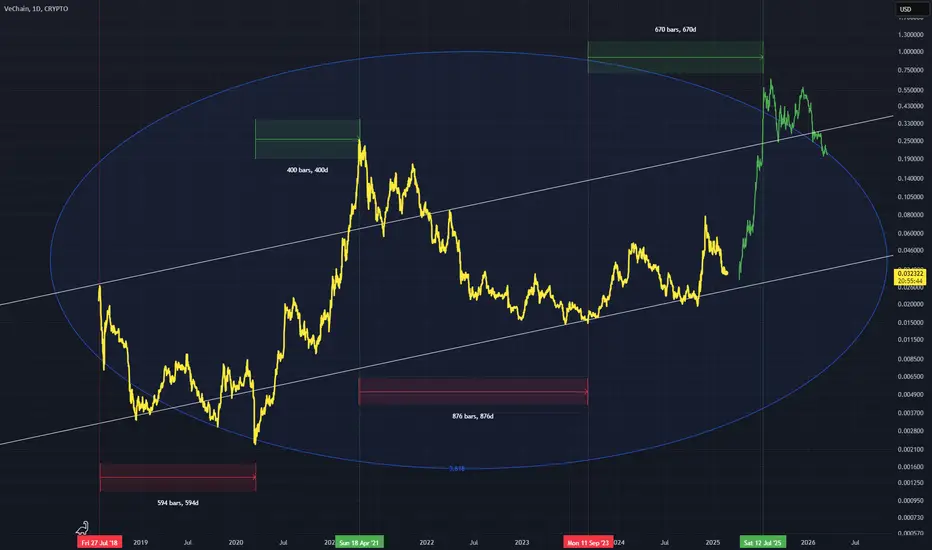
VETUSD - Using Fib Circles AgainPrice showing strong affinity for 3.618 on the fib circle trend line i have drawn
I expect a strong bull move up to like 40c
Also plotting durations of bear and bull markets, with the first bear/bull market cycle being slightly shorter than the one we are experiencing now, meaning a longer bull period for the one we are in
Trying the fib circles again, 3.618 is the level in question
Bars pattern in green shows price movement up to 40c
Daily timeframe
VeChain: Down AgainAfter a brief recovery, VeChain is trending lower once more. The low of the orange wave ii from early February is approaching but shouldn’t be undercut for the structure of the orange impulse wave iii to remain intact. Soon, we expect a decisive and sustained breakout of this wave iii above the resistance at $0.08. As a mid-term target, the entire orange five-wave sequence should ultimately complete the blue wave (iii).
V
Vechain to 0.35 usdVechain is one of, if not the most widely integrated tech we’ve seen so far. With Walmart China an bmw Germany using the chain, and Vechain being the official blockchain of the ufc, it’s got a good foot on the ground in real world assets. Seeing as the rwa sector of crypto is largely untouched I believe it will be the next .com boom. The “crypto has no real use” crowd will fomo in, grannies will understand the point, and feel safe investing in coins with real world asset backing. Each bull run after btc and ethereum peak we see the money trickle down into smaller cap utility token sectors, gaming being an example the past 2 bull runs. Don’t believe me, go see 10-50xs for yourself. Check the times compared to btc and eth. Currently Vechain has around 3b mc, sitting at #6 in rwa tokens. I think 30b mc is easily on the table after years of research and gains. Thanks for reading.
VLong
VET Going Up!?!?!?!!!!VET is looking Substantial! It made a higher high on the near term & is testing the overall resistance of the top range, watch it go to that top range maybe having a retest of the bottom high before that
VLong
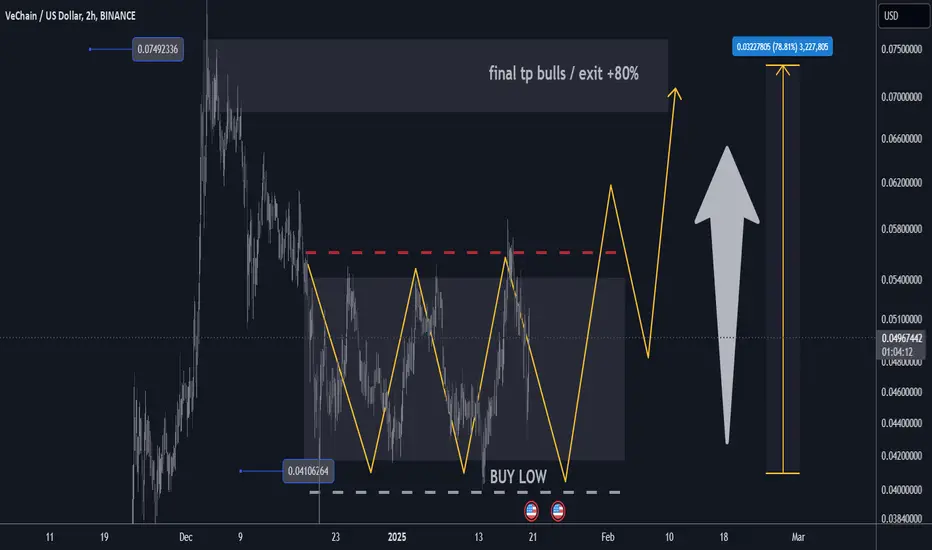
VETUSD H2 Best Level to BUY/HOLD +80% gains🔸Hello guys, today let's review 2hour price chart for VET. Outlook remains bullish currently pullback in progress, however buying low still is a perfect trade setup.
🔸VET is currently re-accumulating for a re-test of recent high set at 0.075. risk/reward shifts in bulls favor towards range lows of the recent range set at 0.04.
🔸Recommended strategy bulls: Price action contained within bullish channel. get ready to buy low near 0.04, TP is 0.075USD +80% gain. BUY/HOLD setup for patient traders.
🎁Please hit the like button and
🎁Leave a comment to support our team!
RISK DISCLAIMER:
Trading Futures , Forex, CFDs and Stocks involves a risk of loss.
Please consider carefully if such trading is appropriate for you.
Past performance is not indicative of future results.
Always limit your leverage and use tight stop loss.
VLong
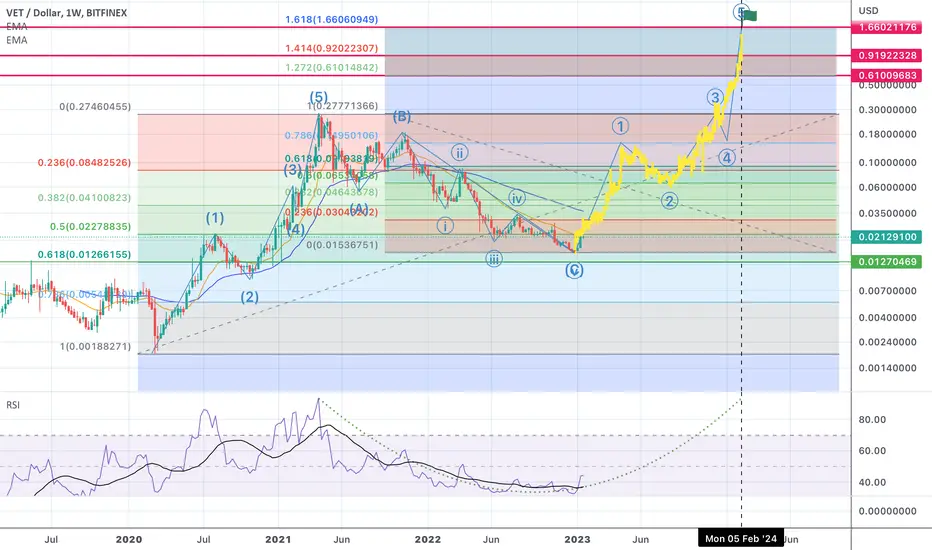
FIB TARGETS FOR $VET IN NEXT BULL RUNIF $VET bottomed in Dec 2022 then fib targets for the next bullrun are as follows:
1.272 Fib = $0.61
1.414 Fib = $0.92
1.618 Fib = $1.66
Fractal from last bullrun indicates a top in early 2024 - this is highly speculative but shows what is possible
VLong
VeChain Macro ViewWe all know that markets behave very cyclical. Top to top and bottom to top days are almost exactly the same (give or take a few days).
If the amount of days stay the same, we could see a market top at the end of 2023 or at the beginning of 2024.
VeChain is also printing an inverted H&S. This is a bearish to bullish reversal pattern. And it started exactly at the 600 day when the bottom was in.
We will see what happens at the next 8 months.
VLong