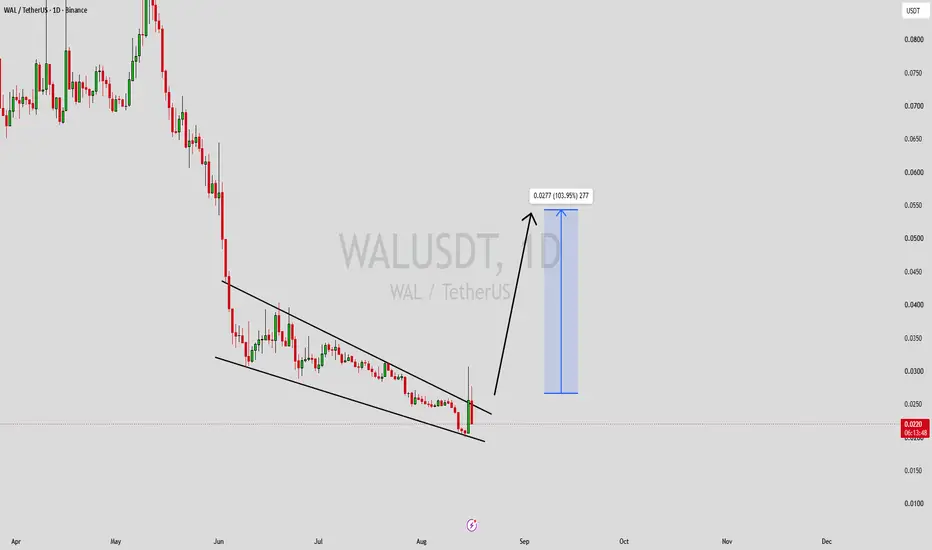
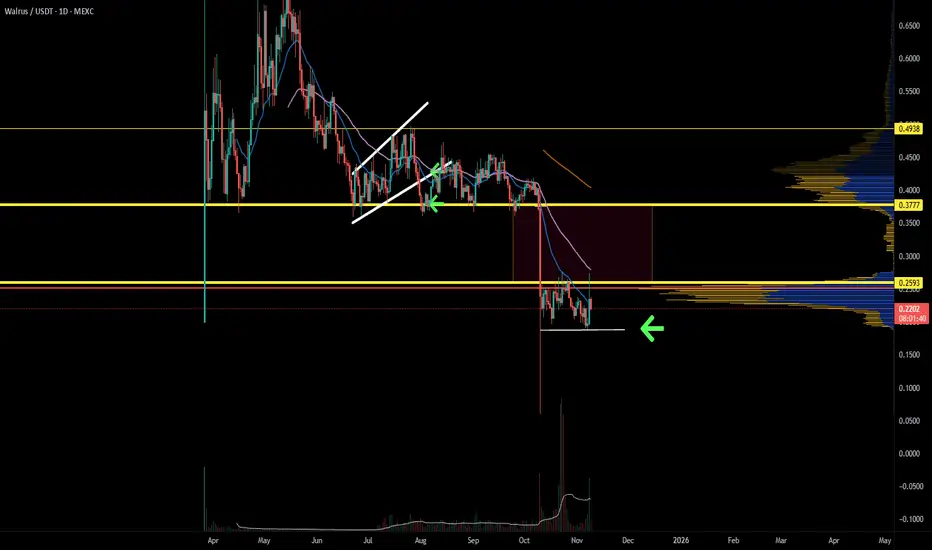
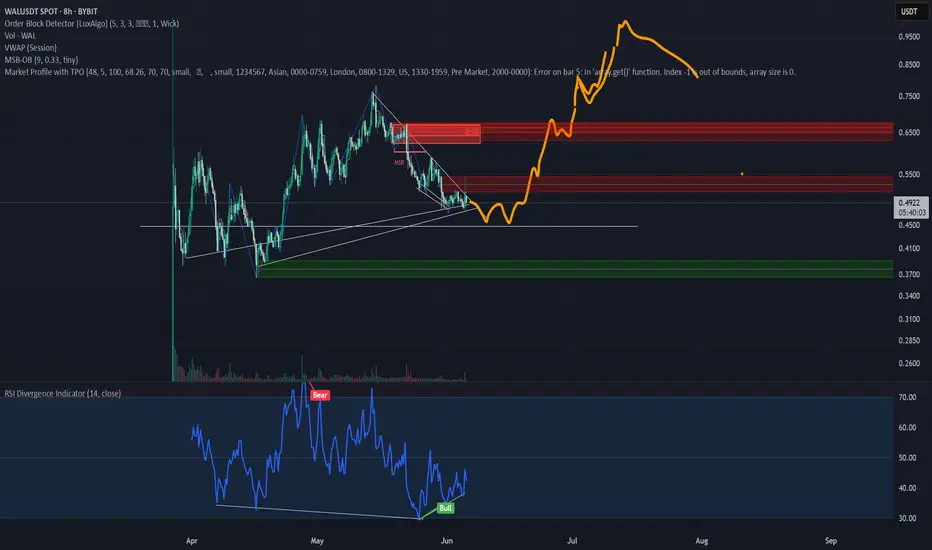
WALUSDT Forming Falling WedgeWALUSDT is forming a clear falling wedge pattern, a classic bullish reversal signal that often indicates an upcoming breakout. The price has been consolidating within a narrowing range, suggesting that selling pressure is weakening while buyers are beginning to regain control. With consistent volume confirming accumulation at lower levels, the setup hints at a potential bullish breakout soon. The projected move could lead to an impressive gain of around 90% to 100% once the price breaks above the wedge resistance.
This falling wedge pattern is typically seen at the end of downtrends or corrective phases, and it represents a potential shift in market sentiment from bearish to bullish. Traders closely watching WALUSDT are noting the strengthening momentum as it nears a breakout zone. The good trading volume adds confidence to this pattern, showing that market participants are positioning early in anticipation of a reversal.
Investors’ growing interest in WALUSDT reflects rising confidence in the project’s long-term fundamentals and current technical strength. If the breakout confirms with sustained volume, this could mark the start of a fresh bullish leg. Traders might find this a valuable setup for medium-term gains, especially as the wedge pattern completes and buying momentum accelerates.
✅ Show your support by hitting the like button and
✅ Leaving a comment below! (What is You opinion about this Coin)
Your feedback and engagement keep me inspired to share more insightful market analysis with you!
In-depth trading ideas
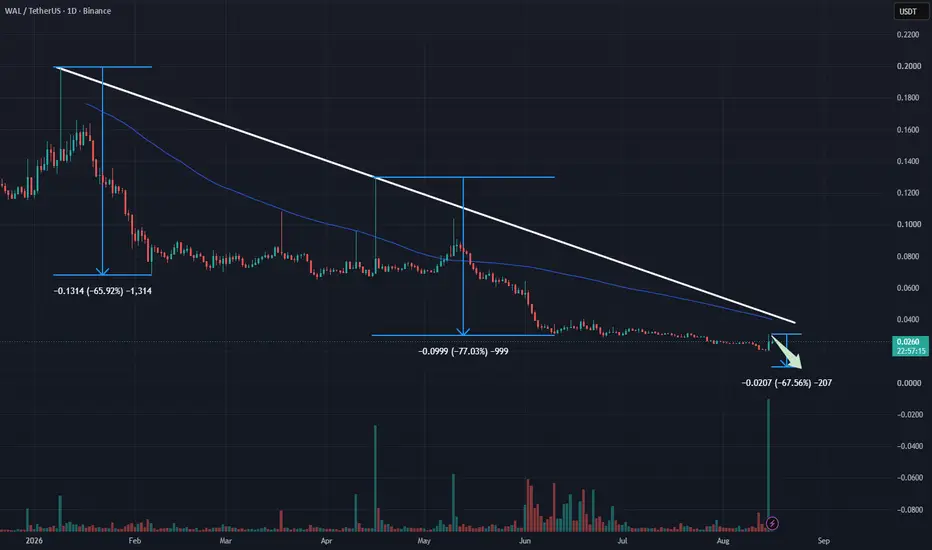
WAL: Long-Wick Rejection Below Structural Resistance WAL: Long-Wick Rejection Below Structural Resistance – Prime Short Setup Aligning with Historic Downtrends
WAL has flashed a decisive trend rejection signal as yesterday’s aggressive price surge was abruptly shut down by heavy overhead supply, leaving a prominent upper wick on the daily candle. Reviewing historical price behavior, two previous instances featuring similar long-wick rejections triggered severe sell-off waves, propelling price action into steep downward expansions of 65.9% and 77.0% respectively.
Based on the visual data from the daily chart image_e7e3db.jpg, current price candles remain tightly constrained underneath two major resistance barriers: the dynamic MA100 trendline and a primary multi-month descending trendline. The swift failure of this bullish attempt directly beneath these resistance layers proves that buyers are completely exhausted, leaving bears in total command of market direction. The confluence of this rejection candle and the macro downtrend structure heavily elevates the probability of a repeating historical sell-off wave.
This technical framework delivers a compelling trend-following Short execution opportunity. The optimal trading strategy is to initiate Short positions around current market levels, establishing an ultra-tight stop-loss parameter directly above yesterday's high wick to maintain strict risk control. The strategic take-profit target for this expansion wave aims directly at the $0.010 psychological round-number support baseline.
Disclaimer: This is not financial advice, DYOR.
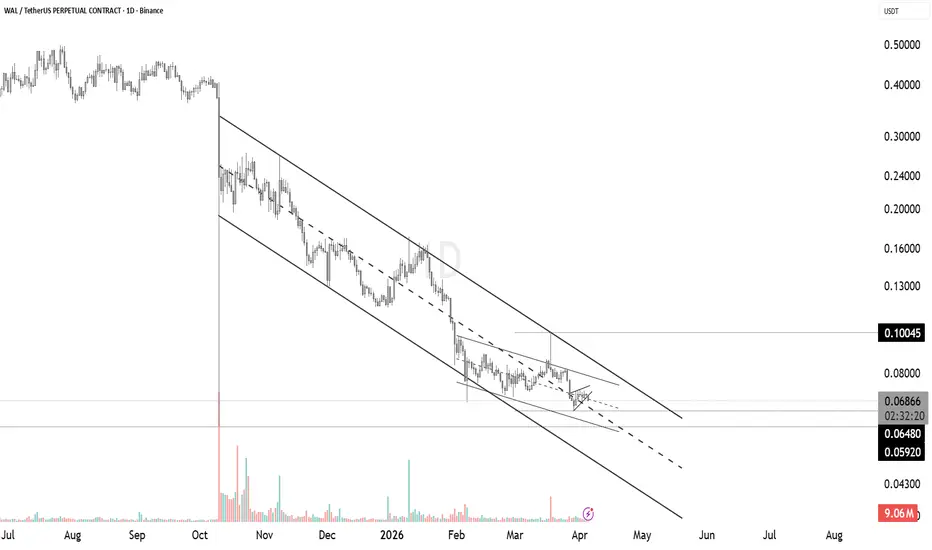
WAL Bearish Compression Near Breakdown – Next Leg LoadingWAL continues to trade inside a strong descending channel, respecting the overall bearish structure with consistent lower highs.
Price is now forming a tight compression/mini consolidation near the lower half of the channel, showing weakening momentum and lack of bullish continuation. Every bounce is getting capped, confirming seller control.
This type of structure often leads to a breakdown. If support gives way, the next leg down could accelerate toward the channel lows.
As long as price stays below the midline and resistance zones, this remains a bearish continuation setup. The move is building, not reversing.
WALUSDT Forming Falling WedgeWALUSDT is forming a clear falling wedge pattern, a classic bullish reversal signal that often indicates an upcoming breakout. The price has been consolidating within a narrowing range, suggesting that selling pressure is weakening while buyers are beginning to regain control. With consistent volume confirming accumulation at lower levels, the setup hints at a potential bullish breakout soon. The projected move could lead to an impressive gain of around 90% to 100% once the price breaks above the wedge resistance.
This falling wedge pattern is typically seen at the end of downtrends or corrective phases, and it represents a potential shift in market sentiment from bearish to bullish. Traders closely watching WALUSDT are noting the strengthening momentum as it nears a breakout zone. The good trading volume adds confidence to this pattern, showing that market participants are positioning early in anticipation of a reversal.
Investors’ growing interest in WALUSDT reflects rising confidence in the project’s long-term fundamentals and current technical strength. If the breakout confirms with sustained volume, this could mark the start of a fresh bullish leg. Traders might find this a valuable setup for medium-term gains, especially as the wedge pattern completes and buying momentum accelerates.
✅ Show your support by hitting the like button and
✅ Leaving a comment below! (What is your opinion about this Coin?)
Your feedback and engagement keep me inspired to share more insightful market analysis with you!
Walrus is forming another structure WAL has dropped to lower levels, leaving behind a favorable imbalance in price action. The structure currently forming could offer a setup with a healthy risk-to-reward ratio. A confirmed Change of Character (CHoCH) would be the ideal signal to start building a position and anticipate a potential trend reversal. Ideally, we’d also want to see the total market cap reflect a similar signal for added confluence.
Both momentum and trend oscillators are showing signs of divergence — now, all that’s needed is a structural shift to confirm follow-through.
WALUSDT Forming Falling WedgeWALUSDT is forming a clear falling wedge pattern, a classic bullish reversal signal that often indicates an upcoming breakout in crypto trading pairs like this one. The price has been consolidating within a narrowing range after recent dips to the multi-year support zone around $0.19-$0.20, suggesting that selling pressure is weakening while buyers are beginning to regain control near key levels like $0.1924. With good volume confirming accumulation at these lower levels amid a 57% surge in 24-hour trading to over $64 million and staking rewards drawing inflows, the setup hints at a potential bullish breakout soon, especially as Walrus's decentralized storage innovations and Sui ecosystem integrations fuel renewed momentum. The projected move could lead to an impressive gain of 190% to 200%+ once the price breaks above the wedge resistance, targeting zones up to $0.57-$0.60 and beyond in this altcoin price action.
This falling wedge pattern is typically seen at the end of downtrends or corrective phases, and it represents a potential shift in market sentiment from bearish to bullish for WALUSDT. Traders closely watching this crypto pair are noting the strengthening momentum as it nears a breakout zone around $0.21-$0.25, with technical indicators like RSI showing oversold bounces and fib retracement levels holding firm on the 4H and daily charts. The good trading volume adds confidence to this pattern, showing that market participants are positioning early in anticipation of a reversal, particularly with recent 11% weekly gains and node committee staking signaling ecosystem growth despite a -10% dip over seven days.
Investors’ growing interest in WALUSDT reflects rising confidence in the project’s long-term fundamentals, including its scalable blob storage for AI data and cross-chain compatibility, alongside current technical strength in this falling wedge setup. As of November 2025, trading activity spikes on Binance and community hype underscore real demand, making this a high-conviction opportunity for those hunting bullish reversal patterns in altcoins. If the breakout confirms with sustained volume, this could mark the start of a fresh bullish leg, with projections eyeing $0.50+ for substantial medium-term gains as buying momentum accelerates in the broader crypto recovery.
✅ Show your support by hitting the like button and ✅ Leaving a comment below! (What is You opinion about this Coin) Your feedback and engagement keep me inspired to share more insightful market analysis with you!
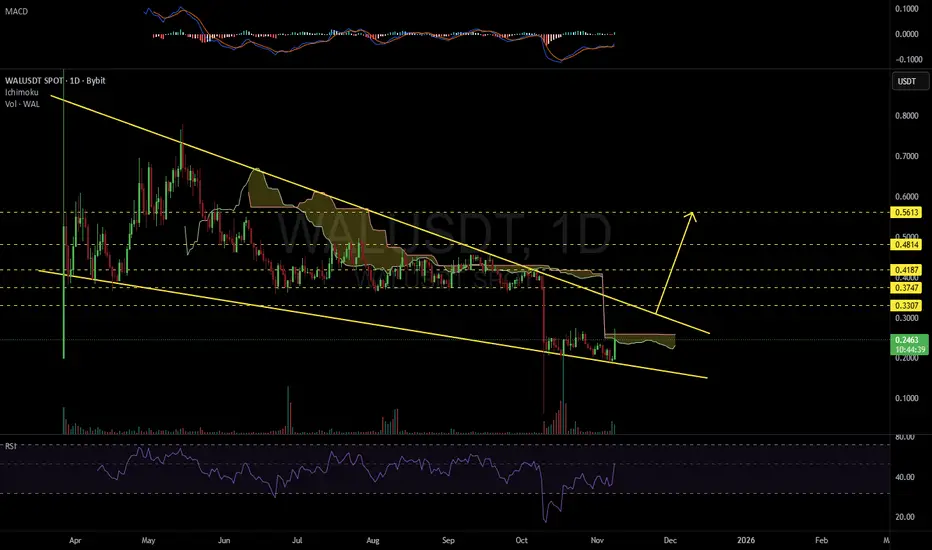
WALUSDT 1D#WAL is currently trading within a falling wedge pattern on the daily chart and has perfectly bounced off the wedge support line. It’s now facing resistance from the Ichimoku cloud, which we believe will be broken soon. In case of a breakout above the wedge resistance, the potential upside targets are:
🎯 $0.3307
🎯 $0.3747
🎯 $0.4187
🎯 $0.4814
🎯 $0.5613
⚠️ Always remember to use a tight stop-loss and maintain proper risk management.
TradeCityPro | WALUSDT Could We See a 50% Move Soon?👋 Welcome to TradeCityPro Channel!
Let’s take a closer look at the WALUSDT chart on the 4-hour timeframe — a setup that might be preparing for a major move.
🌐 Overview of Bitcoin
Before we begin, let me remind you that we’ve moved the Bitcoin analysis section to a separate daily report at your request, so we can go into more detail about Bitcoin’s condition, price action, and dominance:
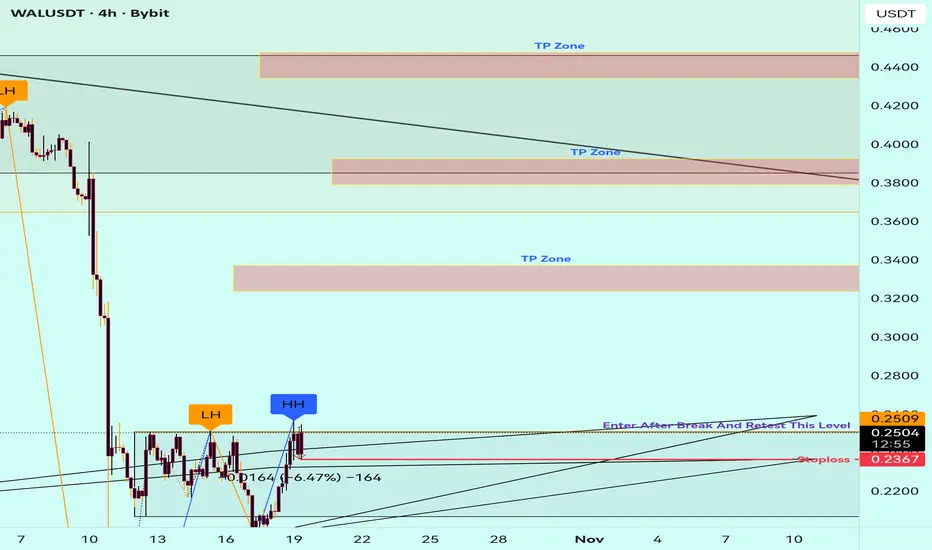
After the sharp breakdown from the 0.3633 level, WAL experienced a strong bearish wave that pushed the price down to a new support zone. Since then, the price has started to accumulate within a clear 4-hour range, suggesting that market participants are waiting for confirmation before the next big move.
This accumulation phase is important because such zones often act as the foundation for explosive movements once price breaks out — either upward or downward.
🔹 Bullish scenario (Long setup):
If price manages to break above 0.2520 with noticeable volume, it could trigger a strong bullish move. This breakout would signal that buyers have regained control, and we could see a rapid move toward higher resistance zones — potentially offering up to 50% upside from the current range. The key here is volume confirmation — without it, the breakout could turn into a fake-out.
🔹 Bearish scenario (Short setup):
On the other hand, the bearish trigger lies at the 0.1993 support. If the price decisively breaks and closes below this level, it would confirm that sellers are in control. However, before opening a short position, we want to see the price retest this zone (a rejection from below) to confirm the breakdown. This would reduce risk and provide a safer entry opportunity.
In summary, WALUSDT is currently in a neutral-to-accumulation zone — the breakout direction will define the next strong move. Traders should stay patient, monitor volume closely, and be ready to act once one of these key levels gives way.
📝 Final Thoughts
Stay calm, trade wisely, and let's capture the market's best opportunities!
This analysis reflects our opinions and is not financial advice.
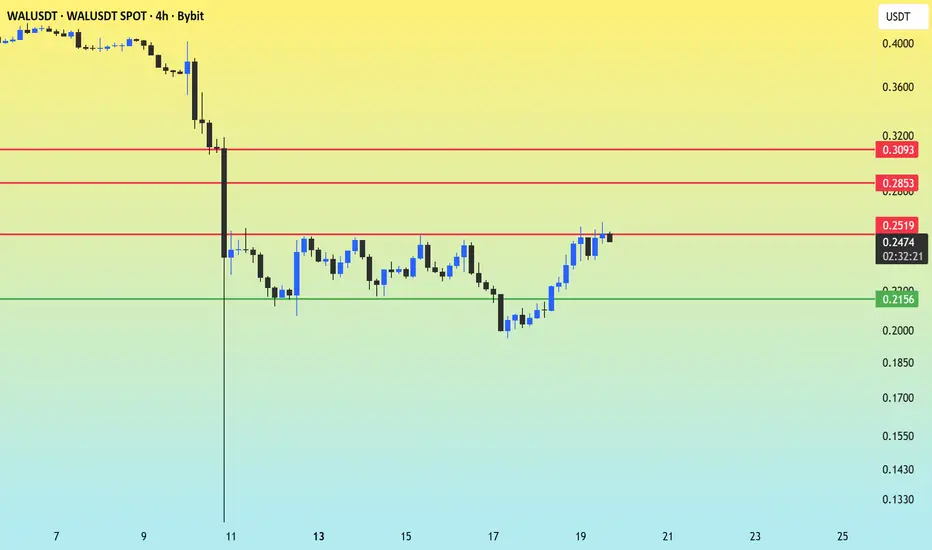
WAL/USDT Primed for a Breakout or Retest?The 4-hour chart for WAL/USDT reveals that the asset has experienced significant volatility, characterized by a sharp decline followed by an extended period of consolidation. The price is currently testing a crucial resistance level, suggesting a potential breakout is imminent.
Major Support (The Floor): $0.2158 (Green Line). This level has held firm repeatedly, acting as a reliable floor and a probable "demand zone." A breakdown below this point would confirm bearish momentum and likely initiate a further decline.
Immediate Resistance (The Barrier): $0.2524 (Lower Red Line). This is the most crucial level right now.
Primary Targets (Upper Resistance): $0.2800 (Middle Red Line) and $0.3024 (Upper Red Line). These levels will act as the next key price targets if the $0.2524 resistance is overcome
WAL – Technical Outlook: Key Levels, Market StructureWestern Alliance Bancorporation (WAL) is a regional U.S. bank listed on the NYSE, known for serving commercial and real estate clients across the western states. The company’s fundamentals show stable earnings and moderate growth, though the stock remains sensitive to interest rate policy and financial sector sentiment.
In this analysis, we review technical structure, price action, and potential breakout/reversal zones using multi-timeframe confluence, RSI momentum, and volume flow. The chart highlights areas of interest for both short-term and swing perspectives.
📊 Key Focus: Support–Resistance Dynamics, Trend Confirmation, RSI Divergence, and Volume Reaction Zones.
⚠️ Disclaimer: This content is for educational purposes only and does not constitute financial advice. Always perform your own due diligence before making investment decisions.
#WAL #WesternAllianceBancorporation #Stocks #TechnicalAnalysis #TradingView #SwingTrading #MarketStructure #PriceAction #VolumeAnalysis #RSI #Breakout #Finance #Investing
WALRUS/USDT – Descending Triangle at Critical Support!WALRUS/USDT is currently trading within a descending triangle pattern on the daily timeframe. This structure is formed by a series of lower highs pressing from above (descending trendline), while the 0.36–0.40 support zone (yellow box) acts as a major floor below.
This highlights strong selling pressure from the top, but at the same time buyers are still holding the support area. The price is now consolidating within a narrowing range, waiting for a decisive breakout that will dictate the next big move.
---
Bullish Scenario (Upside Breakout)
If WALRUS can break above the descending trendline with a daily close above 0.422–0.452, this descending triangle may flip into a bullish reversal. That would signal buyers regaining control.
Bullish Targets:
Target 1: 0.485
Target 2: 0.539
Target 3: 0.633 – 0.729 (if momentum continues strongly)
Validation: breakout with high volume + successful retest of breakout level as support.
---
Bearish Scenario (Downside Breakdown)
If WALRUS closes daily below 0.36, the descending triangle will confirm as a bearish continuation. This shows sellers overwhelming buyers at support.
Bearish Targets:
Target 1: 0.31 – 0.30
Target 2: 0.255 (long-term demand zone)
Validation: strong bearish daily close with volume, without quick recovery above 0.36.
---
Pattern & Interpretation
The descending triangle often acts as a bearish continuation pattern.
But in strong support zones, it can turn into a reversal pattern if an upside breakout occurs.
WALRUS is at a decision point: the tighter the consolidation, the bigger the potential explosive move once a breakout happens.
---
Conclusion
Bias: Neutral → Bearish as long as WALRUS remains below the descending trendline.
Bullish confirmation: daily close above 0.422–0.452 → potential rally to 0.485 – 0.539.
Bearish confirmation: daily close below 0.36 → possible drop to 0.31 and 0.255.
Traders should wait for volume-backed breakout confirmation before positioning. WALRUS is now at a make-or-break level: will it bounce or break?
---
#WALRUS #WALRUSUSDT #CryptoAnalysis #TechnicalAnalysis #DescendingTriangle #Breakout #SupportResistance #PriceAction
WALUSDT — Breakout or Breakdown? Golden Pocket the Key!Quick Context: Since May, price has formed a series of lower highs connected by a descending trendline (yellow). Beneath it lies a strong demand zone at 0.406–0.420, aligning with Fibonacci 0.5 (0.419) and 0.618 (0.407) — the golden pocket. Current price is around 0.435, pressing against the trendline and approaching the apex of the pattern.
Pattern & Key Levels
Main Pattern: Descending Triangle (downward-sloping top, relatively flat base/zone). Theoretically slightly bearish, but since it sits right on the golden pocket with compression, the probability of an impulsive breakout in either direction is high.
Major Demand / Support: 0.406–0.420 (golden pocket + base).
Immediate Resistance: descending trendline + 0.44–0.46 area.
Next resistance targets (yellow dashed lines): 0.484 → 0.542 → 0.674 → 0.732.
Downside supports if broken: 0.380 → 0.350 → 0.296.
Bullish Scenario
1. Confirmation: Daily close above the trendline and ideally > 0.460 (clear breakout confirmation).
2. Healthy Retest: Pullback to 0.44–0.46 / trendline, now acting as support.
3. Step Targets:
T1: 0.484
T2: 0.542
T3: 0.674
T4: 0.732
4. Bullish Invalidation: Daily close back below 0.420; strong invalidation if < 0.406 (loss of golden pocket).
Bearish Scenario
1. Rejection: Fails to break 0.44–0.46 / trendline and turns down.
2. Weakness Confirmation: Daily close below 0.406 (loss of base + golden pocket).
3. Downside Targets:
S1: 0.380
S2: 0.350
S3: 0.296
4. Bearish Invalidation: Daily close above 0.460 with a successful retest flips bias to bullish.
Execution Notes
Apex Break: The closer price gets to the apex, the higher the risk of false breaks — always wait for a daily close to confirm.
Volume: A valid breakout should be accompanied by increasing volume.
Risk Management: Place stops beyond the invalidation zones of your chosen scenario (below 0.406 for breakout longs; above 0.460 for rejection shorts).
> Summary: WALUSDT is being squeezed between the descending trendline and golden pocket 0.406–0.420. A daily close above 0.460 could open the path to 0.484/0.542, while a breakdown below 0.406 may trigger a drop towards 0.380–0.350.
Not financial advice; purely for educational and technical reference.
#WALUSDT #Walrus #CryptoTA #PriceAction #DescendingTriangle #Fibonacci #SupportResistance #Breakout #RiskManagement
WAL/USDT – Major Breakout Unfolding! 70% Upside Potential?After weeks of compressed price action and relentless seller pressure, WAL is showing signs of a potential explosive move. Is this the breakout bulls have been waiting for?
🧩 Chart Pattern: Descending Triangle — With a Bullish Twist
Over the past 3 months, WAL has formed a descending triangle, typically known as a bearish continuation pattern.
But here’s the twist — WAL is breaking out upwards, signaling potential trend reversal instead.
The pattern shows higher lows meeting a horizontal resistance around $0.47–$0.48, a classic sign that buyers are gaining strength.
This setup suggests buyers are slowly overpowering the selling pressure, leading to a high-probability breakout scenario.
🟡 Strong Accumulation Zone: $0.42–$0.45
This range has consistently acted as a strong support base since mid-April.
Every dip into this zone has been met with strong buyback and increasing volume.
It likely represents a smart money accumulation zone before a larger markup phase.
🚀 Breakout Target: Where Could Price Go?
Measured move from the triangle's height projects a move of ~$0.25. From the breakout level at ~$0.48, this gives a technical target around $0.73.
🎯 Bullish Price Targets:
1. TP1: $0.543 — First breakout validation zone
2. TP2: $0.650 — Previous May resistance level
3. TP3: $0.731 — Measured move target from triangle
4. Extended Target: $0.967 – $0.977 — Prior liquidity and local high zone
With sustained volume, $1.00+ isn’t off the table.
---
🔻 Bearish Scenario:
If this breakout turns into a fakeout:
Price may revisit the support zone at $0.45–$0.42.
Breakdown below this zone opens risk toward:
🧨 $0.36 — Mid-range demand zone
Further breakdown could lead to $0.30–$0.28
Confirmation of a fakeout: A strong 12H close below the yellow box support with increasing sell volume.
🔍 Additional Bullish Confirmation Signals:
Volume should spike significantly above average to validate breakout.
RSI, MACD, or EMA crossover can help strengthen the bullish thesis if aligned.
✅ Summary
WAL/USDT is currently at a pivotal breakout moment. A confirmed move above the descending triangle could trigger a major trend reversal, with targets between $0.65 and $0.73 in sight. This setup could be one of the cleanest breakout opportunities on the charts right now.
#WALUSDT #CryptoBreakout #TechnicalAnalysis #BullishSetup #DescendingTriangle #AltcoinWatch
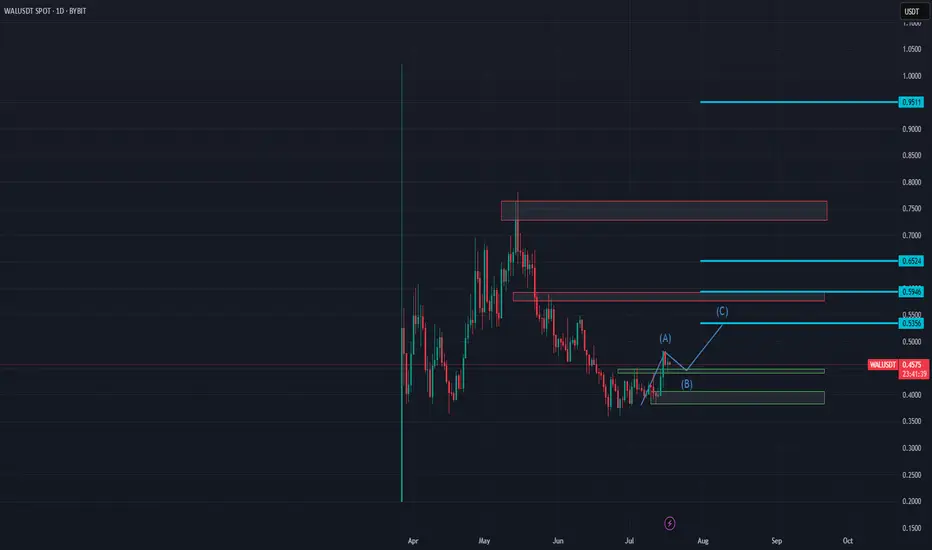
WALRUS 📈 WAL/USDT Mid-Term Outlook
Structure suggests a possible ABC corrective wave in progress.
▫️ (A) formed after bounce from key demand zone
▫️ (B) pullback is ongoing
▫️ (C) wave might target:
• $0.535
• $0.594
• $0.652
• Max extension: $0.95+
Invalidation / SL:
Break below $0.435 (daily close) would invalidate this scenario.
This is a mid-term outlook (2–6 weeks), assuming bullish momentum is sustained.
📌This is my personal view,not financial advice.
Always DYOR and manage risk.
NYSE:WAL
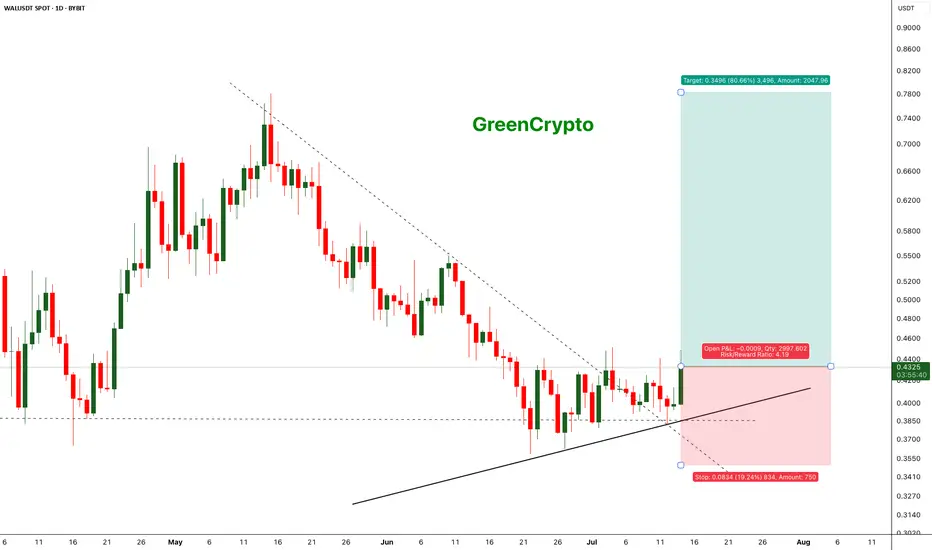
WALUSDT - Change in the trend and let's capture itWAL is currently showing a change in the trend, after a continous downtrend finally we are seeing change in the trend.
Price has held the support strongly and now we are seeing the reversal.
We have decent trade opportunity here.
Entry Price: 0.4319
StopLoss: 0.3500
TP1: 0.4828
TP2: 0.5292
TP3: 0.6374
TP4: 0.7817
Cheers
GreenCrypto
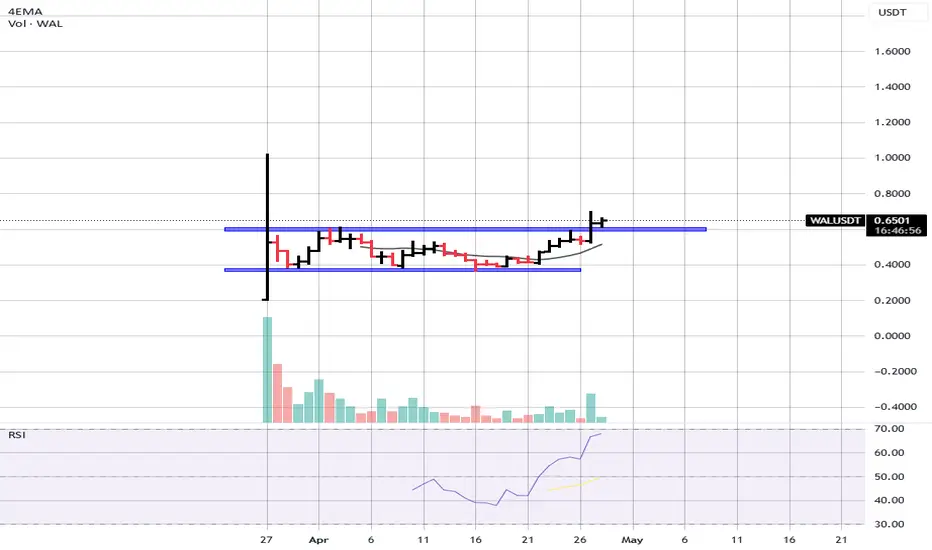
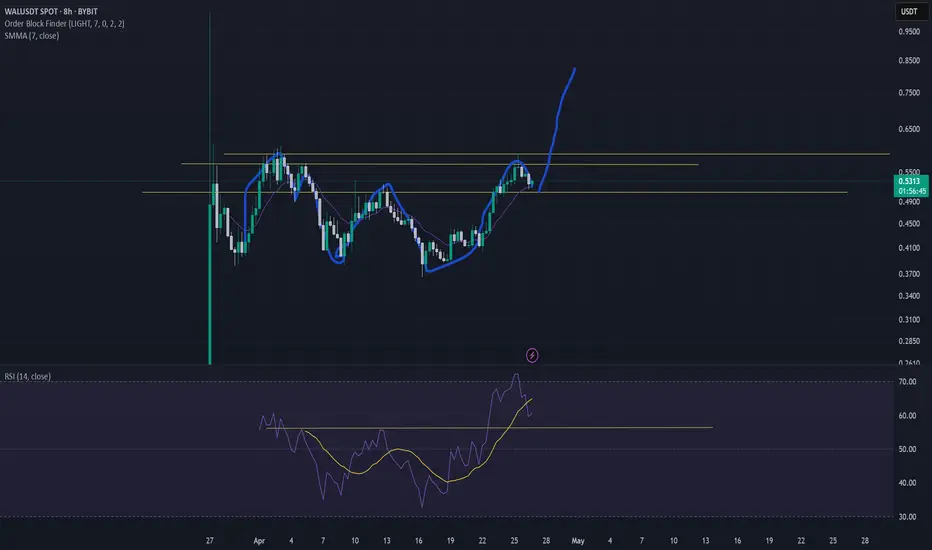
WAL - Walrus amazing out of box pattern!
As we seen a positive and bull steady upward market, many alts are coming up.
Wal is an great example, where we can see a broken box from a 0.6 level!
Volumes are sustain the up trend thus we are following the trend as the price confirm the upward side.
We dont have a target because we can follow the price till a possibile exhaustion pattern.
Let's see how it evolve!
Good trading!
Buy Trade Strategy for WAL: Fueling Web3 Gaming and Engagement
Description:
This trading idea is centered on WAL (Wall Street Memes Token or Wallet Arena Labs, depending on project context), a cryptocurrency designed to empower Web3 gaming ecosystems and decentralized social engagement. WAL integrates reward systems, NFT utilities, and user-driven governance, aiming to provide players and content creators with new avenues for monetization and community involvement. As the demand for blockchain-based games and interactive metaverse platforms grows, WAL positions itself at the intersection of entertainment and decentralized technology, offering potential long-term value through utility, engagement, and partnerships.
Nonetheless, it is important to consider the inherent volatility of the crypto market. External factors such as regulation, investor sentiment, and project execution risks can heavily influence the asset’s price action. As with all digital assets, prudent risk management is essential when engaging with WAL.
Disclaimer:
This trading idea is for educational purposes only and does not constitute financial advice. Investing or trading in cryptocurrencies like WAL involves significant risks, including the potential for total capital loss. Always perform thorough research, understand your financial situation, and consult a licensed financial advisor before making any investment decisions. Past performance is not indicative of future results.
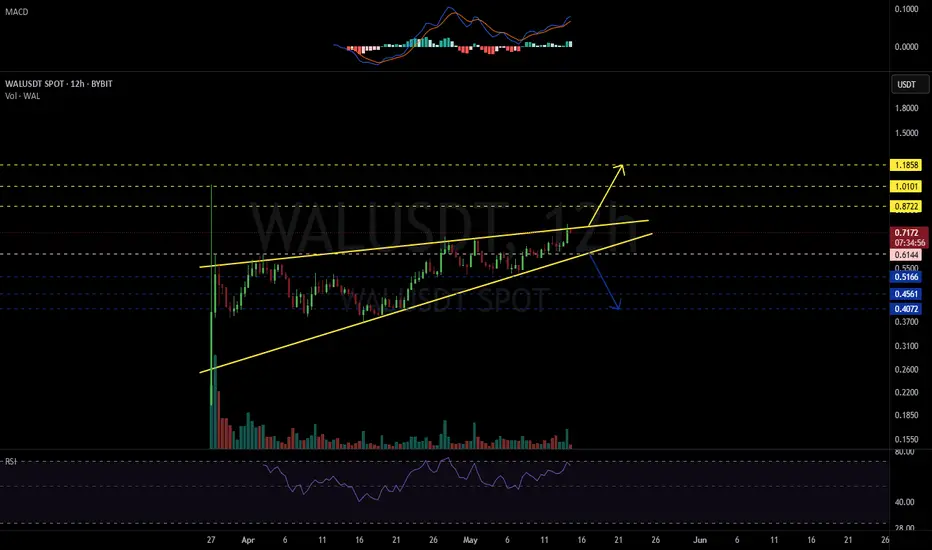
WALUSDT 12H#WAL has formed a rising wedge pattern on the 12H timeframe — typically a bearish setup. However, given the current hype around the token, it could still continue its bullish trend after a correction toward $0.6144.
📈 In case of a breakout above the pattern, the targets are:
🎯 $0.8722
🎯 $1.0101
🎯 $1.1858
📉 In case of a breakdown below the pattern, the downside targets are:
🛡 $0.5166
🛡 $0.4561
🛡 $0.4072
⚠️ Use a tight stop-loss and wait for confirmation of either a breakout or breakdown before entering.
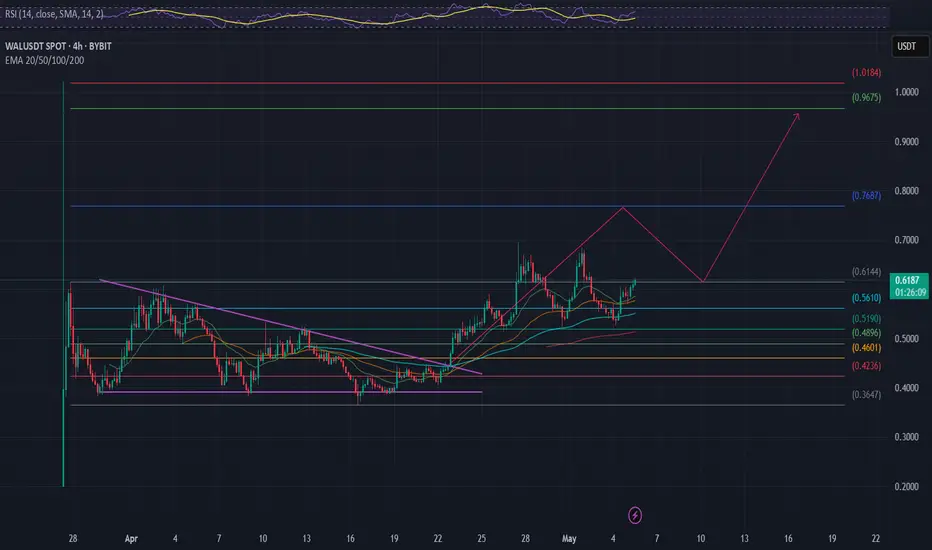
Chat analysis for WAL/USDTCurrent Price: $0.6162
EMA Levels:
EMA 20: 0.5855
EMA 50: 0.5762
EMA 100: 0.5504
EMA 200: 0.5133
➤ Price is currently above all EMAs, indicating short-to-mid-term bullish momentum.
RSI (14): 60.93
RSI is below the overbought zone (70), suggesting room for more upside before a potential pullback.
Key Support & Resistance Levels:
Immediate Resistance: Around $0.70
Next Strong Resistance: $0.90 – $1.00 (psychological level)
Immediate Support: $0.58 – aligns with EMA20/50
Major Support Zone: $0.50 – $0.52 (close to EMA100/200)
Potential Trading Insight (Not Financial Advice):
The price action shows a bullish structure with higher lows.
If it breaks and holds above $0.70, WAL could potentially rally toward $0.90 or higher.
Watch for a rejection at $0.70 — it could lead to a retest of the $0.58–$0.60 zone.
#WALUSDT continues its bearish momentum 📢 As long as the price stays under $0.6000 — short BYBIT:WALUSDT.P bias remains valid.
📢 Watch for further weakness!
📉 SHORT BYBIT:WALUSDT.P from $0.5794
🛡 Stop loss: $0.6000
🕒 Timeframe: 1H
✅ Overview:
➡️ The chart shows a clearly formed and broken Bearish Rectangle, confirming a short setup after price exited the range to the downside.
➡️ The $0.6090 support level has turned into strong resistance.
➡️ Entry at $0.5794 follows a textbook breakdown and retest structure.
➡️ Target area aligns with the volume-based support near POC $0.515, offering solid R:R.
🎯 TP Targets:
💎 TP 1: $0.5725
💎 TP 2: $0.5665
💎 TP 3: $0.5600
📢 Bearish structure confirmed with increased volume.
🚀 BYBIT:WALUSDT.P continues its bearish momentum — downside potential remains active!
Invalidated M pattern and a Tripple Bottom with W pa to finish. Invalidated M pattern and a Tripple Bottom with W pattern to finish.
Looks bullish to me,
144 million raised at 0.40 cents give or take in the bull with sui on a run I would say the likely hood for an impulse breakout of W is high because the price has already reached above the neckline for a 4th break to the downside, I would say the triple bottom is confirmed by ending in a double bottom.
CRYPTOCAP:SUI NYSE:WAL