
 Long
LongIn-depth trading ideas
Long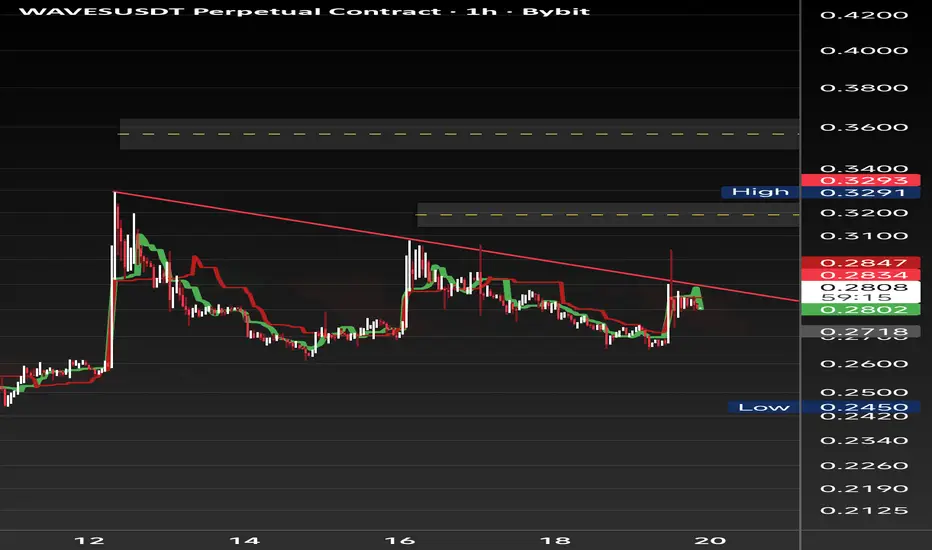
Waves usdt long Roddy01-SIGNALSPROVIDER Instructions:
Entry point: yellow
Stop loss: red
Take profit: green
👉Leverage x 5-10-20 for crypto
👉Leverage x 20-50-100 for commodities, stocks, indices, and forex
👉Margin 1-5% max.
Always practice risk and money management.
Invest a maximum of 5% on any trade or across all your trades.
Invest only what you can afford to lose, as no one is in control of the market.
👉Our analyses are primarily based on:
breakouts: two trend lines (ascending and descending) and a line indicating a horizontal breakout.
chart patterns: shoulders and head, triangle parttern, elliott impulse, etc etc.
We don't always have the time to track them at all times or to represent them visibly, given the numerous signals, the number of channels to manage, and especially because of the often rapid pace of market movements.
indicators: We associate at least two indicators with this technique.
👉Depending on the circumstances, we use specific indicators, often setting 3 or more take profit levels.
👉Indeed, there are good days in trading and also bad days. No one can promise to win every trade, and like all traders worldwide, we also experience stop-loss orders. However, we win more than we lose and remain positive.
👉You can close the position before or after the take profit orders indicated by the green lines if you are personally satisfied; the same applies to stop loss orders.
👉We must stay positive, clear-headed, and humble.
we cannot provide all instructions or all trades here on this channel.
Good luck to us all, and may God guide us. Amen.
Long
wavesusdt short Instructions:
Entry point: yellow
Stop loss: red
Take profit: green
👉Leverage x 5-10-20 for crypto
👉Leverage x 20-50-100 for commodities, stocks, indices, and forex
👉Margin 1-5% max.
Always practice risk and money management.
Invest a maximum of 5% on any trade or across all your trades.
Invest only what you can afford to lose, as no one is in control of the market.
👉Our analyses are primarily based on:
breakouts: two trend lines (ascending and descending) and a line indicating a horizontal breakout.
chart patterns: shoulders and head, triangle parttern, elliott impulse, etc etc.
We don't always have the time to track them at all times or to represent them visibly, given the numerous signals, the number of channels to manage, and especially because of the often rapid pace of market movements.
indicators: We associate at least two indicators with this technique.
👉Depending on the circumstances, we use specific indicators, often setting 3 or more take profit levels.
👉Indeed, there are good days in trading and also bad days. No one can promise to win every trade, and like all traders worldwide, we also experience stop-loss orders. However, we win more than we lose and remain positive.
👉You can close the position before or after the take profit orders indicated by the green lines if you are personally satisfied; the same applies to stop loss orders.
👉We must stay positive, clear-headed, and humble.
we cannot provide all instructions or all trades here on this channel.
Good luck to us all, and may God guide us. Amen.
Short
#WAVESUSDT is currently strongly bullish#WAVES
The price is moving within a descending channel on the hourly timeframe. It has reached the lower boundary and is trending towards a bounce. A retest of this boundary is expected.
The Relative Strength Index (RSI) indicates a downward trend, and this trend is likely to continue due to the overbought condition.
A key support zone (in green) was found at 0.3900, and the price has bounced off this zone several times, making it a strong support level.
The price is trending towards the 100-period moving average, which we are approaching. This trend supports an upward move.
Entry Price: 0.4155
First Target: 0.4200
Second Target: 0.4258
Third Target: 0.4300
You can close at the second target or wait for the third target to be reached. The choice is yours.
Stop Loss: At the resistance zone (in green).
Remember this simple rule: Money Management.
Any questions? Please leave a comment.
Thank you.
Long
#WAVES/USDT is currently strongly bullish#WAVES
The price is moving in a descending channel on the 1-hour timeframe. It has reached the lower boundary and is heading towards breaking above it, with a retest of the upper boundary expected.
We have a downtrend on the RSI indicator, which has reached near the lower boundary, and an upward rebound is expected.
There is a key support zone in green at 0.7335. The price has bounced from this level multiple times and is expected to bounce again.
We have a trend towards consolidation above the 100-period moving average, as we are moving close to it, which supports the upward movement.
Entry price: 0.7416
First target: 0.7560
Second target: 0.7795
Third target: 0.8080
Don't forget a simple principle: money management.
Place your stop-loss order below the support zone in green.
For any questions, please leave a comment.
Thank you.
Long
WAVESUSDT: Trend in daily time framePlease pay special attention to the very accurate trend, and colored levels.
Its a very sensitive setup, please be careful.
BEST,
MT

WLong
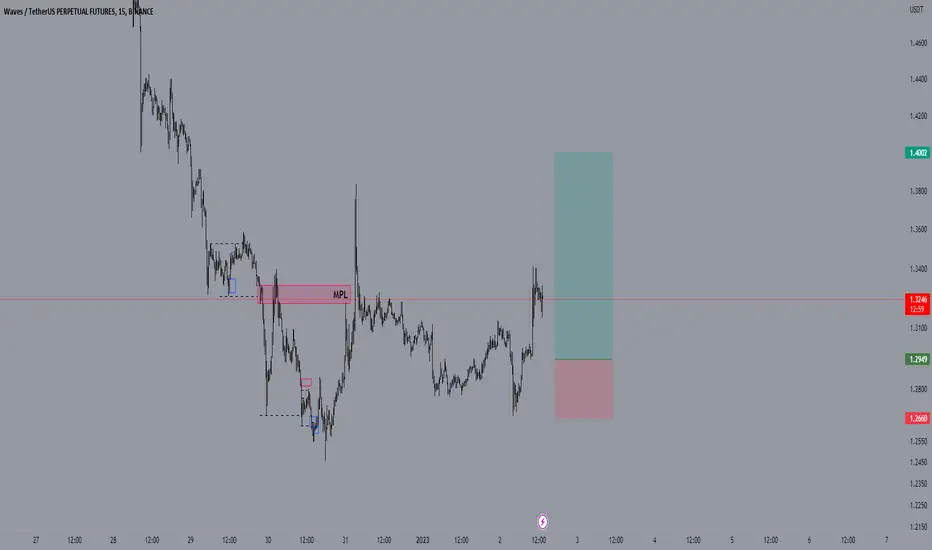
“WAVES Approaching Major Resistance – Possible Bullish Move”WAVES is currently trading inside a symmetrical triangle pattern. Price is consolidating and approaching the apex, which usually leads to a strong breakout.
Safety Zone: ₹95–100 range, holding support.
1st Breakout Level: Around ₹120–125. If this breaks, price can rally further.
Main Breakout (Bullish Momentum): ₹160+. Above this level, a strong uptrend can start.

WAVES/USDT BREAK 3.0There is good chance for wave break and focus goes there to check it in the coming time frames.
Long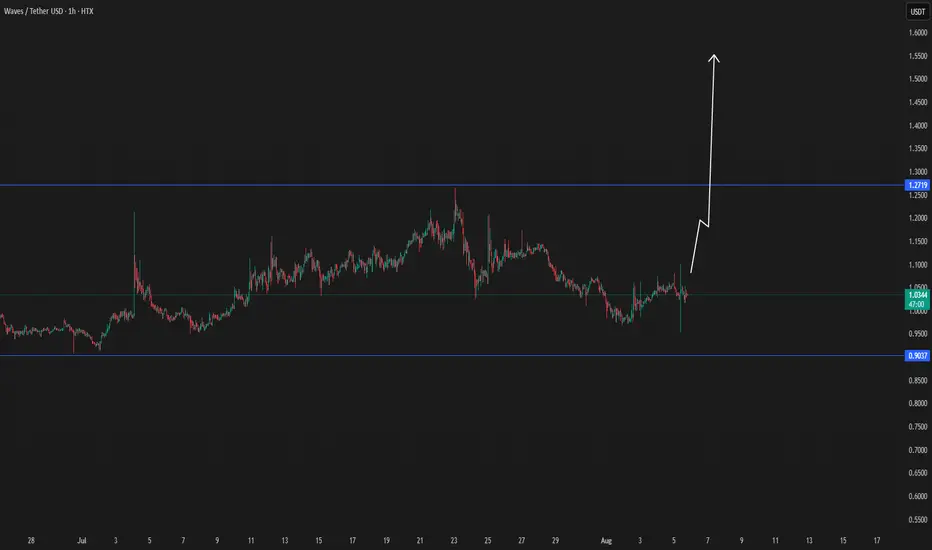
WAVES ON WAY TO $2waves have a high chance to enter a new break to 2 usd, since the last data.
When there is more confirmation, the updates will be below.
Long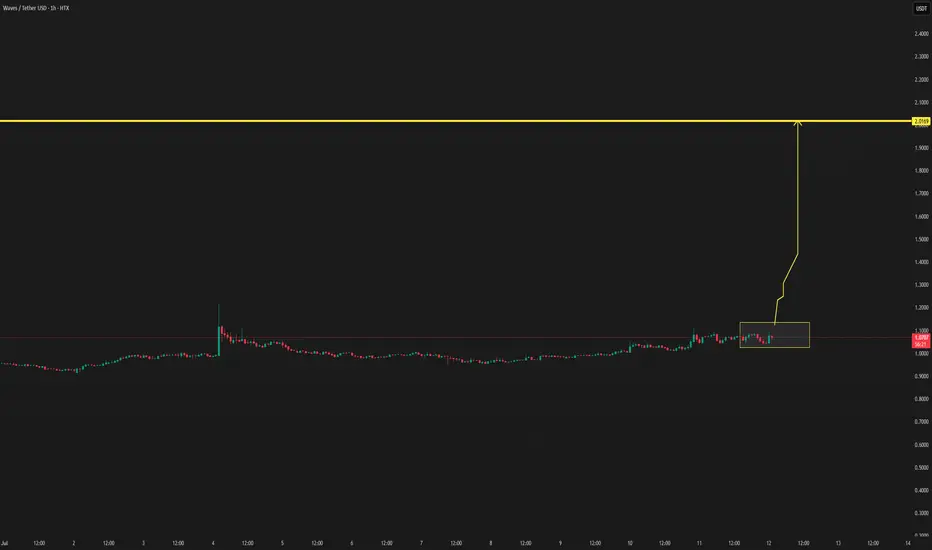
WAVESUSDT - Upward Target LevelsListed a few bull targets once this breakout of the falling wedge pattern occurs
Hopefully these levels are reached and the previous ATH is eclipsed
Falling wedge is a bullish pattern, lets see where it goes
Weekly chart

WAVES Falling WedgeA falling wedge pattern during the bear market
This is a bullish pattern suggesting a breakout once completed
Very cheap right now for WAVES
Chart pattern analyses on this Daily timeframe

Long Entry on WAVESUSDT with PSAR Stop LossBased on the daily chart for WAVESUSDT on Bybit, we've identified a bullish setup for a long entry:
Indicators Used:
MLR (Moving Regression Line) in blue
SMA (Simple Moving Average) in pink
BB Center Line (Bollinger Bands Center Line) in orange
PSAR (Parabolic SAR) in black dots
200-period SMA in red
Entry Conditions Met:
The MLR is above the SMA, indicating a short-term bullish trend.
The MLR is above the BB Center Line, further confirming bullish momentum.
The PSAR dots are under the price, signaling a bullish trend.
The price is above the 200-period SMA, supporting a long-term bullish trend.
Entry Strategy: Enter a long position on WAVESUSDT given these bullish signals.
Stop Loss (SL): Set the stop loss at the current level of the PSAR dots. This ensures that if the price reverses and hits the PSAR level, your position will be closed to minimize losses.
Risk Management: Adjust your position size according to your risk tolerance.
Monitor My Idea: Keep monitoring my idea for any changes in trend or for potential profit-taking opportunities.
Thank you !
Long
wave ready to up1. break out daily trend and complete pullback.
2. daily vol increase.
tp1 = 2.45
tp2 = 3.5
Long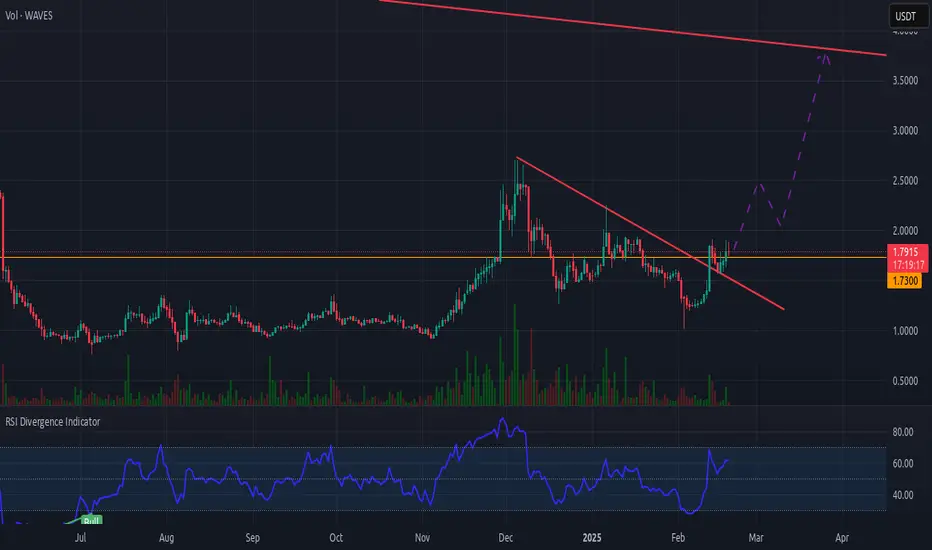

WAVESUSDTI'll wait for this currency to reach the buy zone and buy it... Target and stop are clearly shown in the image.
Good luck
KUCOIN:WAVESUSDT
Long
Waves Looking Ready To Move (66%, 273% & 484% Short-Term)We already have a long-term chart for Waves, but it came to mind recently so here it is again. Why it came to my mind or how, I don't know... So, let's focus on the chart.
Here we can notice a recent bullish breakout above several moving averages. The orange one stands for EMA233, this is a long one. The blue one is EMA89. That's it. Trading above these moving averages confirms the market changed from bearish to bullish. When the action was happening below, it was bearish.
The low for WAVESUSDT happened in July. The marketwide crash in August produced a higher low for this pair. This is a signal of strength. We know it can start to move soon and "early," compared to hundreds of pairs that will move later on. This is because the bottom hit in July. This is just speculation of course but we can see high purchase volume and bullish action on the chart. This is not speculation this is plain to see. And this is all we need.
We have a bullish bias and we have the chart signals coupled with price action to support and confirm this bullish bias. Win. So we have all we need to say that prices are going up. Do you agree?
Well, this is a short-term move that I am mapping for you as we already have a long-term chart for this pair. We have targets starting with 66% which can surely come easy and fast. Next, higher, we have 273% and this will be the main target. But higher is possible because we have a bull-market coming and long-term growth. This last target stands for 484%.
It is hard to look at a short-term chart, we miss the bigger picture but who wants a bigger picture when you can earn 400%? In truth, how high it goes it not that relevant, what is important is the early entry before the marketwide advance. It is good to be early before a rise shows up. When it starts rising, you can decide to sell portions, to sell all or to hold. You can even choose to buy more on the way up... There are many ways to approach the market, there are countless ways to trade.
How you do it is up to you; I give you the chart, the timing, the numbers, the entry.... You can take care of the rest.
I am wishing you the best.
You are appreciated.
Your support is appreciated.
Thank you for reading.
Namaste.
Long
waves waves usdt daily analyses
time frame daily
risk rewards ratio >1.5
waves price raised good but it heated to a weak resistance (red box on the range 2.5 $ ) and it fell down corrected 20% and started to pump again . my first target is shown in the chart 3.24 $. we see in the chart strong resistance ( red box on the range 3-3.5$) and I think here will be good for my first target
Long
The Blue Box: A Demand Zone with PotentialWAVES is approaching a critical demand zone, marked as the blue box on the chart. This zone has the potential to act as a robust entry point for a long position, offering an attractive risk-to-reward setup. Let’s dive deeper into why this level matters and how you can navigate it effectively.
Why the Blue Box Stands Out:
Historical Price Reactions: In past sessions, this zone has consistently attracted strong buying interest, resulting in price reversals and rallies.
Volume Profile Support: The blue box coincides with areas of high trading activity, indicating that many participants view this level as a fair value for accumulation.
Fibonacci Confluence: The demand zone may align with key Fibonacci retracement levels, enhancing its credibility as a high-probability bounce area.
Market Structure: This zone resides within a broader uptrend, making it a potential continuation point for bullish momentum.
How to Approach This Setup:
Entry Strategy: If price enters the blue box, watch for bullish confirmation signals such as engulfing candles, hammer patterns, or a volume spike to validate the strength of buyers.
Risk Management: Place stop-loss orders slightly below the zone to account for potential false breakdowns while managing risk effectively.
Profit Targeting: Look for the next resistance level or Fibonacci extension as potential take-profit zones, ensuring a favorable risk-to-reward ratio.
Key Indicators to Monitor:
Volume: An uptick in volume near the blue box signals buyer commitment.
Momentum Indicators: Tools like RSI or MACD can help identify whether the market is oversold and ready for a reversal.
The blue box presents an opportunity for those who favor precision trading and disciplined risk management. WAVES could be gearing up for a significant move—don’t miss the chance to catch the wave! 🌊
When it comes to trading, I’m all about confidence backed by experience. I’m not claiming to be the best (yet), but my results do most of the talking. Keep an eye on these levels—sometimes the charts quietly suggest what the markets will shout later. Let’s see how this ride unfolds together! 🚀
My Previous Hits
🐶 DOGEUSDT.P | 4 Reward for 1 Risk (or more if you’re bold).
DOGEUSDT.P: Next Move
🎨 RENDERUSDT.P | HTF Sniper Precision
RENDERUSDT.P: Opportunity of the Month
💎 ETHUSDT.P | Buyer Zone So Accurate You’ll Double Check
ETHUSDT.P: Where to Retrace
🟢 BNBUSDT.P | Buyer Zone Mastery (CZ vibes).
BNBUSDT.P: Potential Surge
📊 Bitcoin Dominance | Called it Like a Pro
BTC Dominance: Reaction Zone
Now sit back, relax, and watch the market do its thing. Or don’t, FOMO is real. 😉
Long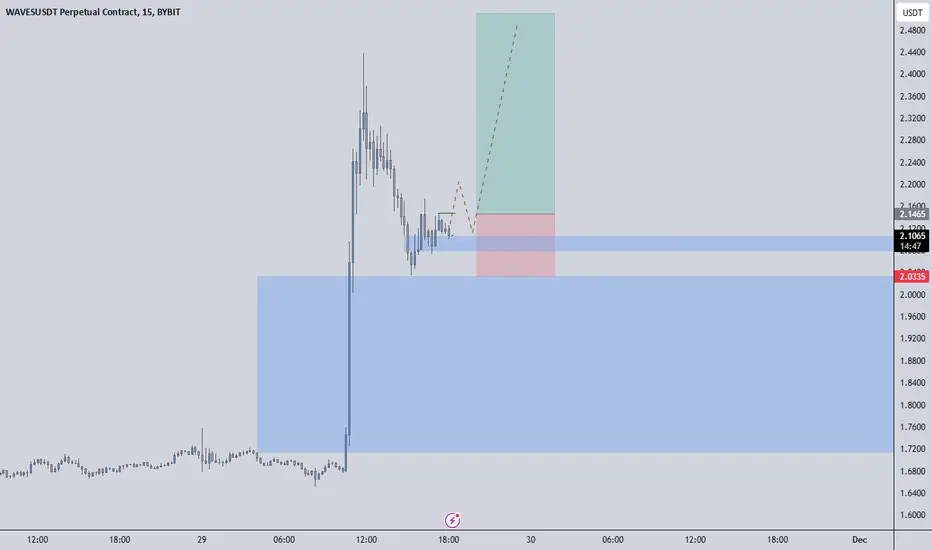
WAVES: Massive 530% Gain at 10x LeverageTrade Overview:
WAVES surged to remarkable highs on the 4-hour timeframe. Utilizing the Risological Swing Trader , this long trade setup captured an extraordinary 530% gain at 10x leverage.
Key Levels:
Entry Price: $0.9990
Stop Loss (SL): $0.9565
Take Profit Targets:
TP1: $1.0520 ✅
TP2: $1.1375 ✅
TP3: $1.2230 ✅
TP4: $1.2755 ✅
WAVES/USDT Analysis:
The Risological Green Lines accurately depicted strong bullish momentum, allowing traders to trail the uptrend confidently. WAVES not only met all targets but exceeded expectations, reflecting robust market dynamics.
Outlook:
With such significant momentum, traders may keep monitoring WAVES for potential continuation patterns or retracements. This trade showcases the reliability of the Risological system for spotting high-profit opportunities.
Long
$WAVES/USDT Trading IdeaWAVES/USDT is showing potential between the 1D and 1W timeframes, looking like it's gearing up for a rise. On the 1D, it’s formed an ascending triangle pattern, which could lead to a retest of the $1.3290, $1.6450, and potentially the $2 supply zone.
Keep an eye on this setup and play safe because the market sentiments are bearish.
Long Short
Short
WAVES / USD Long Trade Setup All Targets Done! On Risological.WAVES / USD Long Trade Setup All Targets Done! On Risological.
Another clean trade.
Entry: $1.029
Stoploss: $1.007
Targets: TP1, TP2, TP3, and TP4 DONE!
Cha Ching!
Long