WAX/USDT – Accumulation Below Trendline or Further Downside?The WAX/USDT chart shows a strong downtrend over the past few months, marked by a consistent descending trendline resistance pressing the price lower.
Currently, price is moving sideways below the trendline, indicating a phase of accumulation or consolidation before the next major move.
---
📐 Pattern Structure: Descending Triangle / Falling Resistance
Descending trendline → dynamic resistance (seller dominance)
Horizontal support around 0.0058 – 0.0066
This structure forms a Descending Triangle (bearish continuation), however:
If an upside breakout occurs → it could signal an early reversal
👉 Meaning: This is a critical decision zone
---
📍 Key Levels:
Strong Support: 0.0058
Consolidation Area: 0.0064 – 0.0070
Resistance Levels:
0.0075
0.0082
0.0091
---
🚀 Bullish Scenario
If price manages to:
✅ Break and close above the descending trendline
✅ Reclaim the 0.0070 – 0.0075 area
Then potential targets are:
Target 1: 0.0075
Target 2: 0.0082
Target 3: 0.0091
📈 This would indicate:
A shift in market structure
The beginning of a trend reversal or bullish continuation
---
🐻 Bearish Scenario
If price fails to break out and:
❌ Gets rejected at the trendline
❌ Breaks below 0.0064 – 0.0058 support
Then the likely outcome:
Retest of 0.0058 low
Potential continuation to a new lower low
📉 This confirms:
A valid descending triangle (bearish continuation)
Continued seller dominance
---
⚖️ Conclusion
WAX is currently in a price compression (squeeze) phase between support and descending resistance.
👉 The breakout from this structure will determine the next major direction:
Break up → bullish reversal
Break down → continuation of bearish trend
---
📌 Additional Insight
Volume will be key to confirming the breakout
False breakouts are possible → wait for candle close & retest
#WAXUSDT #CryptoAnalysis #TechnicalAnalysis #TradingView #Altcoin #BreakoutSetup #DescendingTriangle #BullishScenario #BearishScenario #CryptoTrading #SupportResistance #TrendlineAnalysis
In-depth trading ideas
WAXPUSDT: Longs LiquidatingWAX on Bitget is flashing a dangerous contradiction. Spot at 0.00759 with futures at 0.00751 — a -1% backwardation with Z at -2.4, Yield at -1096% APY 2.4σ Bull. That funding rate is statistically extreme, mathematically punishing shorts at an annualized rate that sounds bullish on the surface. But S/F Vol at 172.65M spot versus 5.48B futures, S/F S at 1.31M versus 41.63M — Spot:Fut reads Normal, yet the futures-to-spot volume skew remains heavily synthetic. The critical contradiction is this: the squeeze has fired with Bull↑ momentum, yet Longs Liq is active. Longs are being liquidated into a nominally bullish squeeze resolution — that is forced selling disguised as a bull move.
Signal count is 22 green to 32 red out of 112 — 50.7% bearish, Flat BEAR at 1.49% edge at just 1.03x. This is the weakest bear classification in the suite, essentially a coin flip. C>T 3:11 is a near-complete bearish trend-price misalignment. EMA stack 5:1 is the strongest bull signal in the panel. Candle 5:9 net bearish. Ichi TK 5:7 slightly bear dominant. SS/DD 1:10 is a heavily bearish structural backdrop — 10 bearish structure signals versus 1 bullish, the most one-sided structural reading of this session. Spread at 1.5% Flat confirms extremely narrow indecisive candle bodies despite the squeeze firing. Squeeze FIRED with Mom Bull↑ and BW 30.55% Expanding — the breakout has triggered, bands are opening, but the structural context behind it is overwhelmingly bearish.
Spot Z 0.71 Active, Fut Z 2.26 Spike, F+S Z 2.18 Spike. Futures volume is spiking while spot remains merely active — a futures-led move with spot participation lagging. SpotZ 1:5 reads 0.71 vs 0.03 with 0.68 Accel ▼▼ — the downward acceleration arrows signal the spot volume pulse is already fading even as the absolute level remains positive. Bull:Bear Z -0.12 vs 13.91 Bear Dom — this is the most important number in the panel. Bear volume dominance at 13.91 against a neutral bull reading is an extreme statistical imbalance. Bears are controlling the volume flow decisively while price shows a nominal bull squeeze resolution. S.Mom 822.9% Exp↑ Blowoff — spot momentum is in full blowoff expansion, historically an exhaustion signal rather than a continuation signal. MeanZ at -1.15σ Fall confirms price is below mean and declining structurally.
Leverage at 31.45x V.High, Percentile at 100% Ceiling — this is AT Max, confirmed at 31.45x with 0 bars ago meaning right now is the all-time leverage maximum for this instrument. AT Min was 0.026x at 974 bars ago. Price at 10.2% Floor with Hi/Lo at 0.02091 vs 0.00607. The combination of AT Max leverage at the absolute ceiling simultaneously with price at 10.2% Floor creates the most extreme risk configuration possible — maximum synthetic positioning on an asset at its historical price bottom. StdDev at 0.344% Volat Volat confirms realized volatility is elevated and expanding into this leverage extreme.
OBV Z -2.77 Strong↑ with Spread Divergence flagged — OBV is negative absolute but directionally upward with a divergence warning active. Longs Liq is the liquidation signal — forced long position closures are generating the sell-side volume pressure. This explains the Bear Dom volume Z of 13.91: liquidation waterfalls register as bear volume even when they occur during a nominally upward price move. No whale detected. Sqz Div Normal. Mkt Normal — market quality feed is clean, which means the Bear Dom reading is real data, not a distortion artifact.
The honest read: WAXPUSDT is a liquidation trap wearing a bull costume. The squeeze fired Bull↑ but every underlying signal contradicts the headline — Bear Dom Z at 13.91, Longs Liq active, SS/DD 1:10 structural bear sweep, AT Max leverage at ceiling right now, S.Mom Blowoff, and Accel ▼▼ on spot volume. The -1096% APY funding is extreme enough to create artificial backwardation that mimics bull signals without genuine accumulation behind it. Clarity at 48% and Flat BEAR at 1.03x confirm the market itself is deeply uncertain. The 26.1% Recov bounce is real price movement but it is being driven by liquidation mechanics, not buyer conviction. Until leverage retreats from the all-time ceiling, Bear Dom Z normalizes, and Longs Liq clears — this fired squeeze is a trap, not a trigger.
Is That Crypto Pump Real? Data Says No. Here's Why.
Stop Losing Money to Fake Volume. Find Real Moves Now.
Trade the REAL Crypto Volume. Stop Getting Faked Out.
WShort
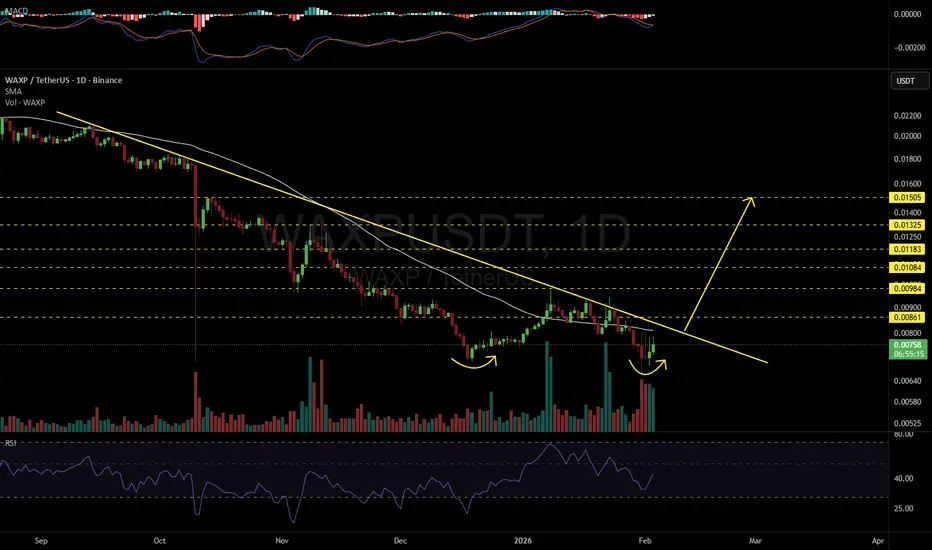
WAXPUSDT 1D#WAXP has formed a double bottom pattern on the daily chart and is now moving toward the descending resistance and the daily SMA50. RSI and MACD indicate potential bullish momentum. Wait for a clean breakout above these levels before entering. If confirmed, the potential upside targets are:
🎯 $0.00861
🎯 $0.00984
🎯 $0.01084
🎯 $0.01183
🎯 $0.01325
🎯 $0.01505
⚠️ Always apply tight stop-losses and maintain strict risk management.
WAXP Buy/Long Signal (4H)WAXP has filled the large previous wick, which is a strong sign of price acceptance. After that, a bullish CH was formed on the chart, confirming a potential shift in momentum. The overall price structure strongly supports long buy positions.
We have two clearly identified liquidity pools on the chart, and once these pools are swept, price has a high probability of reversing to the upside. In addition, price continues to form higher highs and higher lows, which further confirms the bullish market structure.
There are two entry zones marked on the chart, and entries should be executed using a DCA strategy to manage risk effectively. The upside targets have been clearly marked on the chart
If you would like us to analyze a coin or altcoin for you, first like this post, then comment the name of your altcoin below.
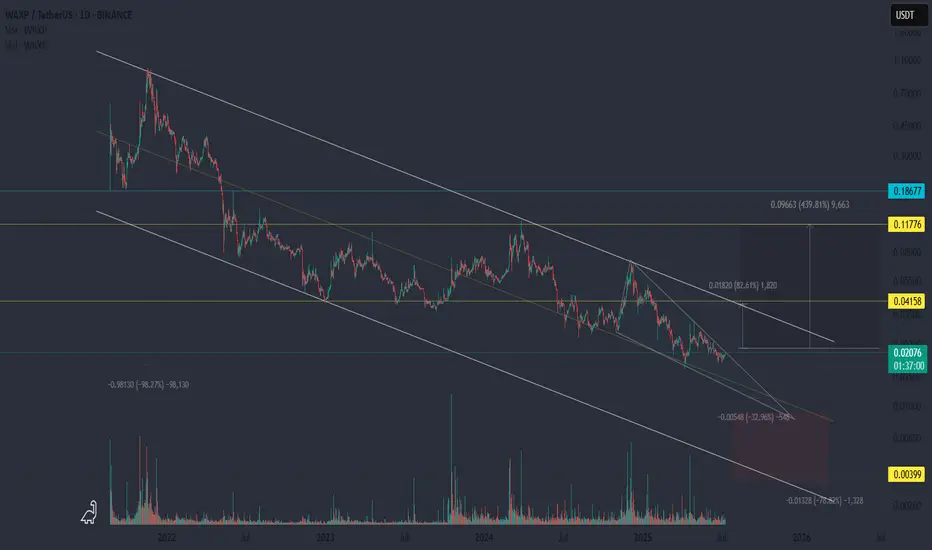
WaxpUSDT Falling Wedge Setup Breakout LoadingWaxpUSDT is currently trading within a falling wedge structure, with price compressing towards the apex. Market structure remains intact, showing decreasing volatility and volume consistent with wedge dynamics. The strategy is to accumulate from the present level while monitoring for a confirmed breakout above the wedge resistance, which would signal bullish continuation. Breakout confirmation should align with increased momentum and volume expansion, targeting the projected price levels as marked on the chart.
WAXP — Classic Accumulation Phase or Another Fakeout?📉 Technical Overview:
WAXP continues to move within a well-defined downward channel, with the price having dropped by roughly 98% from its peak.
Currently, it's forming a falling wedge pattern, and the price is approaching the upper boundary — often a zone of breakout potential.
💡 Key Point:
We’re seeing notable buying volume, which could suggest accumulation by larger players or strategic positioning ahead of a possible reversal.
🎯 If bullish momentum follows, the first key target would be the top of the descending channel.
WAXPUSDT.PI am personally short biasd as per the situation but still i have marked the reversals zone if the market breakout the channel the zones for reversal has been mentioned.
The short positions i will enter after the channel breakdown and retesting with bearish candles in other case i will wait and look for the bearish momentum at reversal zones
DYOR
WAXP LONG SETUP📍 Crypto SIGNAL #📍
COIN: $WAXP/USDT (3-5x)
Direction: LONG 📈
➖➖➖➖➖➖➖
➡️ Entry : 0.04210-0.03755
🔰 Targets
🎯 Short Term :
🎯 Target 1 - 0.04260
🎯 Target 2 - 0.04310
🎯 Target 3 - 0.04350
🎯 Target 4 - 0.04410
🎯 Mid-Term :
🎯 Target 5 - 0.04500
🎯 Target 6 - 0.04700
🎯 Target 7 - 0.05000
🎯 Target 8 - 0.05500
🎯 Long Term :
🎯 Target 9- 0.06500
🎯 Target 10 - 0.07500
❌ Invalid Level : 1D candle below 0.03440
➖➖➖➖➖➖➖
#SRFXTEAM💻
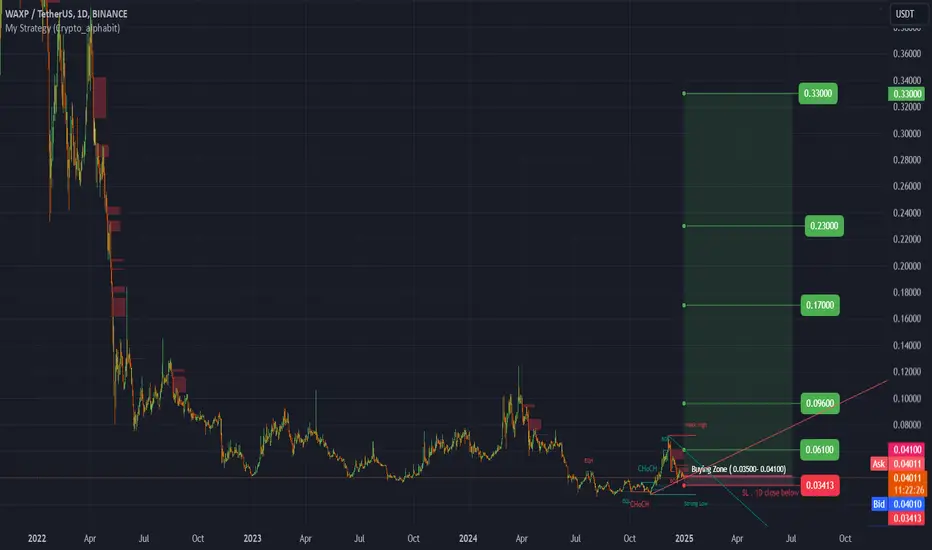
#WAXP (SPOT) entry ( 0.03500- 0.04100)T.(0.33000) SL(0.03413)BINANCE:WAXPUSDT
#WAXP/ USDT
Entry ( 0.03500- 0.04100)
SL 1D close below 0.03413
T1 0.06100
T2 0.09600
T3 0.17000
T4 0.23000
T5 0.33000
______________________________________________________________
Golden Advices.
********************
* collect the coin slowly in the entry range.
* Please calculate your losses before the entry.
* Do not enter any trade you find it not suitable for you.
* No FOMO - No Rush , it is a long journey.
Useful Tags.
****************
My total posts
www.tradingview.com
1Million Journey
www.tradingview.com
www.tradingview.com
**********************************************************************************************
#Manta #OMNI #DYM #AI #IO #XAI #ACE #NFP #RAD #WLD #ORDI #BLUR #SUI #VOXEL #AEVO #VITE #APE #RDNT #FLUX #NMR #VANRY #TRB #HBAR #DGB #XEC #ERN #ALT #IO #ACA #HIVE #ASTR #ARDR #PIXEL #LTO #AERGO #SCRT #ATA #HOOK #FLOW #KSM #HFT #MINA #DATA #SC #JOE #RDNT #IQ #CFX #BICO #CTSI #KMD #FXS #DEGO #FORTH #AST #PORTAL #CYBER #RIF #ENJ #ZIL #APT #GALA #STEEM #ONE #LINK #NTRN #COTI #RENDER #ICX #IMX #ALICE #PYR #PORTAL #GRT #GMT #IDEX #NEAR #ICP #ETH #QTUM #VET #QNT #API3 #BURGER #MOVR #SKL #BAND #ETHFI #SAND #IOTX #T #GTC #PDA #GMX #REZ #DUSK #BNX #SPELL #POWR #JOE #TIA #TFUEL #HOT #AVAX #WAXP
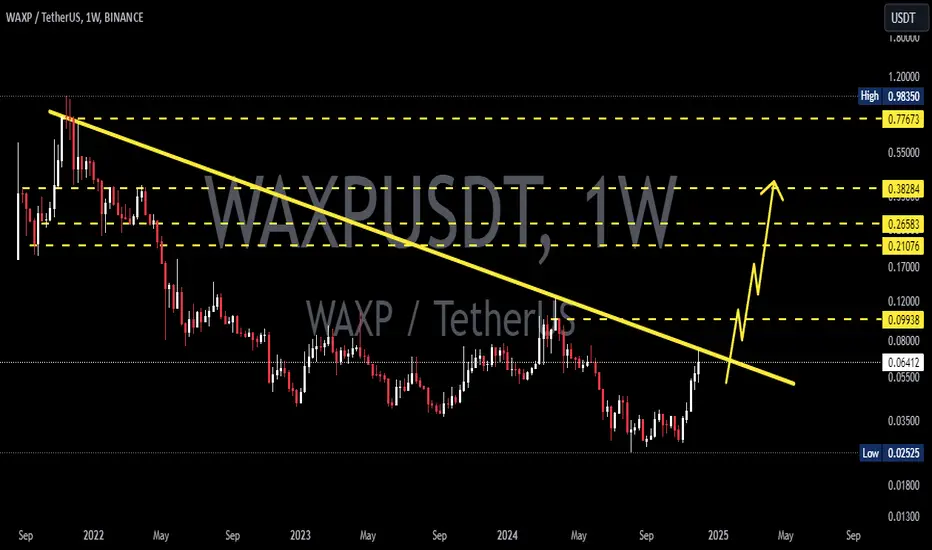
WAX Token 888% Spot Trade-NumbersMy dear friend, some Altcoins will crash together with Bitcoin, others will remain neutral —sideways— while others will grow.
Today I would like to share the full trade-numbers for this chart setup.
This is spot trading with mid- to long-term targets.
___
WAXPUSDT
ENTRY:
1) $0.03200
2) $0.02900
3) $0.02600
4) $0.02400
TARGETS:
TP1: $0.03975
TP2: $0.04842
TP3: $0.06280
TP4: $0.07444
TP5: $0.08610
TP6: $0.10266
TP7: $0.12360
TP8: $0.15555
TP9: $0.18465
TP10: $0.22222
TP11: $0.24825
TP12: $0.28333
STOP: Adjust to your own risk tolerance
___
Technical analysis, you ask?
A new All-Time Low has been hit and today WAXPUSDT remains green while Bitcoin is hitting a new low. This can hint that this is one of the pairs that will detach and grow in the coming weeks.
Remember our strategy, buy and hold focusing on the long-term. If prices drop, buy more because we are in the accumulation phase.
Never place a stop-loss in the exchanges. It is a scam. The best we can do is a manual stop-loss and be careful with those as well. We tend to place stops at support, and reversals tend to happen at support.
Namaste.
Trade Signal for WAXPUSDTDirection: Buy
Enter Price: 0.03041
Take Profit: 0.03083667
Stop Loss: 0.02975667
Analysis:
This trade idea for WAXPUSDT has been generated using the EASY Quantum Ai strategy, which relies on advanced machine learning techniques and data analysis to identify potential market movements. The decision to enter a Buy position is based on several factors observed within the WAXPUSDT market:
1. Trend Reversal Signals: Our strategy has detected preliminary signals of a potential uptrend reversal in the WAXPUSDT pair, given current market conditions and historical data patterns.
2. Momentum Indicators: Key momentum oscillators are showing signs of bullish divergence, supporting the likelihood of an upward price movement.
3. Support Levels: The stop loss has been strategically placed at 0.02975667, just below a critical support level. This allows for minimal downside risk while maximizing profit potential should the trend continue upward.
4. Market Sentiment: Recent market sentiment analysis indicates a favorable outlook among traders, suggesting an influx of purchase interest.
By taking a Buy position at 0.03041, this trade aims to capitalize on these indicators with a target of 0.03083667. Always ensure to review the latest market conditions and adjust risk management settings accordingly.