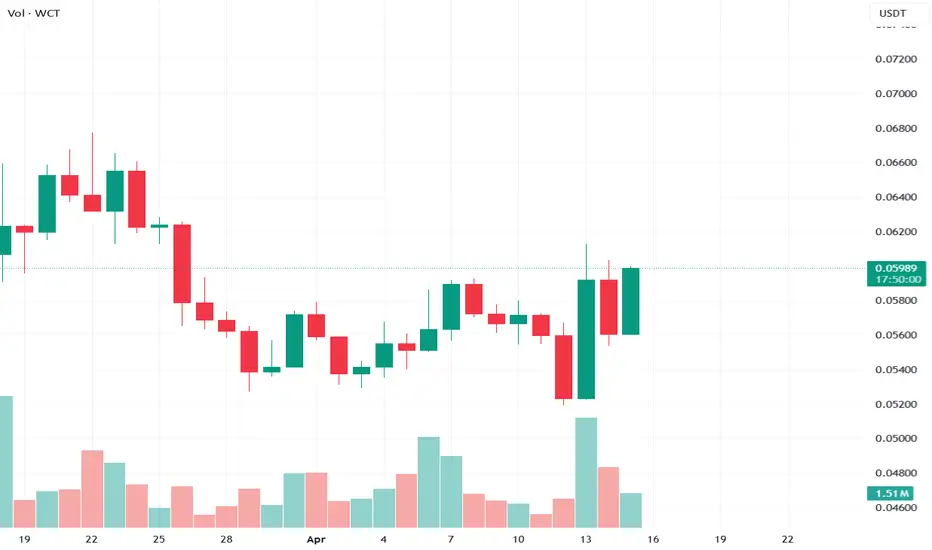
WCT/USDT (4h) Compressing Inside a Symmetrical TriangleWCT/USDT is consolidating inside a symmetrical triangle on the 4H chart, with price moving closer to the apex.
The compression appears relatively strong, but trend strength remains limited. A confirmed breakout above the upper trendline could support a bullish move, while a break below the rising support would favor bearish continuation. Volume confirmation would help validate the direction.
WalletConnect/USDT
No trades
No trades
In-depth trading ideas
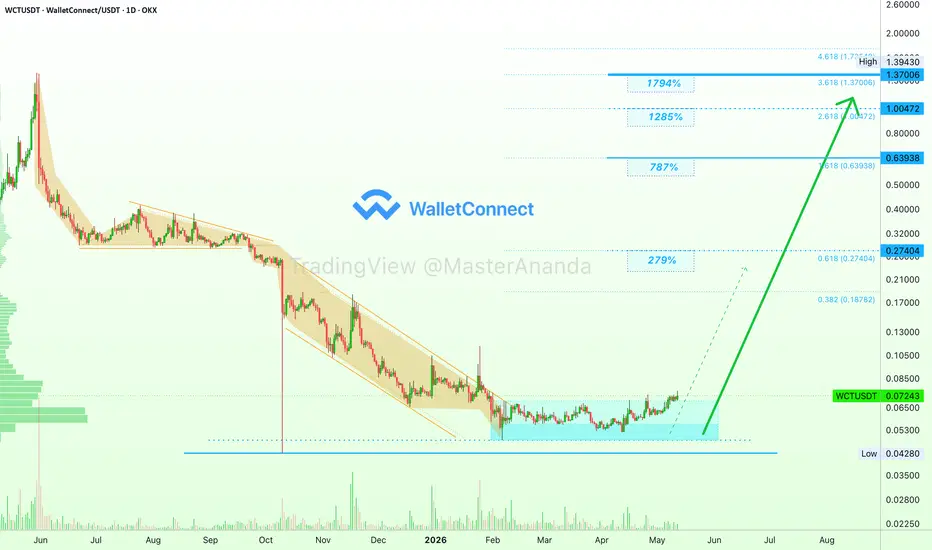
WalletConnect—WCTUSDT 5X LONG with 7,395% profits potentialIt seems a major move is in the making behind the scenes and anything can happen now, truly anything.
As usual, the market is divided. Many people are going to be bullish while many others are going to be short. We are bullish at support after a prolonged period of consolidation. WCT has potential to grow.
See the numbers below—huge profits potential on this chart setup. Hard crash = extraordinary bull market next.
____
LONG WCTUSDT
Leverage: 5X
Potential: 7395%
Allocation: 5%
Entry zone: $0.0390 - $0.0460
Targets:
1) $0.0625
2) $0.0750
3) $0.0957
4) $0.1111
5) $0.1291
6) $0.1530
7) $0.1833
8) $0.2168
9) $0.2375
10) $0.2709
11) $0.3251
12) $0.3636
13) $0.4127
14) $0.5555
15) $0.6962
Stop: Close monthly below $0.0380
_____
WCTUSDT is moving within the extreme opportunity buy-zone, close to its all-time low. There is high volume at support and a triple bullish divergence with the oscillators, MACD, RSI & STOCH.
The market will turn resulting in long-term growth.
Namaste.
WalletConnect—WCTUSDT 3X LONG with 3,717% profits potentialThe altcoins bull market is here. It can take a few more days before it spreads everywhere but it is already here, it is already happening, it already started.
Good afternoon my fellow Cryptocurrency trader, I hope you are having a wonderful day.
WCTUSDT (WalletConnect) is one of those exotic projects, a good project with a great chart and perfect timing for an awesome LONG-trade.
The action is happening at support and today we have a strong bullish breakout with high volume. Nothing more needs to be known.
The chart is 100% bullish and set to rise next. That's all the information we need to take action.
Thank you for reading...
____
LONG WCTUSDT
Leverage: 3X
Potential: 3717%
Allocation: 3%
Entry zone: $0.0415 - $0.0540
Targets:
1) $0.0625
2) $0.0750
3) $0.0957
4) $0.1111
5) $0.1291
6) $0.1530
7) $0.1833
8) $0.2168
9) $0.2375
10) $0.2709
11) $0.3251
12) $0.3636
13) $0.4127
14) $0.5555
15) $0.6962
Stop: Close weekly below $0.0410
_____
Namaste.
WalletConnect (WCT) Higher High & Bullish Continuation WCTUSDT (WalletConnect) hits a new high today, just barely, but higher is higher. Higher is always better than lower.
A higher high and the highest daily price since 29-January, a new milestone. We are seeing slow and steady growth. This type of market behavior always results in a massive bullish jump. We are getting closer with each passing day.
This is just one project but I am seeing the same price dynamic unfolding on hundreds of charts. I am tracking the market daily. After looking at some 60 altcoins recently, all were challenging resistance, moving higher or consolidating. Not one was producing new major lows.
Here we have a bullish continuation, the action now moving above the bottom pattern and accumulation zone. WalletConnect can start moving within days. Based on our marketwide map though, a full bullish wave can take several months to fully unravel. There is still time to buy while prices are low. Expect maximum growth.
This first leg will be similar to what we experienced in late 2023 through Q1 2024. October 2023 through March 2024 to be more exact. We had marketwide bullish action, very strong. The difference between now and then; back in March 2024 many projects entered a bear market until recently. In 2026, we will get additional growth: 2027, 2028 and beyond. Some projects will peak in 2027 and 2028, others will continue growing through 2029 and then... We will have to wait and see, but the bear market is over. There is plenty of time to plan, adapt and prepare.
Thank you for reading.
Namaste.
WalletConnect (WCT) · Bottom Consolidation Continues (1500% PP)The market looks great. The best conditions are present since April 2025. What follows will be awesome.
Think back to April 2025 or August 2024. What was the sentiment back then? What about the charts?
Were the charts all hyper-bullish trading near resistance/all-time highs?
Were the charts extremely bearish trading at bottom prices or long-term support?
Back in April 2025 and August 2024, the market sentiment was down, negative, fearful, and the charts showed powerful bearish signals, everything was down. From this negative scenario we saw the start of a bullish cycle on both instances and it is always the same.
The charts are not bullish when it comes to their technicals, but they have bullish potential. The market looks the best ever right now for buyers. You can trust my words.
WalletConnect (WCT) is trading at bottom prices but also with a long-term higher low. This higher low is now more than five months old—the best possible.
If you are a buyer, a Cryptocurrency trader, someone looking to profit in the short-, mid- and long-term, you are looking at the best possible market conditions. The best time to buy—right before a major bullish wave.
Bitcoin is perfect-safe, strong above 70K. The altcoins market is starting to heat up.
Ethereum is great-awesome, above $2,000 yet, prices are still low. And this is the best possible scenario.
There is still time to buy before a massive run. Thank you my dear friend for your continued support.
WCTUSDT is set to start growing now, this week. Some easy targets are shown on the chart:
200% can be hit short-term.
350% can be hit in the same wave.
967% can be hit mid-term.
1500% can be hit long-term. These are strong but easy targets.
The altcoins market is going up. Bitcoin will also grow.
Thank you for reading.
Namaste.
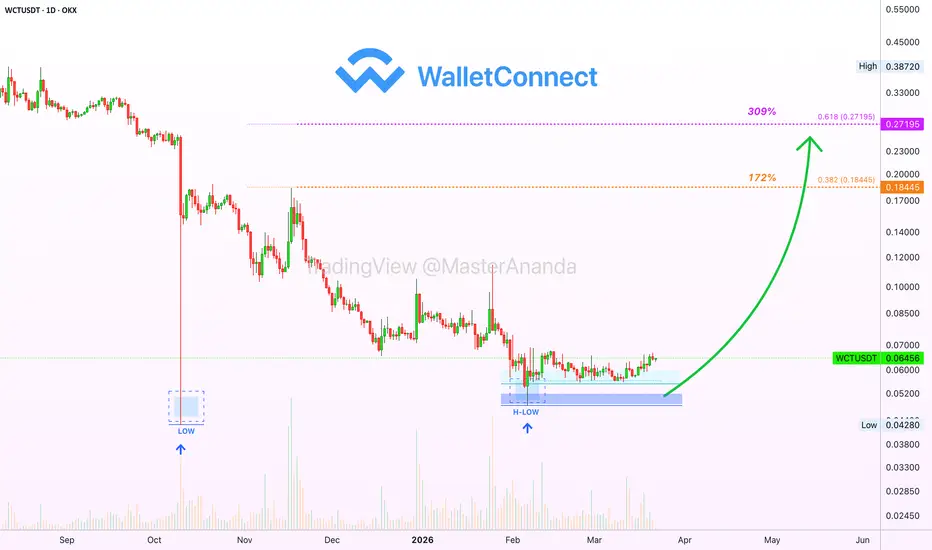
WalletConnect (WCT) Last Chance at Bottom Prices (PP: 2,146%)WalletConnect (WCTUSDT) is still trading at bottom prices, the "opportunity buy-zone." The current price range has been active for 74 days, 2.5 months. This is the accumulation phase. This is a strong project with huge potential for growth. Once it starts rising, there is no going back, we will experience long-term growth. This is the last chance to get in when prices are still low.
The past few years we saw the biggest, worst and hardest bear market across the altcoins, truly brutal. Everything that has a beginning also has an end. And this bear market is over and this is cause for celebration.
The end of the bear market is a two step process for most projects: (1) The October 2025 low signaled the start of the final decline but also the bottom and; (2) months of consolidation, sideways price action, at a long-term higher low—February through April 2026. And that's it.
WalletConnect saw some bullish action at first then a strong decline. It had to move with the rest of the market. It couldn't grow as the rest of the market was following a broader bearish cycle. It has never seen a bull market before.
This is what is about to change. The bottom being confirmed six months ago, it is time for change, something new, likable and appealing—long-term growth.
The blue zone on the chart is the desirable entry range. Buying can be done at multiple levels on the way up, but it is better to secure an entry at lower prices. It makes it easy to hold through the entire bull market process, years of sustained growth. 2026, 2027, 2028 and possibly more.
Namaste.
WCTUSDT - Deep BullWCTUSDT sitting at 0.05964 with futures at 0.05943, a tight spread showing no aggressive futures premium. Spot volume 28.37M against futures 112.43M gives a Normal Spot:Fut ratio — futures are elevated relative to spot dollars at 6.71M versus 1.69M spot, but the overall regime reads balanced rather than ghost. Deep Bull at 60.82% edge, 4.1x leverage ratio, with Clarity at 45.54% — low conviction environment.
Signal board 44 green to 7 red out of 112 is a solid bull lean. C>T 12:2, Candle 14:0, Ichi TK 7:5, Star 3:0, Pat Tot 5:0. EMA only 2:0 which is weak on structure. DD/SS 1:6 is the red flag — distribution and sell signals dominate the pattern layer, contradicting the raw count. Squeeze ELEVATED at 6 bars, BW tightening at 13.21%, Mom Bull and Tighten — compression is building but has not fired yet. Cascade Normal.
Spot Z -0.63 Quiet, Futures Z -0.31 Steady, Combined -0.36 Steady. SpotZ 0:5 sequence -0.63 to -0.65 to 0.02 Rising — spot volume is quietly accumulating from the bottom. Bull:Bear Z -0.08 to -0.57 Neutral. OBV Z 0.20 with Inflow up — the only structural confirmation signal in the stack. S.Mom Exp down at 407%, Loosening. No whale, no liquidations.
Leverage 3.95x Normal, Percentile 23.7% Floor — structurally underlevered and at historical leverage lows, which is a clean setup condition. AT Max 13.41x hit only 18 bars ago — leverage spiked and collapsed fast, now sitting near AT Min 1.01x at 181 bars. Price at 8.4% Floor, demand zone clearly visible on chart beneath current price.
The honest read: price sits on demand at leverage floor and price floor simultaneously — textbook structural long setup. OBV inflow ticking up and SpotZ beginning to rise from -0.65 confirms quiet accumulation is underway. The problem is DD/SS 1:6 shows distribution patterns are printing, Clarity is below 50%, and the squeeze has not fired. Wait for BW to break out of the tighten phase and OBV Z to push above 0.5 before committing. The setup is there but the trigger has not confirmed.
Is That Crypto Pump Real? Data Says No. Here's Why.
Stop Losing Money to Fake Volume. Find Real Moves Now.
Trade the REAL Crypto Volume. Stop Getting Faked Out.
#WCT#WCT is currently trading near the bottom of a falling wedge pattern 📉. This pattern often indicates a potential bullish reversal, especially after a period of downward price action 📊. The breakout target for this wedge is approximately 0.05750 🚀.
A falling wedge can signal a shift from bearish to bullish sentiment.
#WCT #crypto #trading #altcoin
WalletConnect, a top performer in 2026-27 · Accumulation phaseMarket conditions are improving, very slowly but surely. Market conditions are improving in every sense of the word.
Last year, it was brutal with the October 2025 flush. This year, we see only mild bearish action and even some growth. That's part of the changing market dynamics.
Since February, no new lows. That's a start.
WalletConnect (WCTUSDT) is a strong project that looks ready for a bullish wave. It will be a top-performer in the years to come and right now prices are great.
The same strategy that I've been mentioning lately is to be pursued at this point in time, it is the best strategy that can work. Accumulation at bottom prices. Same as the whales and those that have been trading for a decade or more.
"WalletConnect (WCT), an open-source network that connects users to decentralized apps through a secure and interoperable protocol."
All the oscillators —RSI, MACD & STOCH— support long-term growth. This is based on a reading of these on the weekly timeframe. Some have been rising for years while others are recovering now.
It's been 1.5 months since the market bottom. It normally takes three months for the sentiment to change. We are very close.
I know it is early now, but early is best. "Early bird gets the worm."
Thank you for reading.
We are preparing for strong bullish action on the altcoins market, the best since 2021.
Namaste.
WalletConnect, consolidation at bottom prices—200%, 350% & 967%The market looks great. Right now we have the best market conditions since April 2025. What follows will be awesome.
Think back to April 2025 or August 2024. What was the sentiment back then? What about the charts?
Were the charts all hyper-bullish trading near resistance/all-time highs?
Were the charts extremely bearish trading at bottom prices, or long-term support?
Back in April 2025 and August 2024, the market sentiment was down, negative, fearful, and the charts showed powerful bearish signals, everything was down; from this negative scenario we saw the start of a bullish cycle, on both instances and it is always the same.
The charts are not bullish when it comes to their technicals, but they have bullish potential. The market looks the best ever right now for buyers. You can trust my words.
WalletConnect is trading at bottom prices but also with a long-term higher low. This higher low is now more than five months old—the best possible.
If you are a buyer, a Cryptocurrency trader, someone looking to profit in the short-, mid- and long-term; you are looking at the best possible market conditions. The best time to buy—right before a major bullish wave.
Bitcoin is perfect-safe, strong above 70K. The altcoins market is starting to heat up.
Ethereum is great-awesome, above $2,000 yet, prices are still low. And this is the best possible scenario.
There is still time to buy before a massive run. Thank you my dear friend for your continued support.
WCTUSDT is set to start growing now, this week. Some easy targets are shown on the chart.
» 200% can be hit right away, 1-3 weeks.
» 350% can be hit right away, within a month.
» 967% can be hit mid-term, by the time this bullish market phase is over.
These are strong but easy targets.
The altcoins market is going up. Bitcoin will also grow.
Thank you for reading.
Namaste.
WCTUSDT 1D#WCT is facing a resistance cluster that includes the descending trendline, the daily EMA50, and the Ichimoku cloud. RSI and MACD suggest a potential bullish rally, making this setup look promising. Entry is recommended only after a clean breakout above the daily EMA50. If confirmed, the potential upside targets are:
🎯 $0.1093
🎯 $0.1364
🎯 $0.1583
🎯 $0.1801
🎯 $0.2112
🎯 $0.2509
⚠️ Always apply tight stop-losses and maintain strict risk management.
WCT/USDT at Critical Zone – Trend Reversal or Another Leg Down?WCT/USDT on the 2D timeframe remains in a medium- to long-term bearish phase. Price continues to trade below the primary descending trendline originating from the previous distribution top. The overall market structure still shows consistent lower highs and lower lows, indicating that selling pressure remains dominant.
Currently, price is moving sideways below the trendline, signaling a consolidation phase after a strong bearish impulse.
---
Pattern Explanation
The main patterns observed are:
Descending Trendline (Bearish Structure)
The yellow downward-sloping line acts as a dynamic resistance and has rejected price multiple times.
Bearish Continuation Zone
The tight consolidation below the trendline suggests potential:
continuation of the bearish move, or
an accumulation phase before a conditional breakout.
As long as this trendline is not broken with strong confirmation, the primary bias remains bearish.
---
Key Levels
Resistance Zones:
0.096 – 0.107 → nearest resistance / minor supply
0.150 – 0.180 → strong resistance + previous reaction area
0.286 – 0.375 → major supply zone / former distribution area
Support Zones:
0.077 – 0.085 → current support
0.065 – 0.051 → lower demand area / potential capitulation zone
---
Bullish Scenario
The bullish scenario is conditional and only becomes valid if:
1. A strong break and close above the descending trendline occurs
2. Followed by the formation of higher highs and higher lows
If a valid breakout happens, potential upside targets are:
Initial target: 0.107
Continuation: 0.150 – 0.180
Extended target: 0.286
As long as price remains below the trendline, any bullish move should be considered a relief rally, not a full trend reversal.
---
Bearish Scenario
The currently dominant scenario:
Price fails to break the trendline
Rejection occurs around the 0.096 – 0.107 zone
Breakdown below the 0.077 support level
Next downside targets:
0.065
0.051 (major demand and historical low area)
The bearish structure remains valid as long as price stays below the descending trendline.
---
Conclusion
WCT/USDT remains under seller control with a clearly defined downtrend structure. The current price area is a critical zone that will determine whether the market continues its bearish trend or starts forming a medium-term reversal.
No breakout = bearish continuation.
Valid breakout = trend shift confirmation.
Waiting for structural confirmation is strongly advised rather than reacting to price alone.
#wct #wctusdt #cryptocurrency #downtrend #bearishmarket #trendlineanalysis #priceaction #supportandresistance #altcoinanalysis
WCTUSDT UPDATE#WCT
UPDATE
WCT Technical Setup
Pattern: Falling Wedge Pattern
Current Price: 0.07736$
Target Price: 0.15646$
Target % Gain: 205.13%
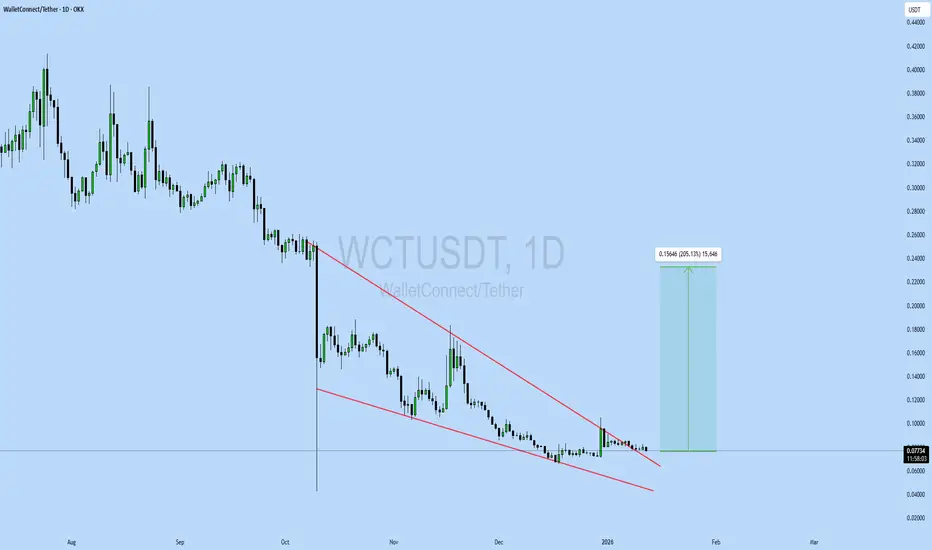
Technical Analysis: WCT is breaking out of a falling wedge pattern on the 1D chart, signaling strong bullish potential. Price has pushed above the descending resistance trendline after prolonged compression, indicating a shift in momentum. The projected target is derived from the measured move of the wedge, pointing toward the 0.156 area if the breakout holds.
Time Frame: 1D
Risk Management Tip: Always use proper risk management.
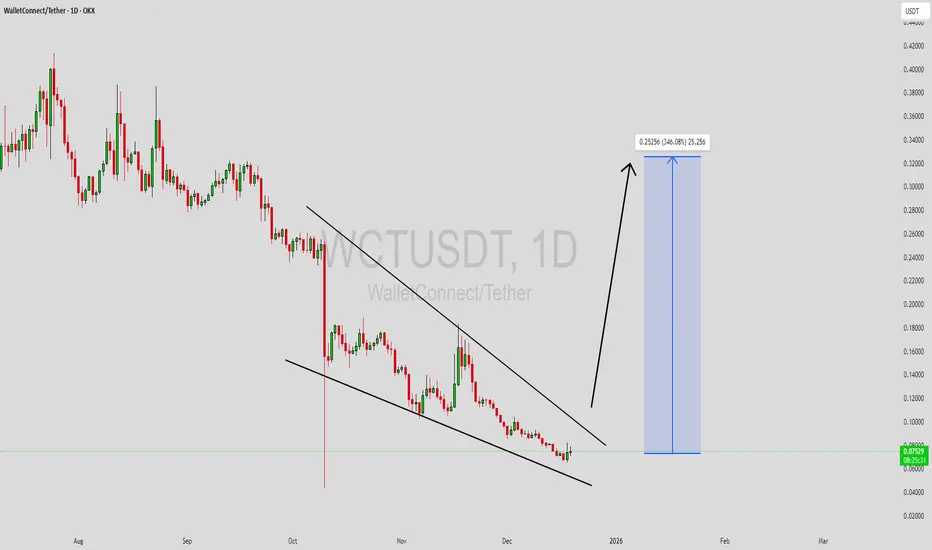
WCTUSDT Forming Falling WedgeWCTUSDT is forming a falling wedge pattern, a classic bullish reversal signal that often indicates an upcoming breakout. The price has been consolidating within a narrowing range, suggesting that selling pressure is weakening while buyers are beginning to regain control. With consistent volume confirming accumulation at lower levels, the setup hints at a potential bullish breakout soon. The projected move could lead to an impressive gain of around 290% to 300% once the price breaks above the wedge resistance.
This falling wedge pattern is typically seen at the end of downtrends or corrective phases, and it represents a potential shift in market sentiment from bearish to bullish. Traders closely watching WCTUSDT are noting the strengthening momentum as it nears a breakout zone. The good trading volume adds confidence to this pattern, showing that market participants are positioning early in anticipation of a reversal.
Investors’ growing interest in WCTUSDT reflects rising confidence in the project’s long-term fundamentals and current technical strength. If the breakout confirms with sustained volume, this could mark the start of a fresh bullish leg. Traders might find this a valuable setup for medium-term gains, especially as the wedge pattern completes and buying momentum accelerates.
✅ Show your support by hitting the like button and
✅ Leaving a comment below! (What is your opinion about this Coin?)
Your feedback and engagement keep me inspired to share more insightful market analysis with you!
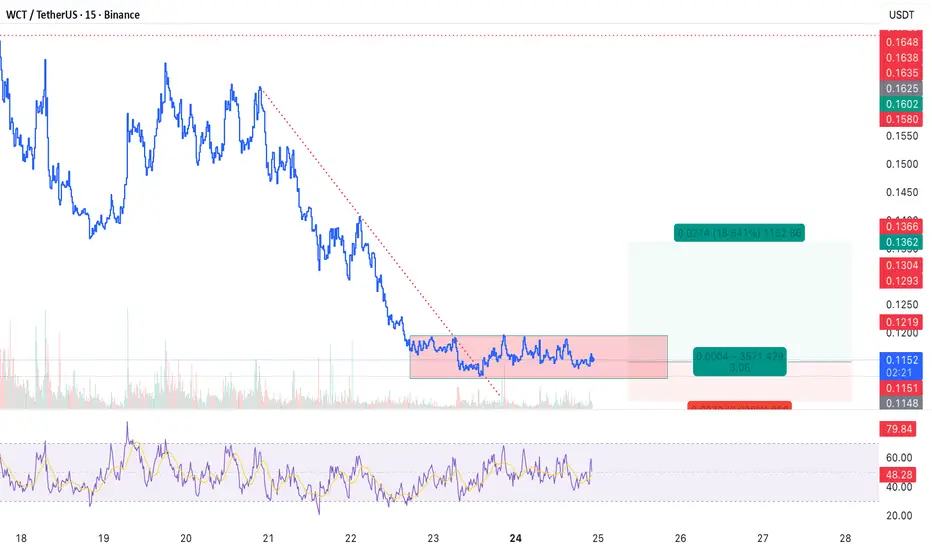
Scalp LONG – WCT🐂 Scalp LONG – WCT
WCT has shifted from a decline into a sideways accumulation phase, indicating that selling pressure has weakened. The price is now holding firmly above a key multi-timeframe support, suggesting strong buyer defense. As momentum builds, a breakout from the current consolidation box could trigger a sharp upward move.
Key Signals
Accumulation after a downtrend → momentum rebuilding
Price holding above strong multi-TF support
High probability of bullish breakout once price escapes the range
🎯 TP: 0.01368
🛡️ SL: 0.1080
📊 RR: 1 : 3
A clean long setup anticipating a volatility expansion to the upside.
Scalp Long – WCT🚀 Scalp Long – WCT
Buying volume is surging as price consolidates above a solid support level. Price action signals a potential move to retest the recent local high, with RSI having already broken out — confirming bullish momentum.
🎯 Trade Setup:
Take Profit (TP): 0.1448
Stop Loss (SL): 0.1205
Risk/Reward Ratio (RR): 1 : 2.97
A strong long setup backed by rising volume, solid support, and a confirmed RSI breakout — favoring a continuation toward higher levels.
Scalp Long – WCT📈 Scalp Long – WCT
Price is showing strong bullish momentum with continuous buying volume. RSI has returned to the buying zone, indicating renewed strength. A move to retest the local high is likely.
🎯 Trade Setup:
Take Profit (TP): 0.1398
Stop Loss (SL): 0.121
Risk/Reward Ratio (RR): 1 : 2.1
A clean long setup backed by strong momentum, rising volume, and technical confirmation of a potential local high retest.
Scalp Long – WCT💎 Scalp Long – WCT
RSI is in the buying zone, and price is holding firmly above key support.
Buying volume is returning, indicating renewed bullish momentum.
The market is testing the local high, showing signs of strength.
🎯 Plan:
→ Enter after confirmation of support hold.
→ TP: 0.1848 | SL: 0.1696 | RR: 1 : 3.14
Structure supports the long bias.
Keep the position lean, trail SL as price climbs.
Stay disciplined — enter only when the setup confirms.
Don’t Miss WCT at Its Lowest Levels – Strong Buy SetupWCT is currently trading near its lowest levels, with the downtrend showing signs of exhaustion and price approaching its historical listing zone.
This creates an attractive risk–reward setup for potential buyers.
Here’s my personal trade plan:
✅ Entry : Buy from current price 0.2580
🎯 Target : 0.2800
The coin is at its bottom range, so if it falls further to 0.2300, I will add another buy position.
And if it reaches the historical listing price at 0.216, that would provide a great long-term buying opportunity once again
Please note:
This is not financial advice – I’m only sharing my personal trades.
Always do your own research before taking action.
👍 Don’t forget to like if you found this useful, and feel free to follow me for more analysis of this kind.
Best of luck 🌹
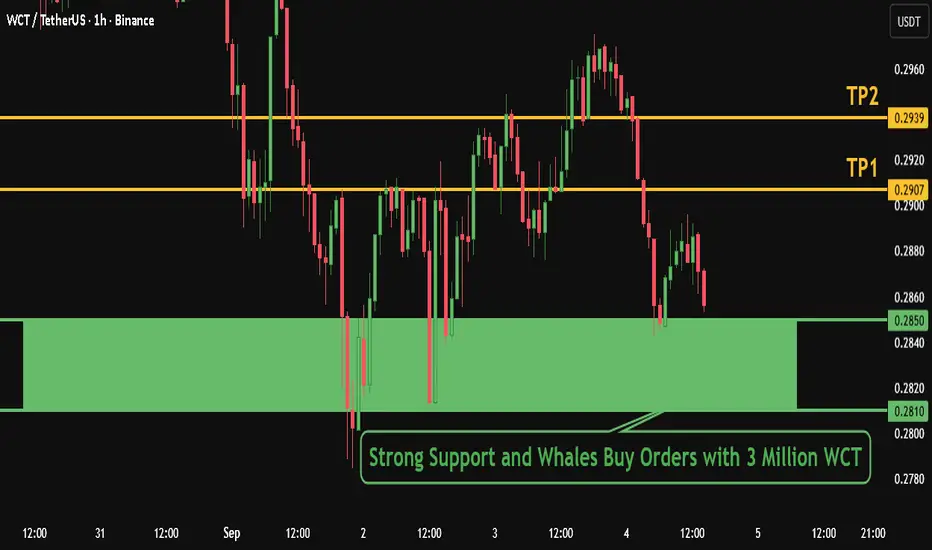
WCT: short-term trade from a Strong Support Zone
BINANCE:WCTUSDT
In this green zone, large buy orders from whales and market makers were detected for WCT, totaling 3 million tokens.
This area also represents a very strong support level for the price.
WCT has exhausted its recent downtrend and is showing signs of being oversold on technical indicators, which signals a potential upward correction.
Entry Method:
A buy entry can be made in in the green zone where whale orders and liquidity are concentrated.
✅ Entry Zone : 0.2850 to 0.2810
Targets:
🎯 TP1: 0.2808
🎯 TP2: 0.2939
Note: If you wish, you can hold for larger targets,
but these are quick targets for those who prefer short-term trades.
Good luck and may you always be profitable!
please note :
this opportunity is not financial advice — it reflects only my personal opinion.
PLEASE always do your own research before trading
A 10-year veteran in crypto. I hunt for hidden gems and deliver concise opportunities directly. Follow for high-value insights.
Thank you 🌹
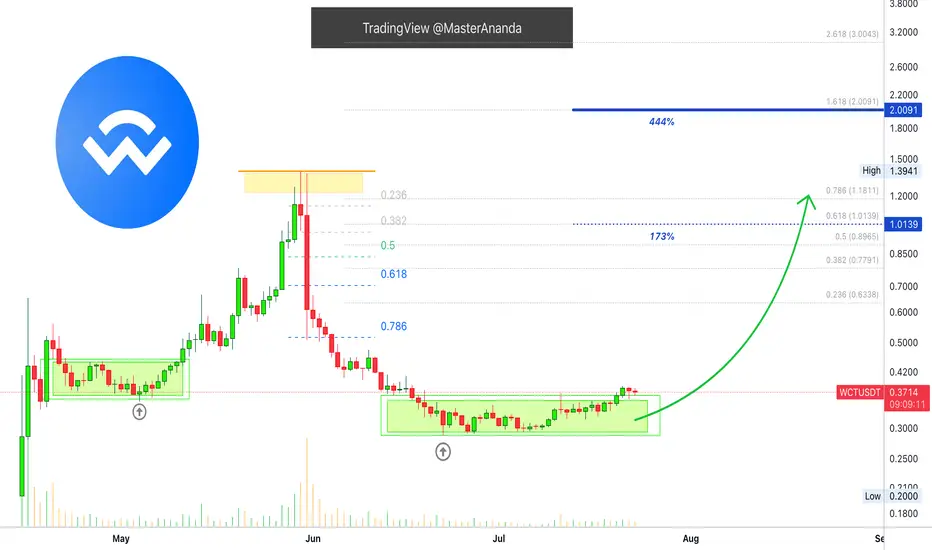
WalletConnect Reaches Support · Simple Signals · Simple StrategyI had to update this chart. It took longer than usual to move and this is always the case. Whenever we plan for 3 days we end up having to wait 10 days. If we plan to wait patiently for two weeks then the wait lasts six weeks and so on. Just be prepared to hold long-term and this can yield better results. No time, just get in when prices are low and hold. This works better.
WalletConnect finally bottomed 22-June and has been recovering slowly. This slow and steady recovery is always a signal of strength and tends to lead to a strong bullish breakout. When you see slowly rising prices for weeks or sometimes even months you know what the outcome will be, a major bullish breakout.
So we buy the support and wait, when the breakout comes, enjoy the profits.
Thank you for reading.
Namaste.