RUSSELL topped on a 19-year Cycle pattern. 2420 correction next?Russell 2000 (RUT) has been trading within a Channel Up since the March 2009 bottom of the Housing Crisis. On that Bear Cycle's Top (July 2007), a very distinct pattern started, which can be measured by the Time Cycles tool and shows (roughly) that every 3.5 - 4 years the Cycle tops and the index corrects on a Bear Cycle.
This is the first time that 4.5 years have passed (since the November 2021 Cycle Top) that we didn't have another Bear Cycle (early 2025 was a Bull Cycle correction).
All five Bear Cycles since the July 2007 Top, pulled back to at least the 1M MA50 (blue trend-line), hitting their respective 0.382 Fibonacci retracement levels in the process. Also, they all topped on Inner Higher Highs trend-lines as RUT did in June and now July. In addition, the 1M RSI has hit its Lower Highs trend-line and is reversing downwards.
As a result, there is a huge cluster of Resistances now and if Russell gets rejected (fails to close a 1M candle above), we expect a new medium-term Bearish Leg correction to start, targeting the 1M MA50 on the 0.382 Fib around 2420. That would also enter the 0.382 - 0.236 Channel Fib Zone, which is where the last two major market bottoms took place.
---
** Please LIKE ๐, FOLLOW โ
, SHARE ๐ and COMMENT โ if you enjoy this idea! Also share your ideas and charts in the comments section below! This is best way to keep it relevant, support us, keep the content here free and allow the idea to reach as many people as possible. **
---
๐ธ๐ธ๐ธ๐ธ๐ธ๐ธ
๐ ๐ ๐ ๐ ๐ ๐
In-depth trading ideas
๏ปฟRussel 2000 week of 25 - 31 July BearishThe Russel 2000 closed this week at $2934.90 currently we have blown below our Fibonacci retracement of $3000.00 and have landed on downwards trend to test our 20 week moving average (MA) . Since the war on Iran is influencing the price of oil this week we are looking at testing the 20 week moving average closing next week down possibly 3%. If by chance we break down past the 3% landing at our next down leg of our retracement of around $2670 (9% lower from where we currently are)we may be looking at a testing the 50 day moving average closing down close to 10%. If by luck things turn to the brighter side we could bounce and gain 2% back testing our $3000.00 retracement, but this is a long shot for the near term outlook. My thoughts for the upcoming week are BEARISH. project a 3% loss for the week closing on the 31st.
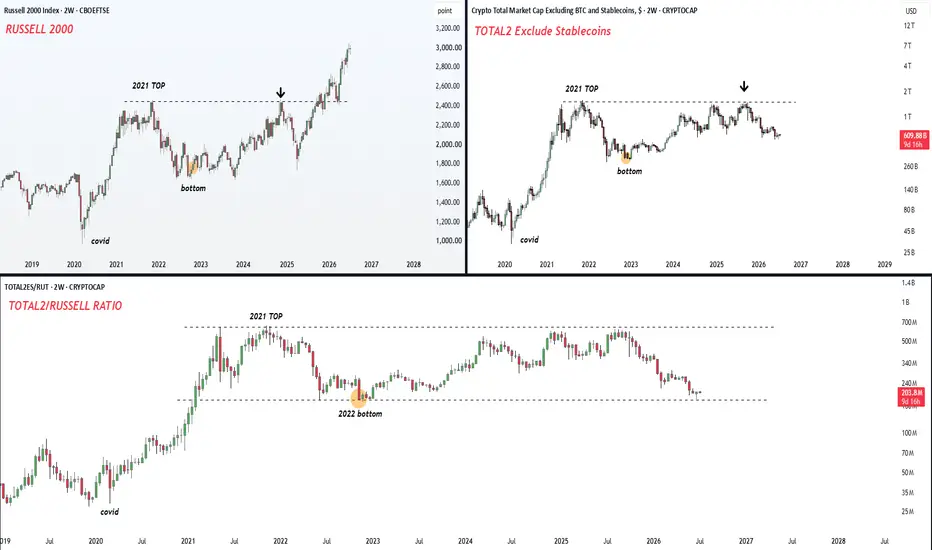
TOTAL2 Exclude Stablecoins vs Russell 2000his chart compares two different risk markets.
On the left, Russell 2000.
On the right, the crypto market excluding Bitcoin and stablecoins.
At the bottom, the relative ratio between the two.
The purpose is simple: Is the broader crypto market structurally dead, or is it still lagging behind traditional risk assets before a new rotation phase? Russell 2000 already completed its post 2021 repair.
It made the 2021 top.
It corrected.
It formed the 2022 bottom.
It retested the old high.
Then it broke out and moved into a new expansion phase.
TOTAL2 excluding BTC and stablecoins is following a similar broad structure, but with a clear delay.
It also made the 2021 top.
It also corrected into the 2022 bottom.
It also rebuilt through 2023 and 2024.
It also returned near the old high region.
But unlike Russell 2000, it has not confirmed a clean breakout yet.
That is the key difference. relative ratio is now near the same lower range that marked the 2022 bottom area. means the broader crypto market is not expensive versus Russell 2000 here.
It is deeply reset.
The ratio is sitting near a region where previous relative weakness reached exhaustion before recovery started.
That does not mean immediate expansion.
It means the market is back in a historical relative value zone.
For the bullish rotation thesis, two things matter now:
First, TOTAL2 excluding BTC and stablecoins must defend its higher base.
Second, the ratio against Russell 2000 must stop losing ground and start reclaiming the lower range. If that happens, the setup changes from lagging risk asset to relative recovery candidate. If the ratio breaks below the 2022 relative bottom and TOTAL2 loses its base, the structure weakens.
So the chart is not giving a completed signal yet.
It is showing a location.
Russell 2000 has already moved through its repair and breakout phase.
Crypto excluding BTC and stablecoins is still sitting at the delayed version of that same question. market is not asking whether altcoins are popular. Its asking whether the broad crypto risk curve can finally stop underperforming traditional small cap risk. the level to watch.
The Importance of the 2905 Price Level for the Russell 2000!The chart highlights the importance of the 2905 area for the Russell 2000 Index, as it represents:
A horizontal support zone with two previous price rebounds.
The extension of an ascending trendline from which the price has rebounded multiple times.
Support provided by the 50-day moving average.
Based on these technical factors, the market's reaction around this level could play a significant role in determining the index's next direction. A bullish rebound from this area could support a continuation of the upward trend, while a break below this support may lead the index to search for a new price low.
The index is down more than 2% since the beginning of the current week, as renewed geopolitical tensions in the Middle East have fueled concerns over higher oil prices and persistent inflationary pressures. Meanwhile, investors are awaiting the release of the June Federal Reserve meeting minutes later today for further clues on the future direction of US monetary policy and its potential impact on the financial markets.
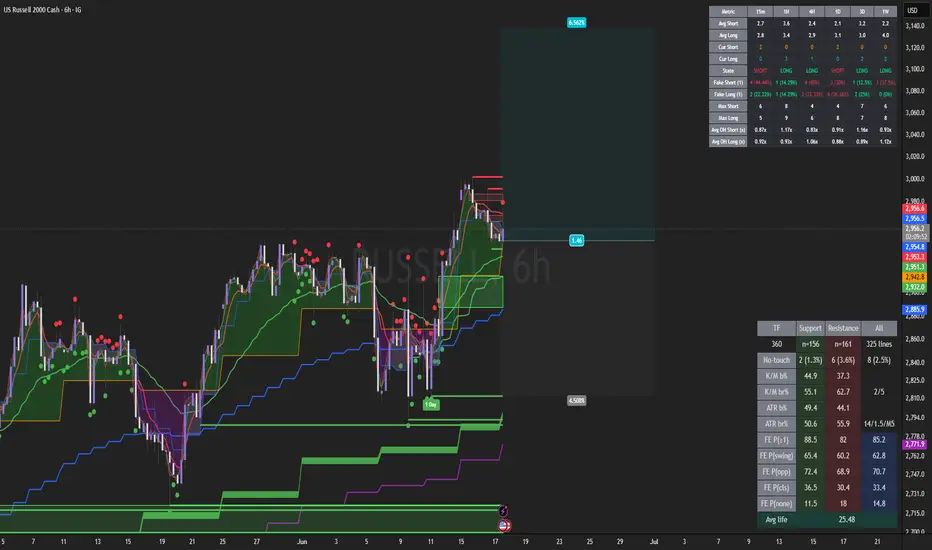
Russell 2000 LONG โ 8H ALMA Setup (WR 83%)โ SETUP
US Russell 2000 cash CFD ยท IG:RUSSELL ยท 8H ยท long only.
ALMA Averaging Strategy: ALMA 3 / ฯ2, SD band 2, min diff 1 bar to add / 1 bar to exit, 25% per bar, up to 4 adds, hard stop โ10% from average entry.
Strategy Tester (Russell 8H, matched alert):
Win rate 83% ยท profit factor 4.0 ยท max drawdown 18%
Typical hold ~61 bars on winners ยท long-only small-cap proxy sleeve
โ
โ WHY NOW
FOMC day โ the book is adding US small-cap exposure while macro headlines focus on Warsh, not on index levels.
Fresh 8H ALMA long fired 17 Jun 07:00 UTC on the 83% WR template. Live journal: one new leg on OV78 ยท three older 8H adds on a separate wr68 template still open ~flat โ this publish tracks the wr83 entry only.
Context from the public ledger: US equities closed green into 16 Jun ( NASDAQ:SOXX +16%, broad US cash batch). Russell sleeve reloads after a quiet week โ latest book exit on this symbol was +3% on a 12H ALMA leg (14 Jun). Open MTM on the fresh 8H leg ~flat at snapshot.
Not a โcall the Fedโ trade โ ALMA flagged discount on the 8H bar into the Warsh press conference. Exits follow ALMA rules or the โ10% hard stop; no discretionary TP ladder.
โ
โ MACRO
FOMC / Warsh (owner frame): hold at ~3.50โ3.75% is priced; the move is rhetoric. Soft tone (inflation โtransitoryโ, debt-market support, DXY lower) = risk-on plumbing โ small caps historically sensitive to liquidity and curve steepening. Hawkish tone + DXY through 101 = risk-off โ cancels the stealth-liquidity thesis.
News tape (16โ17 Jun): equities steady while oil slides under $78; Nasdaq firm vs BTC dip โ stocks/crypto divergence back on the feed. SpaceX post-IPO rotation drains liquidity from mega-cap tech (headline risk for indices, but Russell can benefit from relative small-cap bid if risk holds).
Offsetting headwinds: market prices ~66% hike odds into the year (BeInCrypto / hawk narrative); small caps carry higher beta into any Warsh surprise. Iran/oil headline risk remains a macro tail โ cheap oil helps soft-Fed story until geopolitics flip.
Russell = US domestic / rate-sensitive beta โ execution is 8H ALMA mean-reversion, not an economic forecast.
โ
โ OUTLOOK
Positive factors
- 83% WR / PF 4.0 on the Russell 8H ALMA setup ยท fresh 8H long 17 Jun 07:00Z
- US equities firm into 16 Jun ยท prior Russell exits MayโJun +2.5% to +3.4% on the same 8H template
- EMA โ time vs average, price at line: 1H Cur S:5 vs Avg S:6.3 โ below-session not yet overstretched (below avg); +0.4% dev = at 1H EMA . 1D Cur L:5 vs Avg L:15.3 โ above-run young (5 vs avg 15.3 โ far below norm), room vs typical daily stretch. 4H Cur L:20 vs Avg L:12.2 โ overheated above by time (+65% vs avg), but โ1.0% dev = price back at 4H EMA โ time exhaustion into mean-reversion zone for 8H
- ALMA โ below avg length = not stretched: 1D Cur S:1 vs Avg S:2.7 โ first bar below, well under average short-session length ยท at band (~2962). 3D/1W Cur L:2 vs LAvg 3.5 / 4.0 โ long sessions shorter than norm , slow grid not time-overheated above
- Daily SMC In FVG Bull โ demand zone ~2991 still active below price
Negative factors
- FOMC gap risk on 8H bars โ Warsh presser can gap through a %-based stop
- EMA โ overheated above on slow TFs: 3D Cur L:21 vs Avg L:9.8 (~2ร avg) ยท 1W Cur L:52 vs Avg L:14.9 (~3.5ร avg) at โ13.4% dev โ time above EMA far exceeds normal ; macro uptrend, but shakeout risk before next leg
- ALMA โ LTF still short, near avg: 1H Cur S:2 vs Avg S:3.8 ยท 4H Cur S:3 vs Avg S:3.0 โ below ALMA, sessions not overstretched vs average yet โ downside can extend before mean-reversion; needs daily band hold + 4H reclaim
- 4H EMA time-overheat (L:20 above avg 12.2) meeting the line โ fail here = resistance stack into FOMC
- Correlated Russell exposure if small caps roll over ยท 6H/12H adds can scale size if discount extends
- Past backtest โ live fills on CFD (spread, session gaps)
Base case: 4H EMA time-overheat (L:20 above avg) resolves at the line ยท 1D ALMA hold (S:1 well under avg 2.7) ยท young 3D/1W ALMA long (L:2 under avg) carries โ drift toward ~2990 FVG if Warsh soft.
Bear case: 1W/3D EMA time stretch unwinds (L:52 / L:21 far above avg) ยท 1Hโ4H ALMA below sessions extend toward their averages before bounce ยท lose daily ALMA ยท โ10% hard stop.
US2000 (Russell 2000) Analysis | 4H Timeframe๐ US2000 (Russell 2000) Analysis | 4H Timeframe
Hello to all TradingView friends and followers! ๐๐
Hope youโre all trading smart and protecting capital first. Today weโre reviewing US2000 (Russell 2000 Index) โ one of the most important U.S. equity indices that tracks small-cap companies and is often considered a strong indicator of market risk appetite and economic expectations. ๐บ๐ธ๐
Over recent weeks, this index has shown an impressive bullish recovery and strong upside momentum, bringing price back into an important technical decision area.
๐ Fundamental Perspective
From a macro point of view, markets are currently reacting to a combination of economic data, interest-rate expectations, and geopolitical developments.
One topic receiving attention is discussion around lower geopolitical tensions and potential de-escalation in regional conflicts, whichโif sustainedโcould improve market sentiment and support risk assets. ๐๏ธ๐
However, outcomes around geopolitical events remain uncertain and markets can quickly reprice expectations.
If global uncertainty decreases and capital rotates back into equities:
โ
Risk appetite may improve
โ
Small-cap indices could attract additional inflows
โ
Equity markets may maintain upward momentum
But traders should avoid pricing in outcomes before confirmation. โ ๏ธ
๐ Technical Analysis
Looking at the chart structure, US2000 has been in a strong bullish wave recently ๐
Price has:
๐น Produced a series of higher lows
๐น Maintained bullish momentum
๐น Returned toward a major resistance region highlighted on the chart
At the moment, we are trading directly inside an important resistance area where the next directional move may become clearer.
๐ข Bullish Scenario | Resistance Breakout
If buyers manage to absorb supply and confirm a clean breakout above the resistance zone:
๐ Continuation of the bullish trend becomes more likely
๐ Momentum could accelerate toward higher liquidity areas
๐ The recent upward structure remains valid
For confirmation, Iโd personally monitor:
โ๏ธ Strong candle closes above resistance
โ๏ธ Successful retest of breakout level
โ๏ธ Continued higher lows after breakout
๐ Alternative Scenario | Fake Breakout Risk
One important point that should not be ignored:
โ ๏ธ There is still a realistic possibility of a fake breakout.
Price could:
โก๏ธ Break resistance briefly
โก๏ธ Attract late buyers
โก๏ธ Fail to hold above the level
โก๏ธ Reverse back into the range
This scenario is especially common near major resistance areas and after extended bullish runs.
Patience and confirmation remain critical here. ๐ฏ
๐ Market Bias
Current structure: Short-term Bullish ๐ข
Decision zone: Major Resistance โ ๏ธ
Risk: False breakout remains active ๐
๐ Community Poll
Whatโs your expectation for US2000?
๐ Breakout and continue higher ๐
๐ Fake breakout then correction ๐
๐ Sideways consolidation โ๏ธ
Share your view below ๐
โ ๏ธ Disclaimer
This analysis is for educational purposes only and reflects personal market interpretation. It is not financial advice. Always do your own research and apply proper risk management before entering any position.
๐ท๏ธ Tags
#US2000 #Russell2000 #Indices #StockMarket #TradingView #TechnicalAnalysis #PriceAction #MarketAnalysis #Bullish #Breakout #Fakeout #SupportAndResistance #SwingTrading #RiskManagement #Investing #Finance #USStocks #Trading #EquityMarkets ๐๐บ๐ธ
IWM Holding Breakout Zone โ Small Caps Look Ready to Push HigherCurrent Price: 2833.50 (Analysis was generated on Monday Morning)
Direction: LONG
Confidence level: 85%(Trader consensus remains unified across group metrics.)
Targets
Target 1: 2885.00
Target 2: 2925.00
Stop Levels
Stop 1: 2795.00
Stop 2: 2765.00
Key Insights:
IWM is sitting right around a consolidation band that has been forming over the past several sessions. Price isn't fading aggressivelyโit's compressing. That type of price behavior often signals accumulation rather than distribution. Traders tend to watch these tight ranges because once the breakout happens, momentum funds pile in quickly.
Another factor supporting the upside is sector composition. The Russell 2000 includes a heavy mix of financials, industrials, and cyclicals. Over the past few sessions those groups have quietly held up well, even while mega-cap tech cooled slightly. That rotation dynamic often feeds into smallโcap ETFs like IWM.
Technically, I'm tracking the 2800 region as a key demand pocket. Every dip toward that zone has attracted buyers. As long as price stays above that level this week, the path of least resistance looks higher toward fresh shortโterm highs.
Recent Performance:
Over the last few sessions, IWM has traded sideways near elevated levels rather than correcting sharply. That's important. Strong markets usually pause through time rather than through price declines. The ETF is essentially digesting its previous rally.
Expert Analysis:
Several professional traders I follow on YouTube highlighted that the Russell structure looks like a โbull flagโ on the 4โhour and daily charts. None of them showed aggressive bearish positioning. The consensus tone is more like โwaiting for confirmation to add longs.โ
On X, sentiment isn't euphoric, which actually helps the bull case. Excess optimism often marks tops, but neutral sentiment with steady dip buying usually means there's still fuel for an upside push.
News Impact:
The broader macro narrative in 2026 still favors domestic growth themes. Small caps typically benefit more from U.S. economic acceleration than multinational giants. Any positive macro data this week could easily trigger a quick rotation into the Russell complex.
Trading Recommendation:
I'm positioning LONG for the week. The setup favors continuation higher if the consolidation breaks upward.
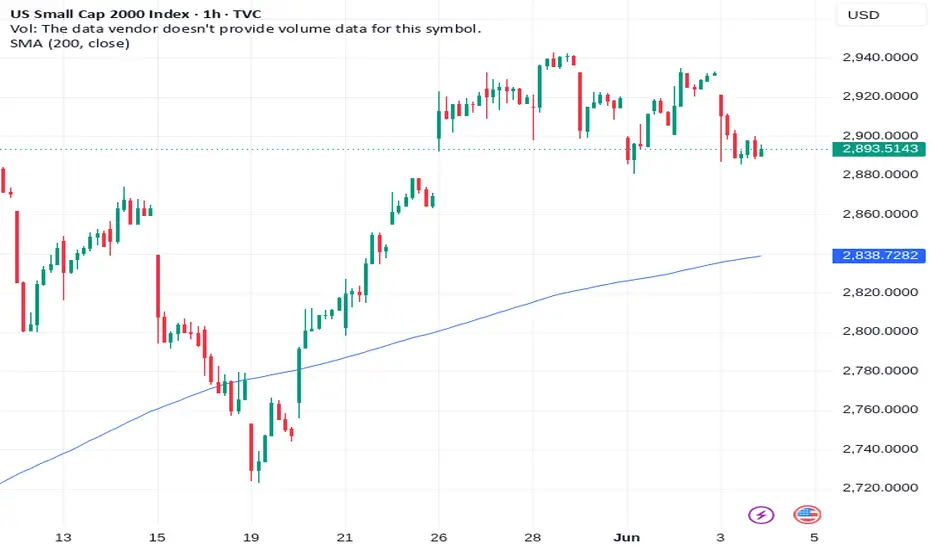
Russell 2000 Index Facing Intraday Volatility PressureCurrent Price: 2893.51
Direction: SHORT
Confidence level: 85%(Trader consensus remains unified across group metrics.)
Targets
Target 1: 2878.00
Target 2: 2860.00
Stop Levels
Stop 1: 2908.00
Stop 2: 2925.00
Wisdom of Professional Traders:
Across both professional trader commentary and X sentiment, the tone around smallโcap equities and related highโbeta growth names is cautious for TODAYโs trading session. Several traders highlighted rising volatility signals (VVIX rising, VIX buyers appearing) and technical breakdown risks after a recent extension rally. That matters because the Russell complex typically reacts faster than megaโcap indices when volatility returns.
What's interesting is the divergence happening right now. Largeโcap tech (QQQ/semis) still looks relatively stable, but traders repeatedly flagged small caps and IWM as the weak link. Some posts explicitly said โnearโterm avoidโ and pointed to potential tests of lower anchored VWAP levels. When professionals call out relative weakness inside a market, it often shows up first as intraday selling pressure rather than a multiโday crash.
On X sentiment, there were darkโpool buy prints in IWM but they weren't large enough to offset broader volatility chatter and bearish technical frameworks circulating among trading desks. That combinationโrising volatility, stretched charts, and weaker relative breadthโusually translates into intraday pullbacks rather than immediate continuation moves.
So my working thesis for TODAY only:
Smallโcap exposure and highโbeta AI infrastructure names are vulnerable to a mild intraday riskโoff move. I'm expecting selling pressure across the Russell complex and correlated growth names during todayโs session.
Key Insights:
The Russell 2000 is particularly sensitive to liquidity shifts, and the discussion among traders today revolves around volatility expanding again. Several professional chart analysts pointed out that volatility products began rising earlier this week, which often precedes shortโterm equity pullbacks.
For TODAYโs session specifically, the Russell looks vulnerable because it tends to lag when megaโcap tech leadership narrows. If large caps hold steady while volatility increases, smaller companies often absorb the selling pressure first. That's exactly the dynamic traders are watching.
The real story here is positioning. Small caps rallied sharply into late May and early June, which leaves them exposed to intraday profitโtaking once volatility starts to reappear.
Recent Performance:
Heading into todayโs session, the Russell has been trading near recent highs but with momentum slowing. Several desks noted that price has stretched away from shortโterm moving averages, which often leads to a meanโreversion move intraday.
Expert Analysis:
Professional traders on YouTube and trading rooms highlighted a key point: while megaโcap tech still looks structurally strong, Russell charts show weaker momentum and more vulnerability to volatility spikes. On X, traders repeatedly referenced potential tests of lower support levels.
That consensus doesn't scream collapseโbut it does point toward a tactical short bias for TODAYโs session.
News Impact:
Macro chatter about Middle East tensions, rising oil prices, and elevated yields adds to the riskโoff tone. None of these alone breaks the market, but together they create a backdrop where traders reduce exposure intraday.
Trading Recommendation:
For TODAY only, the Russell favors a tactical short setup with a modest pullback expectation as volatility rises.
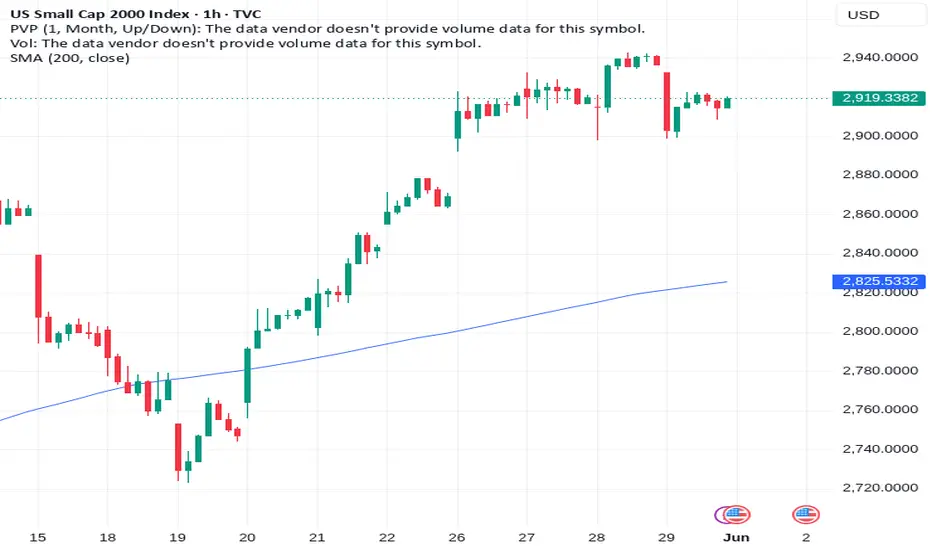
SmallโCap ETF Reflecting Institutional Selling PressureCurrent Price: 2919.94
Direction: SHORT
Confidence level: 85%(Trader consensus remains unified across group metrics.)
Targets
Target 1: 2895.00
Target 2: 2865.00
Stop Levels
Stop 1: 2940.00
Stop 2: 2965.00
Wisdom of Professional Traders:
Here's my take for TODAYโs trading session only: the broader smallโcap and highโbeta growth ecosystem looks vulnerable to intraday downside pressure. When I combine the signals from professional traders on YouTube and the realโtime sentiment flow on X, the common theme is distribution rather than aggressive accumulation.
Several traders I track pointed out that indexes tied to smallโcap growth โ particularly the Russell complex โ are sitting near extremes after a strong run. What's interesting is the tape data shared widely on X showing consistent institutional selling across AMEX:IWM , NASDAQ:QQQ , and $SPY. Dark pool data highlighted roughly $700M+ of selling in AMEX:IWM alone. That doesnโt guarantee a crash, but for TODAYโs session it increases the probability of downside rotations or intraday pullbacks.
The real story here is positioning. A lot of AI infrastructure names (CRDO, RMBS, AEIS), speculative tech (IONQ), and highโbeta industrial/infra names (STRL, FN) have already rallied aggressively into late May 2026. Professional traders I follow on YouTube often describe this setup as โextended momentum with fragile support,โ which tends to produce intraday pullbacks rather than immediate trend continuation.
So when I combine:
โข Index distribution signals
โข Overextended highโbeta stocks
โข Mixed sentiment with retail still optimistic
โข Institutional flow leaning defensive
โฆit points toward a unified SHORT bias for TODAYโs intraday trading window. The expectation isn't a crash โ just controlled downside drift of roughly 0.5%โ3% across this group during todayโs session.
Confidence: Moderate (sources somewhat mixed, but institutional flow and positioning lean bearish intraday).
Key Insights:
IWM is showing the clearest sign of institutional selling flows according to recent dark pool activity.
This kind of distribution often leads to shortโterm pullbacks during the same trading session.
Since many tickers in this group are correlated with small caps, IWM weakness supports the unified SHORT thesis.
Recent Performance:
IWM trades around $2919.94 near recent highs.
Expert Analysis:
Professional traders are increasingly cautious about small caps after a sharp rally.
News Impact:
Macro uncertainty and inflation expectations are influencing positioning.
Trading Recommendation:
Short bias for TODAYโs session.
Russell 2000 Index Maintaining Upward Intraday BiasCurrent Price: 2936.57
Direction: LONG
Confidence level: 85%(Trader consensus remains unified across group metrics.)
Targets
Target 1: 2955.00
Target 2: 2985.00
Stop Levels
Stop 1: 2915.00
Stop 2: 2895.00
Wisdom of Professional Traders:
Across this group the dominant signal for TODAYโs intraday session (May 29, 2026) is riskโon momentum, particularly in AI infrastructure, semiconductors, quantum computing, and smallโcap equities. When I combine what professional traders are saying on YouTube with sentiment flows from X, the picture leans clearly bullish for today only.
Several themes line up:
โข Institutional accumulation โ Dark pool data shows large buy prints in tech leaders and ETFs like IWM. Traders are repeatedly pointing out that institutions are buying individual names while hedging indices. That typically supports intraday upward drift in highโbeta stocks.
โข AI / semiconductor infrastructure momentum โ Names like CRDO, RMBS, AEIS and FN sit inside the same supply chain tied to AI hardware expansion. Multiple traders on X are highlighting these companies as beneficiaries of ongoing AI spending.
โข Quantum and speculative tech rotation โ IONQ continues receiving heavy social momentum due to government investment headlines in the quantum computing sector.
โข Smallโcap bid โ Russell 2000 futures (RTY=F) and IWM flows show steady accumulation. When small caps get a bid, momentum often spreads into higherโbeta tech and infrastructure names during the same session.
โข Sector catalysts โ Space stocks (SATS), hydrogen energy (BE), and metals miners (CDE) all have positive narrative momentum circulating on X today.
So the collective takeaway from traders I'm tracking: momentum is still upward for todayโs trading session, even if some names are extended longerโterm. The intraday expectation is continued dips being bought.
Because of that alignment between institutional flows, sector narratives, and trader positioning, the unified call for TODAY ONLY is LONG across the entire group.
Confidence level: ModerateโHigh for intraday continuation.
Key Insights:
The Russell 2000 index reflects the broader risk appetite among traders today. Current sentiment suggests continued rotation into smaller companies.
Several traders on X highlighted that multiple indices activated power trend signals, which historically precede sustained upward sessions.
For today only, that signal favors continued upside.
Recent Performance:
The index has hovered near record levels, indicating steady demand.
Expert Analysis:
Professional traders are watching whether buyers continue stepping in on minor pullbacks.
Most agree that as long as small caps stay bid, the intraday path remains higher today.
News Impact:
Index reconstitution events often increase volume and attract institutional repositioning.
Trading Recommendation:
Intraday traders generally lean bullish today while momentum holds.
US2000 index Wave Analysis โ 27 May 2026- US2000 broke resistance level 2900.00
- Likely to rise to resistance level 3000.00
US2000 index recently broke the resistance zone lying at the intersection of the key resistance level 2900.00 โ which stopped the previous impulse wave (1) at the start of May and the resistance trendline of the weekly up channel rom November.
The breakout of this resistance zone accelerated the active intermediate impulse wave (3) from the middle of May.
Given the strong weekly and daily uptrends, US2000 index can be expected to rise to the next round resistance level 3000.00.
RUT (1D) โ Russell 2000 near highs with bullish macroCBOEFTSE:RUT
The Russell 2000 trades around 2,869 points, a step away from the all-time high printed at 2,888 and after gaining a little over 40% in the past 52 weeks. The daily moving average structure is perfectly stacked in bullish order, with the EMA 9 (2,826) above the EMA 20 (2,805) and that in turn over the EMA 50, 100 and 200, all in positive slope. Price leans on the EMA 5 (2,833) and the EMA 9 after a vertical rebound from 2,747, a recovery that has brought the index back into contact with its historical ceiling. The tactical nuance shows up in short-term momentum, where the daily MACD keeps the main line below its signal with a slightly negative histogram (33.75 versus 41.41) and TRIX still holds a bearish reading yet to confirm the turn up. It is the fingerprint of a recent digestion that price is already leaving behind.
Monthly Analysis. On the macro timeframe the primary trend is in full expansion, with the monthly EMA stack ordered to the upside and price well above the EMA 9 (2,598). The monthly MACD prints a clearly positive histogram (179.34 over a 134.08 signal) and TRIX keeps the fast line above the slow one with momentum expanding, a combination that describes an intact underlying impulse with no signs of exhaustion. The Stochastic with its four periods saturated in the upper zone (macro at 95, classic at 91) together with RSI 14 at 69 confirms an embedded trend reading rather than a top, the typical behavior of an index advancing toward highs in the strong phase of the cycle.
Weekly Analysis. The intermediate timeframe is the one that best draws the swing leg. The weekly EMA stack repeats the bullish order with the EMA 9 at 2,754 and the EMA 5 at 2,808 supporting the advance, and the latest candle closes with a gain above 2.7% after tapping 2,888 and keeping its body in the upper part of the range. The weekly MACD expands its histogram in positive territory (95.43 versus 74.26) and TRIX holds the bullish bias with only a slight cooling, so the mid-term backs the macro. The weekly Stochastic saturated across all four periods and RSI 14 at 67 reflect overbought conditions, but this is the healthy overbought of a breakout, not the divergence that precedes a reversal.
The Russell 2000 groups the two thousand small-cap companies of the US market and works as the most direct thermometer of the domestic economy and of risk appetite. Unlike the indices dominated by technology megacaps, its behavior depends on credit financing, on interest-rate sensitivity and on the health of the internal cycle. The catalyst sustaining the move is the expectation of looser monetary policy, which lowers the cost of capital for companies more leveraged and cyclical than the large ones, along with the rotation of flows from the leaders toward the laggards. The main risk is precisely that fragility, since any rebound in long-term yields or a deterioration in credit hits small caps before the rest of the market.
Key levels:
- Resistance: 2,888 (current all-time high)
- Psychological resistance: 2,900 (round number)
- Extension: zone above 2,900 (projection if it breaks)
- Dynamic support: daily EMA 5 and EMA 9 (2,826-2,833)
- Support 1: daily EMA 20 (2,805, first cushion)
- Support 2: daily EMA 50 and weekly EMA 9 (2,732-2,754)
- Structural support: weekly EMA 20 (2,664, base of the leg)
Setup Rating โ 4/5 โญโญโญโญโญ (Solid bullish trend with the short term just reset, caution on macro overbought)
โ
Positive factors:
- EMA stack 9/20/50/100/200 perfectly aligned on monthly, weekly and daily, with no bearish crossover
- Monthly and weekly MACD and TRIX in bullish expansion, with underlying momentum intact
- Vertical rebound from 2,747 that brings the index back into contact with the all-time high at 2,888
- Daily Stochastic turning up again after the recent bullish crossovers, with the short term discharged
- Daily RSI 14 at 60, still far from the ceiling of the oscillator, leaving room before an extreme short-term overbought
โ ๏ธ Cautions:
- Stochastic saturated across all four periods on weekly and monthly, with RSI 2 near the ceiling of the oscillator
- Daily momentum still unconfirmed on the turn (MACD below its signal and TRIX in a fading bearish bias)
- Price pinned to the historical resistance at 2,888, a zone that usually demands several attempts before giving way
- More volatile and rate-sensitive nature of small caps, a risk factor if long-term bond yields rebound
๐ A close defending the daily EMA 5 and EMA 9 keeps the attack on 2,888 alive along with the subsequent break of the round number at 2,900. A lateral consolidation between 2,805 and 2,888 for one or two weeks that cools the Stochastic without losing the daily EMA 9 would be the cleanest setup for the next bullish leg.
๐ Loss of the daily EMA 9 and EMA 20 on a close would open a retracement toward the cluster of the daily EMA 50 and the weekly EMA 9 (2,732-2,754) and, if it extends, toward the weekly EMA 20. It would be a healthy correction to purge the overbought and would only put the structure under review if the index lost the weekly EMA 20 at 2,664 on a weekly close.
Do you see the rotation into small caps with real upside, or do you still prefer the megacaps? ๐
Russell 2000 Climbs While Market Watches Fed Pressure๐จ US2000 / Russell 2000 Index CFD โ Small Caps Ready For Another Expansion Wave? ๐๐ฅ
๐น Asset: US2000 "U.S. SMALL CAP RUSSELL 2000 INDEX" CFD
๐ Market Type: Index CFD
โณ Trade Style: Day Trade / Swing Trade
๐ข Market Bias: Bullish Momentum Plan
โโโโโโโโโโโโโโโโโโโ
๐ฏ ENTRY PLAN
โ
You can enter from current market price zones based on your own risk management and confirmation setup.
๐ Bulls still showing strength while momentum traders continue buying dips in the small-cap sector.
โโโโโโโโโโโโโโโโโโโ
๐ TARGET ZONES
๐ฏ Target 1: 2770
๐ฏ Target 2: 2790
๐ฏ Main Swing Target: 2810
โ ๏ธ Important Technical Observation:
The 2810 region is acting like a major psychological resistance zone.
Overbought conditions, profit-taking pressure, liquidity traps, and possible reversal structures may appear there.
๐ Smart traders protect profits instead of marrying the trade.
โโโโโโโโโโโโโโโโโโโ
๐ STOP LOSS
๐จ Thief SL: 2710
โ ๏ธ Risk Reminder For Thief OGโs:
Dear Ladies & Gentlemen, I never recommend copying only my SL or TP blindly.
Trading is your personal responsibility.
Manage your own risk, secure profits wisely, and trade with discipline. ๐ผ
โโโโโโโโโโโโโโโโโโโ
๐ RELATED MARKETS & CORRELATION TO WATCH
๐ US500 (S&P 500)
If large-cap U.S. equities remain bullish, small caps may continue gaining momentum.
๐ NAS100
Tech strength often improves overall market sentiment and liquidity appetite.
๐ต DXY (U.S. Dollar Index)
A weaker dollar can support risk assets and equities.
A stronger dollar may pressure indices short term.
๐ US10Y Treasury Yield
Rising Treasury yields are currently one of the biggest risks for Russell 2000.
Higher yields increase borrowing costs for small-cap companies.
๐ข๏ธ USOIL / WTI Crude Oil
Higher oil prices may increase inflation pressure and reduce bullish momentum in equities.
๐ฆ BANKS & SMALL CAPS
Regional banking stability is important because Russell 2000 companies rely heavily on financing and lending conditions.
โโโโโโโโโโโโโโโโโโโ
๐ฐ LIVE MARKET FUNDAMENTAL & ECONOMIC FACTORS (LONDON SESSION UPDATE)
๐ Current Market Conditions:
โข U.S. Treasury yields recently pushed higher, creating pressure on small-cap stocks.
โข Traders are watching future Federal Reserve rate decisions carefully.
โข Market expectations for possible future Fed tightening increased recently.
โข Russell 2000 remains strong overall in 2026 performance, but volatility is increasing near resistance zones.
โข Inflation concerns and rising energy prices continue influencing equity sentiment.
โข AI-driven infrastructure growth and improved earnings are still supporting broader risk appetite.
โข Small-cap stocks remain highly sensitive to interest-rate expectations and liquidity conditions.
๐
Upcoming High-Impact Factors Traders Watching:
โข Federal Reserve speeches & rate outlook
โข U.S. Jobless Claims
โข Inflation data (CPI / PPI)
โข Treasury Yield movement
โข Crude Oil volatility
โข U.S. Consumer Spending & Retail Sales
โ ๏ธ Market currently says:
Short-term bullish momentum still exists, BUT higher yields and overbought conditions are creating caution near resistance levels. Momentum traders remain active while institutions monitor macro risks closely.
โโโโโโโโโโโโโโโโโโโ
๐ง THIEF TRADER MINDSET
๐ฌ โThe market rewards patience more than prediction.โ
โโโโโโโโโโโโโโโโโโโ
๐ฅ THIEF OG FINAL MESSAGE
Trade smart.
Protect capital first.
Never force entries.
The market will always create another opportunity. ๐๐ฐ
If bulls defend momentum correctly, US2000 may continue expanding toward higher liquidity zones.
But rememberโฆ resistance zones are where smart money tests trader emotions. โก
Support and Resistance: knowledge which you need to make profitThink of price as a ball in the room. Support is the floor (price bounces up) and resistance is the ceiling (price bounces down). These zones form where the market has turned many times in the past. Why do they work? Because thousands of traders see the same charts and place orders in the same places. It's a self-fulfilling prophecy - and that's why the levels actually work.
Important nuance:
After the breakout, the levels change roles: former resistance becomes support, and vice versa. This is one of the most powerful signals in technical analysis.
Working strategy: โRebound from the levelโ
This is a simple and proven strategy for most markets: stocks, crypto, forex, indices.
1) Find a strong level
A level is strong if the price has touched it 3+ times on a daily or 4-hour chart. The more touches, the more reliable the level. Timeframe: D1 or H4 (or higher)
2) Wait for the price to approach the level
Don't enter early! Wait until the price approaches the level and begins to form a reversal candle (pin bar, engulfing, doji). Confirmation required
3) Entry with short stop loss
Buy just above support - place a stop behind the level (0.5โ1% below). So you risk little, but make money on the upward movement.
Take profit at the next level
The goal is the next resistance. This gives a risk/reward ratio of 1:2 to 1:4.
Close half of the position ahead of schedule and hold out for the rest.
Target: nearest resistance
If RSI(14) is below 40 when approaching support, a rebound is more likely. If there is resistance, RSI above 60 strengthens the signal for a short. But RSI as a filter - not the only important indicator.
โ
THE MAIN RULE
Never risk more than 1-2% of your deposit on a single trade. Even with the best strategy, there will be unprofitable entries - this is normal. The result for a series of 10โ20 transactions is important.
What to do in a falling or sideways market?
Most beginners lose money precisely because they continue to โbuyโ in a downtrend. Here's how to proceed in each case:
FALLING MARKET (DOWNTREND)
Don't blindly buy at the bottom
Sell on rebounds to resistance
Wait for a breakout upwards with volume for a reversal
Hold Cash - this is also a position
Reduce your position size by 2 times
Example: BINANCE:HMSTRUSDT , NYSE:SPCE , BINANCE:GLMRUSDT
SIDE MARKET (FLAT)
Buy at the lower border of the channel
Sell at the top line
Stop just outside the channel
Donโt wait for the โbig moveโ - there isnโt one
Reduce the take profits - the market is โnarrowโ
Example: IG:RUSSELL , COINBASE:ETHUSD , BINANCE:LTCUSDT
โ ๏ธ Main error is Trade the same way as in a growing market. Flat and downtrend are a different game. Smaller position sizes, shorter targets, willingness to not trade at all.
6 rules that will save your deposit
1) Trade levels from multiple timeframes - if a level is visible on D1 and H4 at the same time, it is much stronger.
2) Don't enter in the middle of the channel - only from the borders. The middle is no man's land.
3) Volume confirms the breakout - a breakout without an increase in volume is often false.
4) Do not average the loss - if the stop is triggered, it means the level did not hold. Go out and wait for a new signal.
5) Keep a trading journal - write down every trade. After 20 trades you will see your error patterns.
6) Be patient - good levels with an ideal entry appear 2-4 times a week, not more often.
๐Result
Support and resistance levels are not magic, but market psychology recorded on the chart. Where many people place orders, the movement slows down or reverses. Master one strategy - โlevel bounceโ - and apply it with discipline. You don't need 10 different systems. We need one, but with iron discipline in risk management.
๐ HOW TO START RIGHT NOW?
Open my Tradingview profile โ select any asset โ switch to D1-W1 โ find 3 horizontal zones where the price is reversed at least 3 times. These are your trading levels for this week.
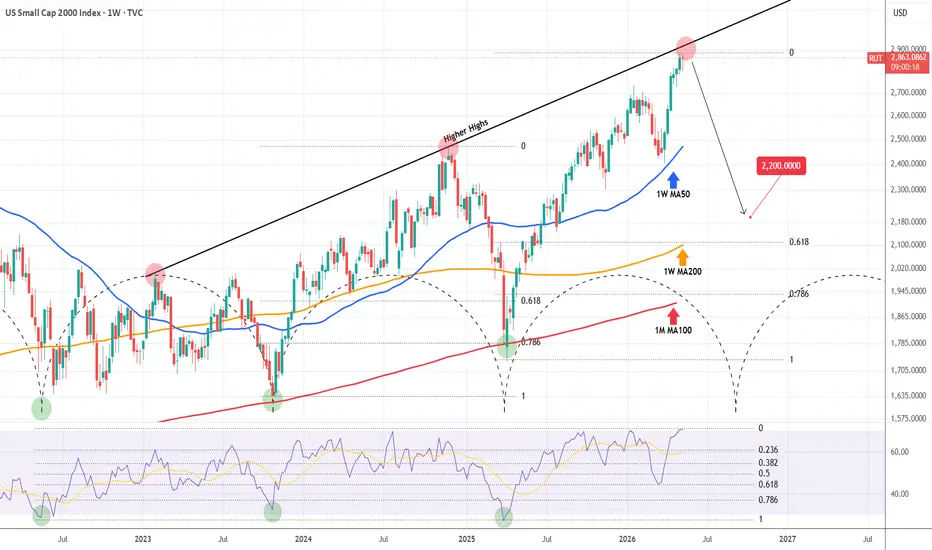
RUSSELL hit top of 3year Resistance. Correction to 2200 possibleRussell 2000 (RUT) hit the top of a Higher Highs trend-line that goes back to the week of January 30 2023 and whose rejections initiated corrections back to the 1M MA100 (red trend-line). At the same time, the 1W RSI just turned overbought (>70.00) for the first time since the week of January 12 2026, which kick-started the recent correction to the 1W MA50 (blue trend-line).
As a result, we have a combination of Resistance levels here and as long as the index doesn't break higher, it is technically possible to see a long-term correction towards the 1W MA200 (orange trend-line) at least, which has been the most common Support level in recent years but hasn't been tested in 1 year (since May 05 2025).
Therefore, we expect Russell to reach 2200 before it turns into a long-term buy again, unless the 1W RSI turns 35.00 first, which would be a good long-term buy opportunity on its own.
---
** Please LIKE ๐, FOLLOW โ
, SHARE ๐ and COMMENT โ if you enjoy this idea! Also share your ideas and charts in the comments section below! This is best way to keep it relevant, support us, keep the content here free and allow the idea to reach as many people as possible. **
---
๐ธ๐ธ๐ธ๐ธ๐ธ๐ธ
๐ ๐ ๐ ๐ ๐ ๐
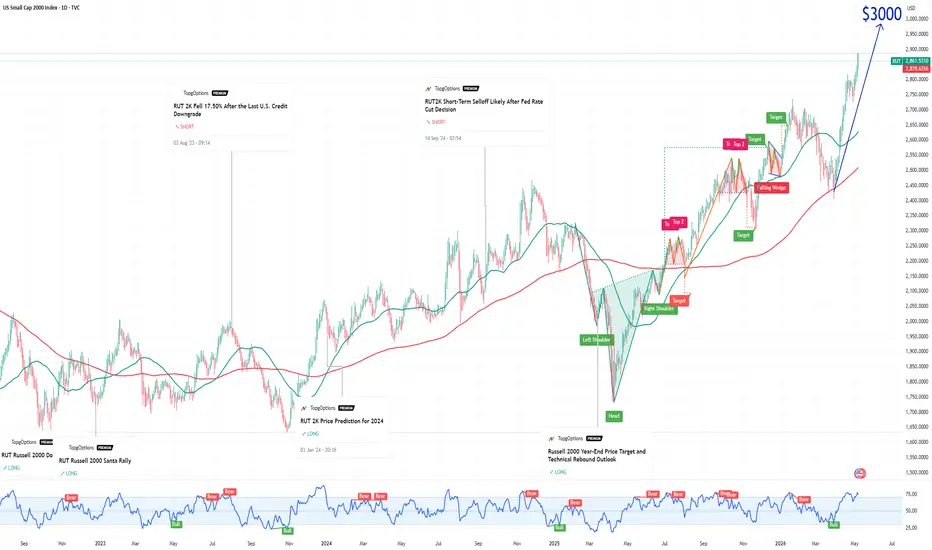
Russell 2000 Year-End Price TargetIf you haven`t bought the dip on RUT2K:
Hereโs the bull case scenario:
Strong technical momentum and breakout structure: RUT has broken out of a multi-year base near 2,000โ2,200 and is holding above key moving averages with repeated new highs in 2026.
Bullish gamma from options flow, seasonal small-cap strength, and a clean continuation above $2,850โ$2,900 resistance points to a steady grind toward the $3,000 psychological level
Macro tailwinds favoring small caps: Cooling inflation, resilient U.S. GDP growth (~2.6%), and the Fedโs accommodative stance (rate cuts already delivered and more expected) are creating a Goldilocks environment for high-beta small-cap stocks. Easier financial conditions, lower borrowing costs, and capital rotation out of mega-caps into domestic-focused small companies provide a powerful structural bid.
Superior earnings growth and valuation re-rating:
Small-cap earnings are forecast to grow 15โ19% in 2026 โ significantly outpacing large caps โ driven by improved cash flow, refinancing tailwinds, and domestic economic rebound.
Relative valuations remain attractive (P/E still below S&P 500), setting the stage for multiple expansion (Jefferies, Lazard, and 22V Research).
What serious analysts & outlets are saying:
Traders Union: Bullish 2026 forecast sees RUT reaching as high as 3,688 by year-end.
Jefferies: Year-end target of 2,825 (from earlier 2026) with 14%+ upside potential; analysts highlight 19% small-cap earnings growth.
MarketBeat / 22V Research: Technical breakout targets $3,200โ$3,250 (15%+ from current), with some scenarios calling for up to 40โ45% gains in a strong rotation.
Goldman Sachs: Baseline macro supports small-cap upside risk; 10%+ returns consistent with 2026 GDP and Fed outlook.
Technical breakout strength, supportive macro policy, accelerating small-cap earnings, attractive valuations, and widespread Wall Street targets above current levels make $3,000 a high-probability year-end level for the Russell 2000 in 2026.
Russel 2000 possible ABCD sell patternHi Guys.
The Russell 2000 has just completed an ABCD bearish pattern with sell entry at the current price. The pattern has nice metrics that are required for the ABCD to be succesful.
A to B is same as C to D... same length and duration of each is about one week apart.
BC is exactly 78.6 of AB
CD is at the 127% of BC
Good risk vs reward if one can find a nice entry at this level with a tight stop just above the highs.
Safe Trading all.
RUSSELL 2000: Bearish reversal if this Resistance holdsRussell 2000 / US2000 is facing again the Rising Resistance from 2024, which last time it was tested, caused a reversal to the 1day MA200.
In 2025 this actually caused an even stronger crash, below even the 1.5 Fibonacci extension.
For now, the Target is the 1day MA200 and the 0.5 Fibonacci at 2550.
Follow us, like the idea and leave a comment below!!
Small caps pushing it in this environmentYouโve got gasoline prices surging, Treasury yields pushing back towards prior highs, and STIR markets starting to price the risk of hikes from the Fed rather than cuts, yet US small caps are still sitting within cooee of record highs.
Earnings have held up, as they usually do relative to modest expectations, but for small caps the question is how long they can continue to ignore what is an increasingly unfriendly macro backdrop. These are companies far more exposed to the domestic cycle and far more reliant on external funding than larger companies.
At some point, that matters.
After repeated failures to break and hold above 2800 over the past fortnight, our Russell 2000 contract looks heavy.
Should the price remain beneath the prior record high of 2737 set in January this year, it can be used to build short setups around, allowing for entry beneath with a stop above for protection, targeting the uptrend running from the Liberation Day lows initially and, beyond that, the confluence of the 50 and 100-day moving averages, located today at 2608.
Given the remarkably resilient price action all things considered, some may prefer to hold off on entry until a clean break beneath the Liberation Day uptrend, given its proximity, should the unwind extend further.
Like the soggy price action, the oscillators are also rolling over, providing an early warning signal to bulls. RSI (14) has turned sharply lower after hitting overbought territory earlier this month, shifting back towards the neutral 50 level. MACD has also crossed the signal line from above and is rolling over, strengthening the cautious message.
The price looks heavy, momentum is shifting, and the macro backdrop is anything but peachy. The ducks look to be lining up, but itโs up to the price action to confirm.
Good luck!
DS