$WIF is missing one last thing to pumpMany coins are already showing setups ready for growth, but CRYPTOCAP:WIF is still lagging behind, and there are several reasons for that:
Below, there is still more liquidity than at the nearest level above. I expect another test of $0.1696 to collect the remaining liquidity before moving up.
CVD shows major absorption of longs by large players in short positions. Long positions are already heavily predominant, but they are being absorbed.
CMF confirms this and shows divergence with price.
dogwifhat sol / USDT
No trades
No trades
In-depth trading ideas
๏ปฟ$WIF Price Prediction 2026: Dogwifhat Crashed 97%, Is a 5xโ20x ?CRYPTOCAP:WIF Price Prediction 2026: Dogwifhat Crashed 97%, Is a 5xโ20x Rally Next? ๐
Dogwifhat ( CRYPTOCAP:WIF ) has corrected more than 97% from its March 2024 ATH of $4.86, and it is now up 50%+ from its recent bottom. The HTF chart shows a full distribution โ markdown โ accumulation cycle, and I expect the next leg to start soon.
WIF Technical Analysis:
โ
The Double Top at ATH led to a trendline breakdown and an HTF CHoCH.
โ
Three bearish BOS confirmed the markdown, with a -97.29% drawdow
WIF / USDT (BULLISH REVERSAL PATTERN)Technical Analysis โ Bullish Reversal Setup (4H Time Frame)
Price is currently in a downtrend, forming a series of lower highs (LHs) and lower lows (LLs). However, bullish divergence on the 4-hour RSI, combined with the formation of a falling wedge pattern, suggests a potential bullish reversal.
A breakout above the most recent lower-high (LH) level at 0.2272 could signal a shift in market structure and confirm bullish momentum.
Trade Setup
Entry: Buy-stop order at 0.2272, triggered upon a b
WIF Breakout or Another Bearish Rejection?WIF has been trading under a long-term descending trendline, reflecting persistent selling pressure and a broader bearish market structure.
๐ Lower Highs: Price has consistently formed lower highs, indicating that sellers have maintained control over the broader trend.
๐จ Consolidation Zone: Price has spent an extended period moving sideways within the 0.170โ0.205 USDT support zone. This area is an important region to monitor for potential accumulation and a change in market structure.
๐ข Poten
Another 100% move from WIFโฆ possible or...?Hi,
๐คฏ WIF IS FIGHTING BACK! After roughly 2 years of brutal downside and losing around 98% of its value, WIF has now surged nearly 90% in just one month through TWO major moves. ๐ฅ But now comes the real test: $0.25 is a serious resistance, and if WIF can break above it and HOLD, I think the next leg higher could be much bigger. ๐ฏ My first target: $0.31
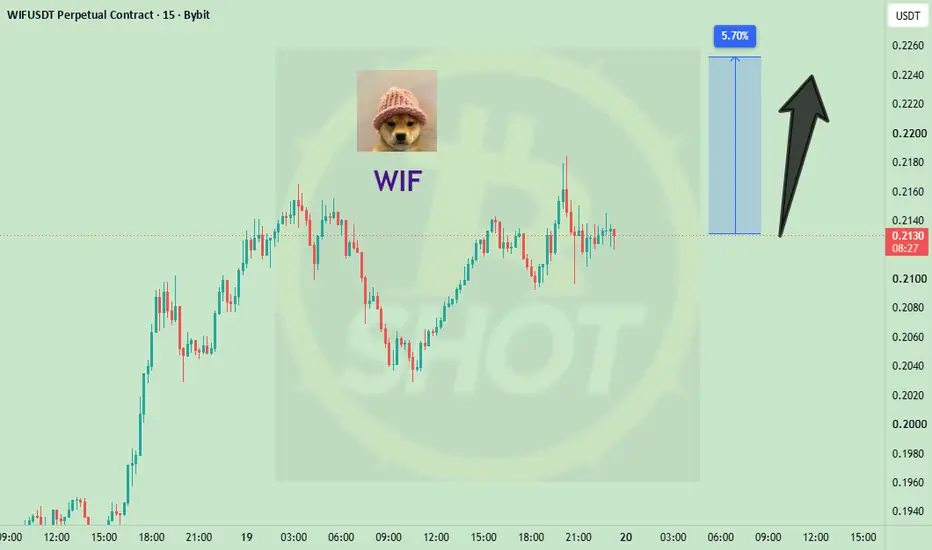
WIFUSDT Bulls Are Running Out of TimeYello, Paradisers! Are WIF bulls about to get trapped before the next sharp move lower? WIF is currently trading around $0.2133, and despite the recent intraday recovery, the broader structure is still giving us several reasons to remain cautious.
๐The most important area to watch is the 1H resistance around $0.2200โ$0.2220. Price has already shown repeated difficulty breaking through this zone, while the 1W, 1D, and 1H structures remain bearish. The 4H structure is still bullish, which means w
WIF memecoin with 30x potential?For a long time, CRYPTOCAP:WIF looked dead, but now itโs starting to show the first signs of life, while strongly outperforming many other memecoins in growth speed.
And considering how globally oversold it is, this memecoin has huge potential.
Hereโs what I see on the chart:
1๏ธโฃ CMF is showing the highest capital inflow in a year, which means big players have already started aggressively accumulating positions.
This is also confirmed by the Supply Zones indicator, which shows that a large
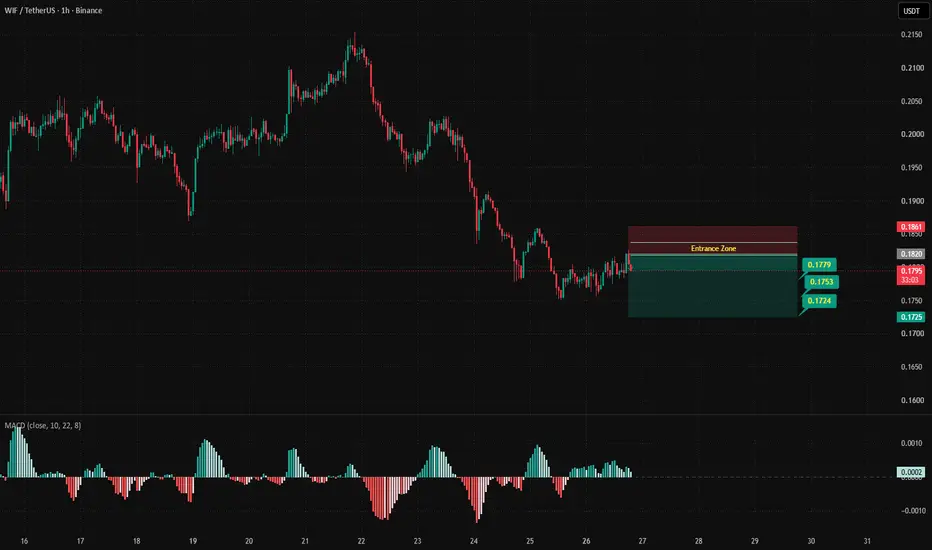
WIF/USDT H4: Bearish pressure๐ฏ TP1: $0.133625 (+1.82%) โ TP2: $0.131238 (+3.57%)
๐ SL: $0.140520 (-3.25%) โ R/R: 1 : 1.1
โ ๏ธ SL is placed beyond recent candle wicks to reduce the risk of accidental stop-outs.
FUNDAMENTAL BACKGROUND
WIF continues to show weakness amid a lack of project catalysts. The broader crypto market remains in a risk zone, which is particularly sensitive for meme coins. Tomorrow's Federal Reserve (FOMC) minutes may increase volatility, but the current cautious backdrop is already priced in. The Fear &
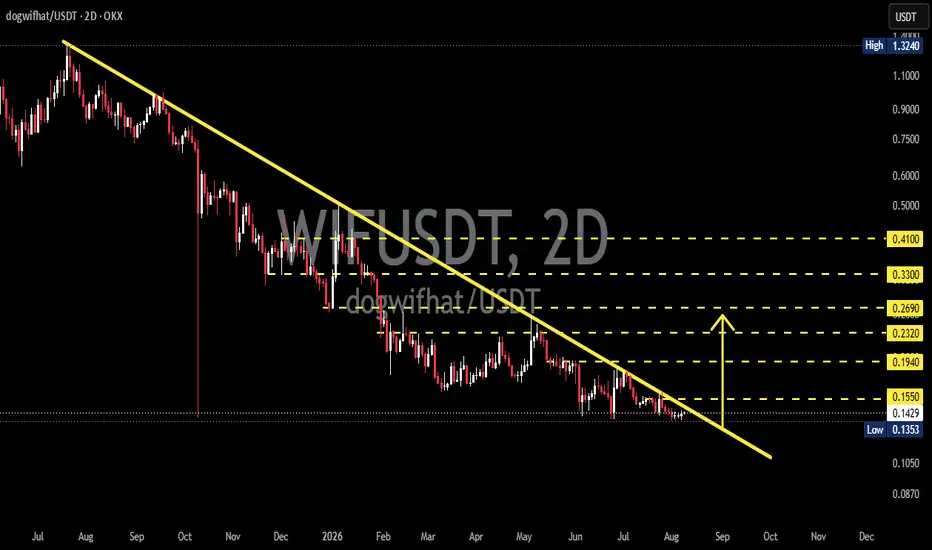
WIFUSDT Descending Trendline Under Pressure! Breakout Incoming?๐ TECHNICAL ANALYSIS ๐
๐ต Coin: CRYPTOCAP:WIF / #WIF ๐ถ
โ Time Frame: 2D โณ
๐ Pattern: Descending TrendLine ๐
๐ Current Structure: Bearish / Downtrend ๐ด๐ป
๐ฏ Potential Bullish Target: 0.1940 โก๏ธ 0.2320 โก๏ธ 0.2690 ๐
๐ฅ Major Resistance: 0.3300 โก๏ธ 0.4100 ๐งฑ๐
โโโโโโโโโโโโโโโโโโโโโโ
๐ป๐ DESCENDING TRENDLINE PATTERN ๐๐ป
๐ป The chart shows a Descending TrendLine that has formed since the major high around $1.32. ๐๐
๐ The yellow trendline ๐ก is acting as a dynamic resistance, continuously putting pressure on
WIF: liquidity sweep before the next leg downThe Macro Picture ๐บ๏ธ
WIF has been locked in a descending structure since the May $0.24 structural peak, grinding out lower highs and lower lows on the daily. The June flush to $0.14 set the macro floor, and while the bounce to $0.185 offered hope, it was sold aggressively โ a textbook lower high inside the broader downtrend. Price now sits at $0.16, rolling back over with RSI fading from 60 toward the midline. This is a market where every rally becomes supply, and the path of least resistance s
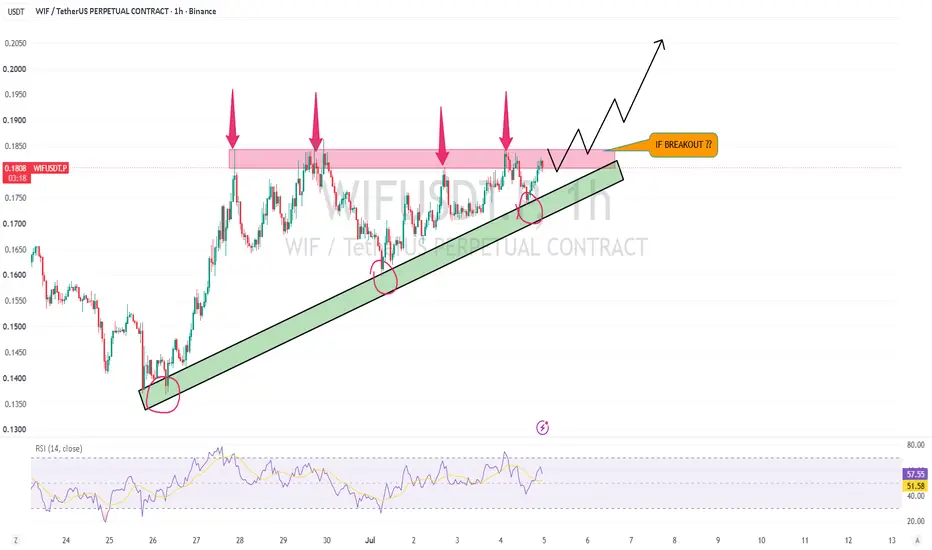
$WIF Is Trapped... But One Move Could Change Everything CRYPTOCAP:WIF Is Trapped... But One Move Could Change Everything ๐
Most traders are only watching the price.i'm watching the structure.
WIF has been respecting a rising trendline while repeatedly getting rejected from the same resistance zone. Every rally has stalled here, which tells us sellers are still defending this level.
Now price is getting squeezed between support and resistance.
A breakout above this resistance with strong volume could trigger a fresh bullish move and open the door
WIFUSDT - Descending Trendline, Breakout or Rejection?The WIF/USDT chart on the 2-Day (2D) timeframe remains in a well-defined downtrend structure. This is confirmed by a Descending Trendline connecting a series of Lower Highs from the market peak until now.
๐ฅ Interestingly, price has once again approached this Descending Trendline after spending several months consolidating near the lows. This makes the current price action extremely important, as it could determine the next major market direction.
---
๐ Technical Structure
๐ 1. Descending Tr
WIF Breaks Channel Resistance, Eyes Higher LevelsWIF has successfully broken above its long-standing falling wedge, signaling a notable shift in short-term market structure. After reclaiming the former resistance as support, buyers have maintained control and are now attempting to build momentum above the breakout zone.
Price is currently holding above the key Fibonacci retracement levels, with 0.1844 acting as the next major hurdle. A decisive move above this resistance could accelerate bullish momentum toward 0.1955 and potentially higher.
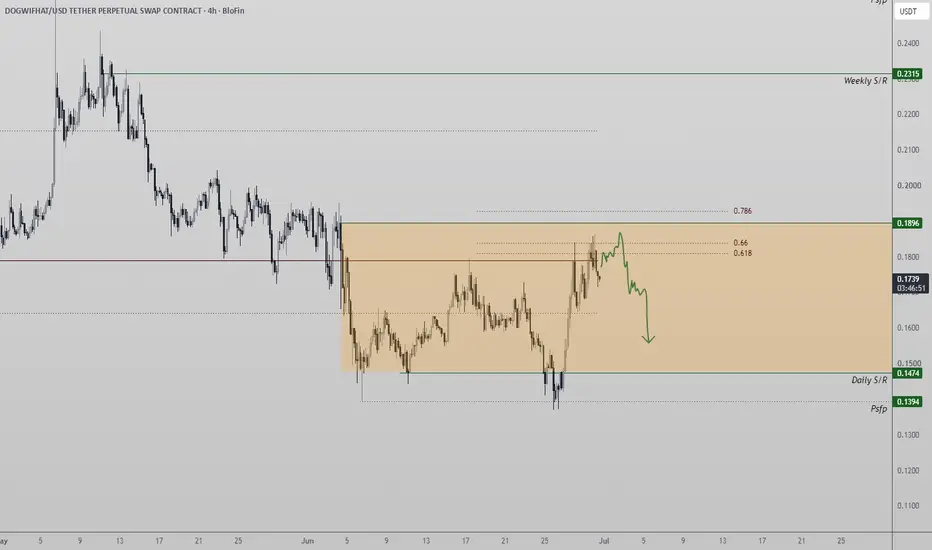
WIF Price Rejected at Key ResistanceDogwifhat (WIF) is currently trading beneath a major resistance confluence, with price rejecting from both the 0.618 Fibonacci retracement and a significant daily resistance level. This area represents an important decision point for the market, as it has historically attracted strong selling pressure.
The recent rally appears to be a corrective bounce from oversold conditions rather than the start of a new bullish trend. While buyers managed to recover price from support, they have so far been
WIFUSDT Forming Falling WedgeWIFUSDT is forming a clear falling wedge pattern, a classic bullish wave signal that often indicates an upcoming breakout. The price has been consolidating within a narrowing range, suggesting that selling pressure is weakening while buyers are beginning to regain control. With consistent volume confirming accumulation at lower levels, the setup hints at a potential bullish breakout soon. The projected move could lead to an impressive gain of around 70% to 80% once the price breaks above the wed
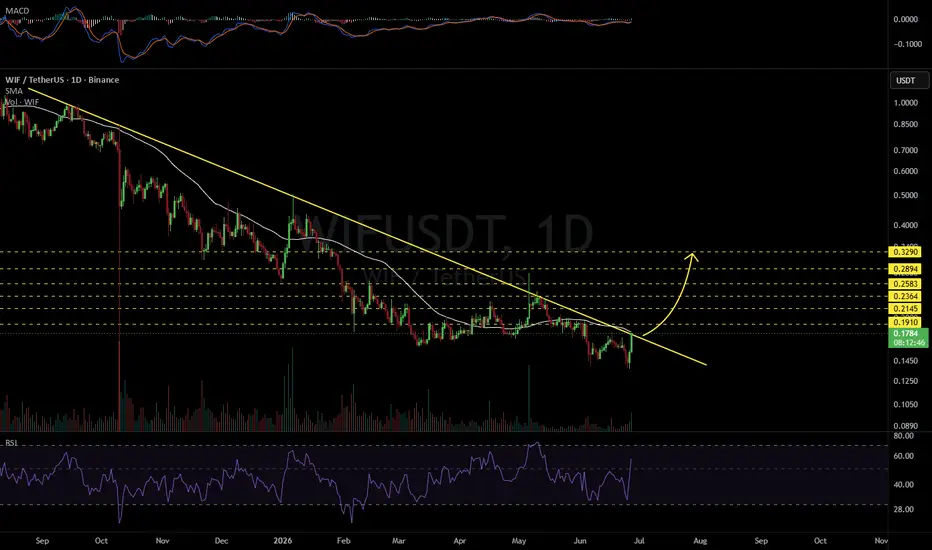
WIFUSDT 1D#WIF is on the verge of breaking out above the descending resistance and the daily SMA50. In case of a confirmed breakout, the potential upside targets are:
๐ฏ $0.1910
๐ฏ $0.2145
๐ฏ $0.2364
๐ฏ $0.2583
๐ฏ $0.2894
๐ฏ $0.3290
โ ๏ธ Always remember to use a tight stop-loss and maintain proper risk management.
WIFUSD Bulls Are Defending This Level Or Breake ??
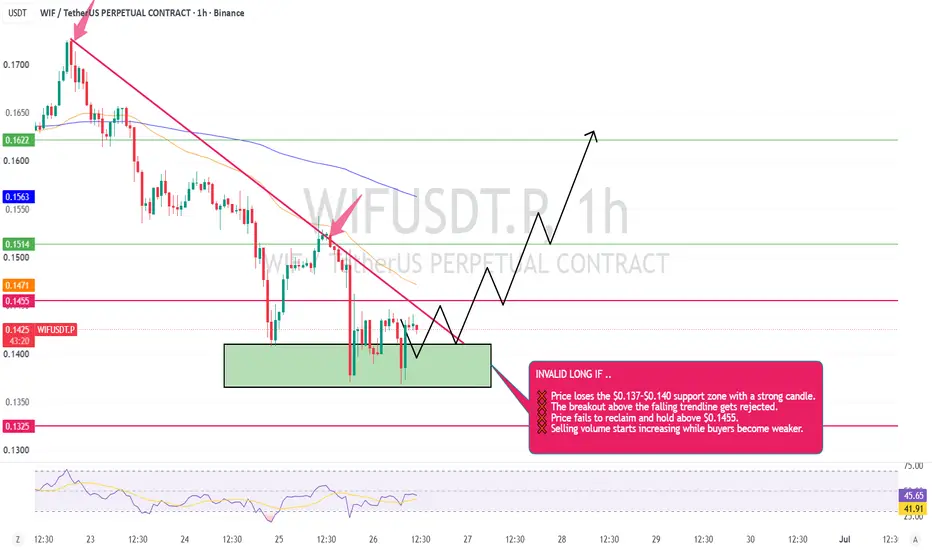
CRYPTOCAP:WIF is still holding the demand zone around $0.137โ$0.140, and sellers haven't been able to push it lower. That's a good sign for now.
If buyers can keep the momentum and break above the falling trendline, we could see WIF slowly move toward the next resistance levels. The main thing I'm watching is whether price can reclaim $0.1455 and stay above it. That would make the chart look much healthier.
I'm not rushing into a trade yet. I'd rather wait for confirmation than chase the p
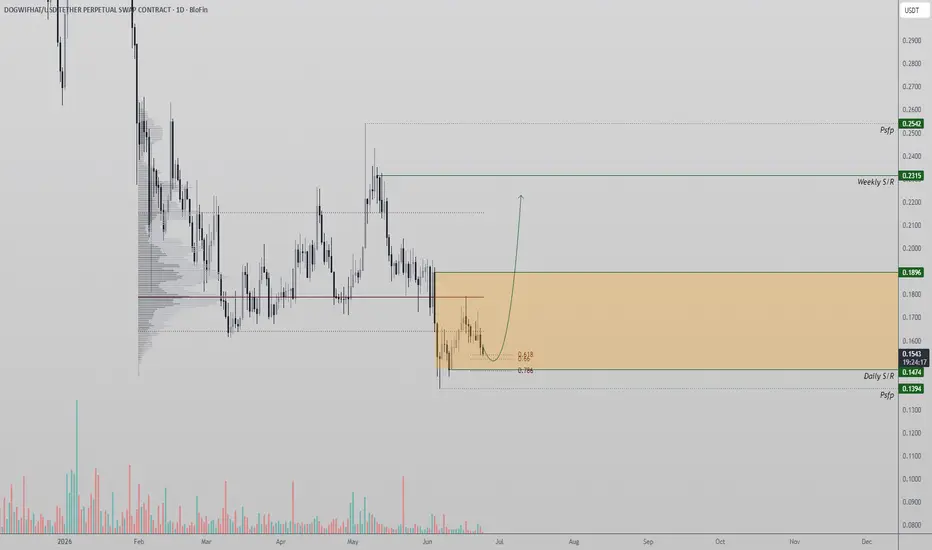
WIF At Support, Bounce Likely ?Dogwifhat (WIF) is currently trading at a highly significant technical level where multiple forms of support are converging. Price action has retraced into a key zone that combines the 0.618 Fibonacci retracement with an important daily support level, creating a strong area of technical confluence. These types of zones often attract buyers and can serve as the foundation for the next directional move.
The current setup places WIF in what many traders would consider a prime trade location. Rathe
WIFUSDT - Bear Flag, Breakdown or Reclaim?On the WIF/USDT 8-hour chart, price is currently trading within a ๐ฉ Bear Flag Pattern, a bearish continuation structure that formed after a sharp decline (๐ flagpole), followed by an upward consolidation phase inside an ascending channel ๐.
At the moment, price remains inside the rising channel but is starting to lose momentum after failing to sustain above a key resistance area โ ๏ธ. This structure suggests that the market is approaching a critical decision point between continuing the downtrend
WIF Setting Up for a Potential BottomWIF continues to follow a clear descending structure, printing consistent lower highs from, showing that sellers remain in control. Price is currently sitting near the 0.13 immediate support zone, and a breakdown below this level could push WIF toward the 0.065 projected drop target, which aligns with the next major liquidity area.
If price reaches this region, it could trigger a strong relief bounce, with potential upside back toward the 0.32โ0.40 resistance zone and possibly higher if momentu
WIF ACCUMULATION OVER | NOW BREAKING OUT๐ฅ Fortune AI Radar โ CRYPTOCAP:WIF
Fresh activity detected on CRYPTOCAP:WIF today.
Data suggests increasing market interest & buyers stepping in.
Technicals currently lean bullish, with momentum trending upward.
Whales showing hints of accumulation and hype rising among trader