WLD is still bearish (4H)From the point where we placed the red arrow on the chart, the bullish Wave F appears to have completed, and WLD has entered a bearish phase.
It looks like Waves A and B of this bearish phase have already finished, and the price is now moving into bearish Wave C.
The expectation is that the price will reject from the red supply zone and drop toward the targets marked on the chart.
Consider taking partial profits at the first target.
A daily candle close above the invalidation level will invalidate this analysis.
If you have a coin or altcoin you want analyzed, first hit the like button and then comment its name so I can review it for you.
Do you also think WLD is bullish?
In-depth trading ideas
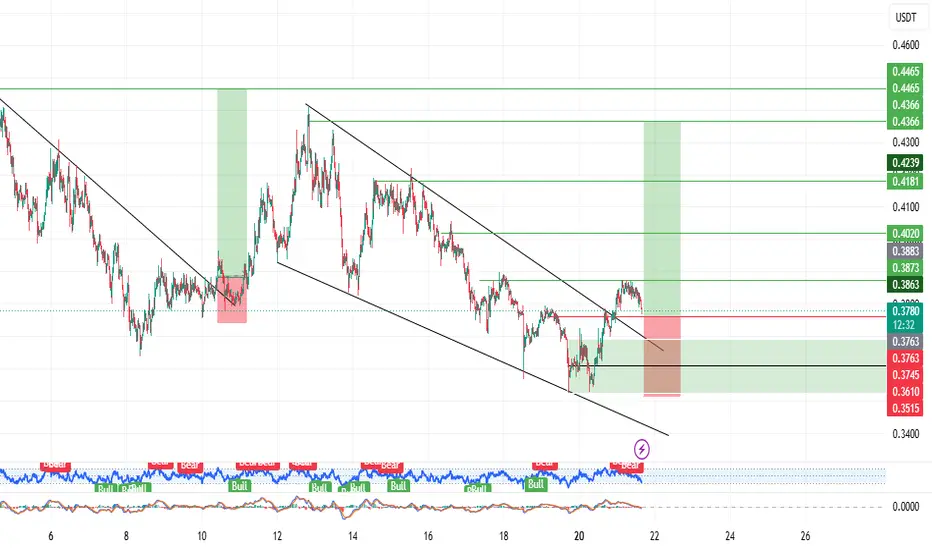
WLD USDT LONG SIGNAL#102 WLD/USDT – Trade Setup (LONG)
📈 Position Type: LONG
🕒 Timeframe: 1H
📊 Market: Futures
💰 Entry Zone:
0.3761
0.3610
🛑 Stop-Loss:
0.3515
🎯 Take-Profit Targets:
• TP1: 0.3874
• TP2: 0.4020
• TP3: 0.4180
• TP4: 0.4365
⚙️ Leverage:
5 *
▫️ After TP1, move SL to Entry + 0.2%.
▪️ Exit Plan:
• 40% at TP1
• 20% at TP2
• 20% at TP3
20% at. TP4
📌 Risk Management:
Risk only 1–2% of your capital per trade.
⚠️ Always check and confirm the setup on your chart before entering the trade.
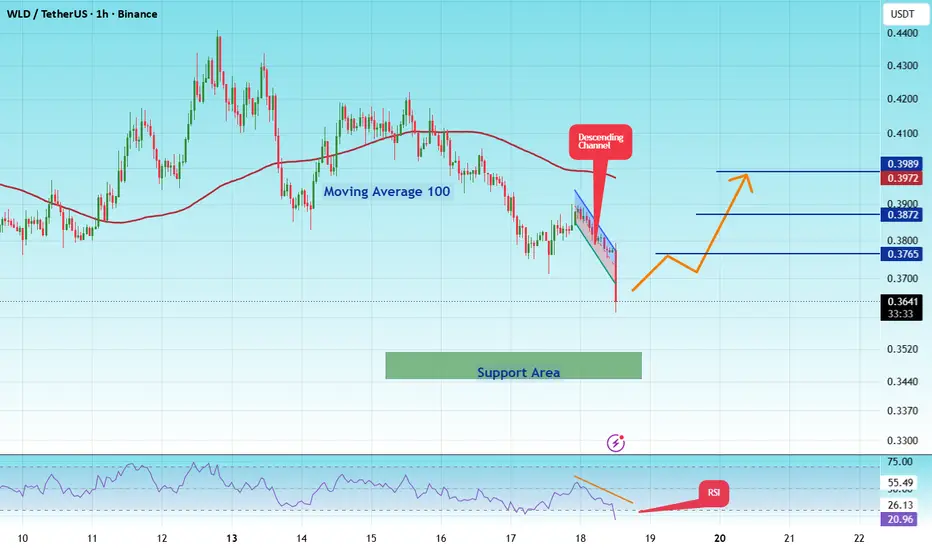
#WLDUSDT LONG SET UP ALERT !#WLD
The price is moving within a descending channel on the 1-hour timeframe and has reached the lower boundary. It is now poised for a bounce and is expected to retest this boundary.
The Relative Strength Index (RSI) indicates a downward trend, which is likely to continue given the overbought conditions.
A key support zone (in green) has been identified at 0.3444. The price has bounced off this zone several times, making it a strong support level.
The price is trending towards the 100-period moving average, which we are approaching. This trend supports an upward move.
Entry Price: 0.3644
First Target: 0.3872
Second Target: 0.3872
Third Target: 0.3989
You can close at the second target or wait for the third target. The choice is yours.
Stop Loss: At the resistance zone (in green).
Remember this simple rule: Money Management.
Any questions? Please leave a comment.
Thank you.
WLD: Compression at Higher-Timeframe Support
⚛️WLD is setting up at an important decision area after a sustained pullback from the June highs.
On the Daily, price is testing the lower boundary of the broader ascending channel while compressing inside a falling wedge. This area also sits around prior structural support near $0.35, as well as the VAL from the start of the impulse. The wedge has tightened into the channel floor, giving price a clear location where buyers need to step in if the larger bullish structure is going to remain intact.
On the 1H, WLD has been in a controlled decline, but it is now stretched into that Daily confluence area. Price is attempting to stabilize after the selloff, with the first signs of compression forming at the lows. This is not a confirmed reversal yet, but it is the type of location where I want to watch for one.
On the 5m, price is forming a tight triangle just above prior-day VAH around $0.3467. The local structure is coiling between higher lows and descending resistance. A clean break and acceptance above the upper trendline would be the confirmation for a relief move, especially if price can reclaim the nearby $0.3487 to $0.3491 area.
The bullish scenario is simple: hold the $0.346 area, break the 1H compression with participation, then reclaim the local value area. That would open room back toward $0.355, followed by the 1H EMA cluster and the larger descending-channel resistance near $0.387.
The failure scenario matters more. If WLD loses the triangle lows and accepts below the Daily channel floor, this becomes a breakdown setup, not a reversal attempt. Below there, the next meaningful support is closer to the recent low around $0.338.
Location is good. Compression is building. Now price needs to confirm.
Not a signal. Just how I’m reading structure and participation.
wldusdt longInstructions:
Entry point: yellow
Stop loss: red
Take profit: green
👉Leverage x 5-10-20 for crypto
👉Leverage x 20-50-100 for commodities, stocks, indices, and forex
👉Margin 1-5% max.
Always practice risk and money management.
Invest a maximum of 5% on any trade or across all your trades.
Invest only what you can afford to lose, as no one is in control of the market.
👉Our analyses are primarily based on:
breakouts: two trend lines (ascending and descending) and a line indicating a horizontal breakout.
chart patterns: shoulders and head, triangle parttern, elliott impulse, etc etc.
We don't always have the time to track them at all times or to represent them visibly, given the numerous signals, the number of channels to manage, and especially because of the often rapid pace of market movements.
indicators: We associate at least two indicators with this technique.
👉Depending on the circumstances, we use specific indicators, often setting 3 or more take profit levels.
👉Indeed, there are good days in trading and also bad days. No one can promise to win every trade, and like all traders worldwide, we also experience stop-loss orders. However, we win more than we lose and remain positive.
👉You can close the position before or after the take profit orders indicated by the green lines if you are personally satisfied; the same applies to stop loss orders.
👉We must stay positive, clear-headed, and humble.
we cannot provide all instructions or all trades here on this channel.
Good luck to us all, and may God guide us. Amen.
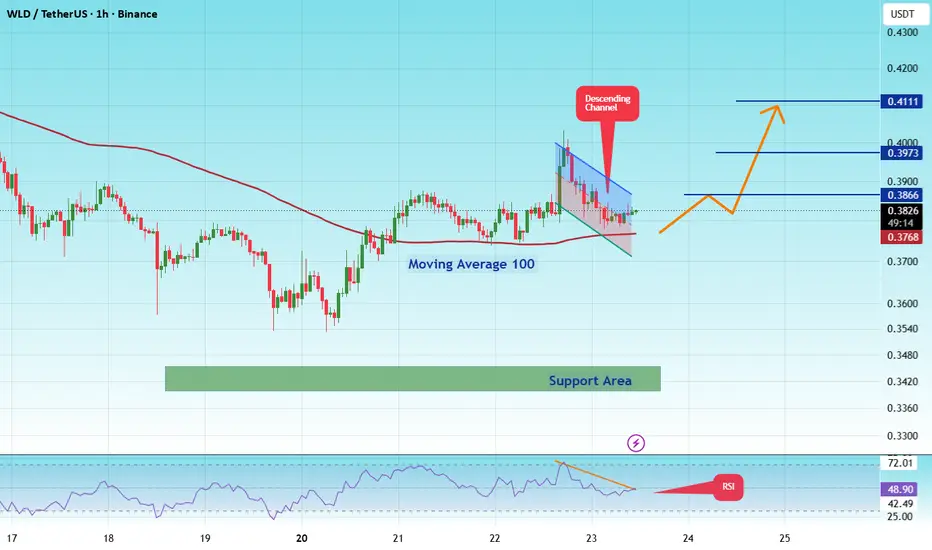
#WLDUSDT LONG SET UP ALERT !#WLD
The price is moving within a descending channel on the 1-hour timeframe and has reached the lower boundary. It is now poised for a bounce and is expected to retest this boundary.
The Relative Strength Index (RSI) indicates a downward trend, which is likely to continue given the overbought conditions.
A key support zone (in green) has been identified at 0.3400. The price has bounced off this zone several times, making it a strong support level.
The price is trending towards the 100-period moving average, which we are approaching. This trend supports an upward move.
Entry Price: 0.3824
Target 1: 0.3866
Target 2: 0.3973
Target 3: 0.4111
You can close at the second target or wait for the third target. The choice is yours.
Stop Loss: At the resistance zone (in green).
Remember this simple rule: Money Management.
Any questions? Please leave a comment.
Thank you.
#WLDUSDT LONG SET UP ALERT !#WLD
The price is moving within a descending channel on the 1-hour timeframe and has reached the lower boundary. It is now poised for a bounce and is expected to retest this boundary.
The Relative Strength Index (RSI) indicates a downward trend, which is likely to continue given the overbought conditions.
There is a key support zone in green at 0.3130, and the price has bounced off this zone several times, making it a strong support level.
The price is trending towards the 100-period moving average, which we are approaching. This trend supports an upward move.
Entry Price: 0.3358
Target 1: 0.3420
Target 2: 0.3500
Target 3: 0.3600
Stop Loss: At the resistance zone in green
Remember this simple rule: Money management.
Any questions? Please leave a comment.
Thank you.
WLD USDT LONG SIGNAL#120. WLD/USDT – Trade Setup (LONG)
📈 Position Type: LONG
🕒 Timeframe: 1H
📊 Market: Futures
💰 Entry Zone:
0.3437
🛑 Stop-Loss:
0.3350
🎯 Take-Profit Targets:
• TP1: 0.3510
• TP2: 0.36
• TP3: 0.37
• TP4: 0.06341
⚙️ Leverage:
5 *10
▫️ After TP1, move SL to Entry + 0.2%.
▪️ Exit Plan:
• 50% at TP1
• 25% at TP2
• 25% at TP3
📌 Risk Management:
Risk only 1–2% of your capital per trade.
⚠️ Always check and confirm the setup on your chart before entering the trade.
WLD - Demand Zone in FocusWLD is approaching a strong demand zone marked in blue, an area where buyers previously stepped in and triggered a strong bullish impulsive move. 📊
📌 As long as this demand zone continues to hold, we will be looking for long setups, anticipating the end of the current correction phase and a continuation of the broader bullish trend.
Moreover, for the bulls to take full control and begin the next major bullish impulse, a decisive break above the last major high marked in red is needed. Such a breakout would confirm renewed bullish momentum and increase the probability of a continuation toward higher prices.
As always, rather than buying blindly into support or anticipating the breakout, we will wait for bullish confirmation before considering any long positions.
Will buyers defend this demand zone and push WLD toward a fresh breakout? 🤔
⚠️ Disclaimer: This is not financial advice. Always do your own research and manage risk properly.
📚 Stick to your trading plan regarding entries, risk, and management.
Good luck! 🍀
All Strategies Are Good; If Managed Properly!
~Richard Nasr
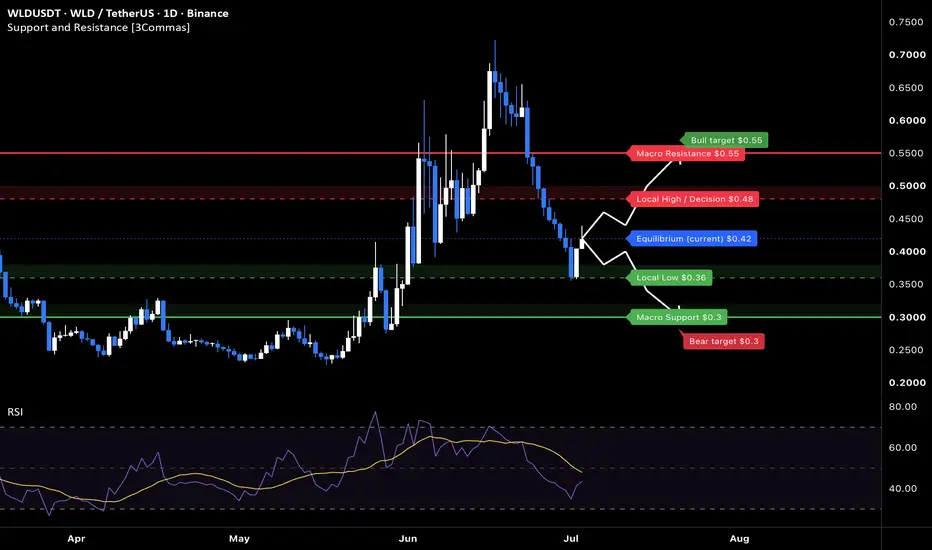
WLD: local squeeze with $0.36 destinationThe Macro Picture 🗺️
WLD ran a parabolic move from $0.24 to the mid-June $0.72 structural peak — the kind of vertical extension that demands a deep correction once momentum fades. That reset arrived fast: price sliced roughly 50% off the top back to $0.36 by early July, carving a sequence of lower highs on the way down. The recovery attempts have been shallow, and RSI remains pinned below its moving average near 47. Price now sits at $0.42, and until the structure of lower highs breaks, the path of least resistance still points back toward the floor.
The Setup ⚙️
The Ceiling: The $0.45 decision line is the level bears are defending. As marked by the red projection, this is where the last bounce stalled, and it caps the local range from above.
The Rejection: The $0.45–0.55 band is a thick supply block left behind by the collapse. Price would need to reclaim this entire zone to neutralize the correction, and momentum offers no support for that case yet.
The Trigger: A break below $0.38 local support would open the path of least resistance, exposing the $0.36 macro floor to a retest as the correction completes its measured move.
The Roadmap: Primary target sits at $0.36 — the red projection points there as the natural draw for the post-parabolic unwind. Invalidation: a sustained 4H close back above $0.45 would invalidate this bearish thesis and signal buyers have reclaimed control.
More setups in profile.
#WLD #CRYPTO #Worldcoin #Altcoins #TechnicalAnalysis
longInstructions:
Entry point: yellow
Stop loss: red
Take profit: green
👉Leverage x 5-10-20 for crypto
👉Leverage x 20-50-100 for commodities, stocks, indices, and forex
👉Margin 1-5% max.
Always practice risk and money management.
Invest a maximum of 5% on any trade or across all your trades.
Invest only what you can afford to lose, as no one is in control of the market.
👉Our analyses are primarily based on:
breakouts: two trend lines (ascending and descending) and a line indicating a horizontal breakout.
chart patterns: shoulders and head, triangle parttern, elliott impulse, etc etc.
We don't always have the time to track them at all times or to represent them visibly, given the numerous signals, the number of channels to manage, and especially because of the often rapid pace of market movements.
indicators: We associate at least two indicators with this technique.
👉Depending on the circumstances, we use specific indicators, often setting 3 or more take profit levels.
👉Indeed, there are good days in trading and also bad days. No one can promise to win every trade, and like all traders worldwide, we also experience stop-loss orders. However, we win more than we lose and remain positive.
👉You can close the position before or after the take profit orders indicated by the green lines if you are personally satisfied; the same applies to stop loss orders.
👉We must stay positive, clear-headed, and humble.
we cannot provide all instructions or all trades here on this channel.
Good luck to us all, and may God guide us. Amen.
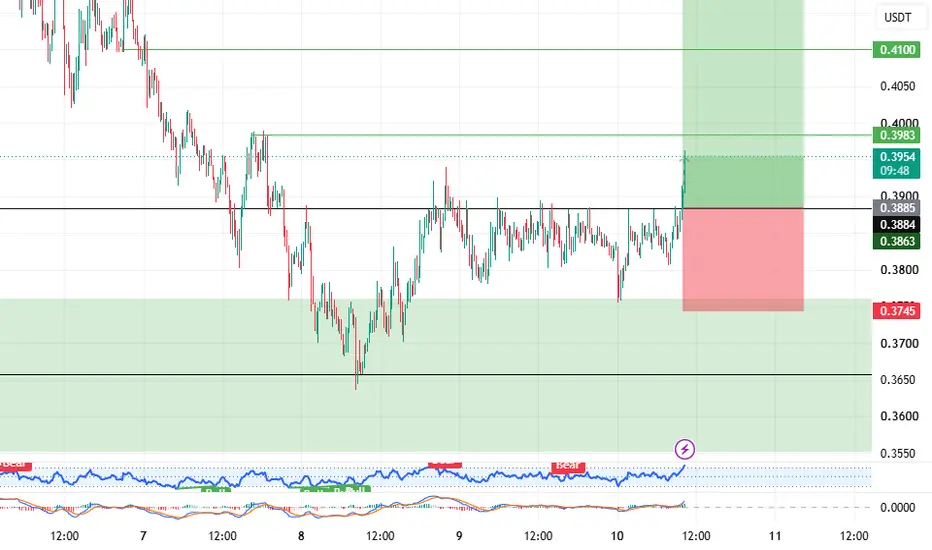
WLD USDT LONG SIGNAL#37. WLD/USDT – Trade Setup (LONG)
📈 Position Type: LONG
🕒 Timeframe: 1 H
📊 Market: Futures
💰 Entry Zone:
0.3886
🛑 Stop-Loss:
0.3745
🎯 Take-Profit Targets:
• TP1: 0.3983
• TP2: 0.41
• TP3: 0.4237
• TP4: 0.4358
TP5: 0.4465
TP6:
⚙️ Leverage:
5- 10
⚠️ After reaching TP1, move Stop-Loss to Entry Price.
📌 Risk Management:
Risk only 1–2% of your capital per trade.
Always confirm the setup on your chart before entry
WLD - Correction Phase Nearing Its End?WLD appears to be approaching the end of its current correction phase after pulling back from its recent impulsive rally. 📉
Price is now approaching a major support confluence, formed by:
• The demand zone marked in blue.
• The previous accumulation area.
• The 0.786 Fibonacci retracement.
📌 As long as this demand zone holds as support, we will be looking for long setups, anticipating the start of the next bullish impulse.
As always, rather than buying blindly into support, we will wait for bullish confirmation before considering any long positions.
Will buyers defend this demand zone and bring the correction phase to an end? 🤔
⚠️ Disclaimer: This is not financial advice. Always do your own research and manage risk properly.
📚 Stick to your trading plan regarding entries, risk, and management.
Good luck! 🍀
All Strategies Are Good; If Managed Properly!
~Richard Nasr
#WLDUSDT#WLD
The price is moving within a descending channel on the 1-hour timeframe and has reached the lower boundary. It is now poised for a bounce and is expected to retest this boundary.
The Relative Strength Index (RSI) indicates a downward trend, which is likely to continue given the overbought conditions.
There is a key support zone (in green) at 0.3514, and the price has bounced off this zone several times, making it a strong support level.
The price is trending towards the 100-period moving average, which we are approaching. This trend supports an upward move.
Entry Price: 0.4160
Target 1: 0.4352
Target 2: 0.4526
Target 3: 0.4762
Stop Loss: At the resistance zone (in green)
Remember this simple rule: Money Management.
Any questions? Please leave a comment.
Thank you.
A Wild short in WLDHello Traders!
This will be a beautiful short in WLD as we are entering in middle of a bearish trend with small stoploss.
WLD is inside a channel and it has reacted at the resistive trendline of the channel and now it is heading towards downside. There are multiple bearish confirmations in WLD
We are entering in WLD from 0.4157
Stoploss 0.4319 (-3.9%)
Target 0.376(+9.5%)
My goal is to be recognized as one of the highest win-rate traders in the TradingView community. :)
Trade Analysis Based on
> Fibonacci Tool (A1000x Way) – Custom Fibonacci approach for precise market analysis
> Candlestick Patterns – Strong price action confirmation through key candle formations
> A1000x Breakout Strategy – Identifying and trading high-probability breakout setups
> HH, HL & LH, LL Strategy – Market structure analysis for clear trend direction
> Swing Points – Tracking key highs and lows for accurate price movement insight
> A1000x Stoploss Strategy – Strategic stoploss placement for effective risk control
> A1000x Target Strategy – Structured target setting based on price action
We trade using carefully developed strategies and disciplined market analysis, always seeking the best possible accuracy while remembering that ultimate success comes only by the will of Allah.
In some trades, you may notice a relatively larger stop loss or a risk-to-reward ratio that may appear unusual at first glance. However, every trade is taken with proper planning and calculated analysis, not random entries.
Before entering any position, we perform detailed calculations and market evaluation. Based on this analysis, we carefully determine our stop loss and target levels.
I personally apply one of my specialized stop-loss and target strategies, designed to place the stop loss at a logical market level where price is less likely to reach before moving toward the intended target — InshaAllah.
Trading always involves risk, but with discipline, patience, and proper strategy, we aim for consistent and responsible decision-making.
Feel free to share your thoughts, leave a comment, or contact me.
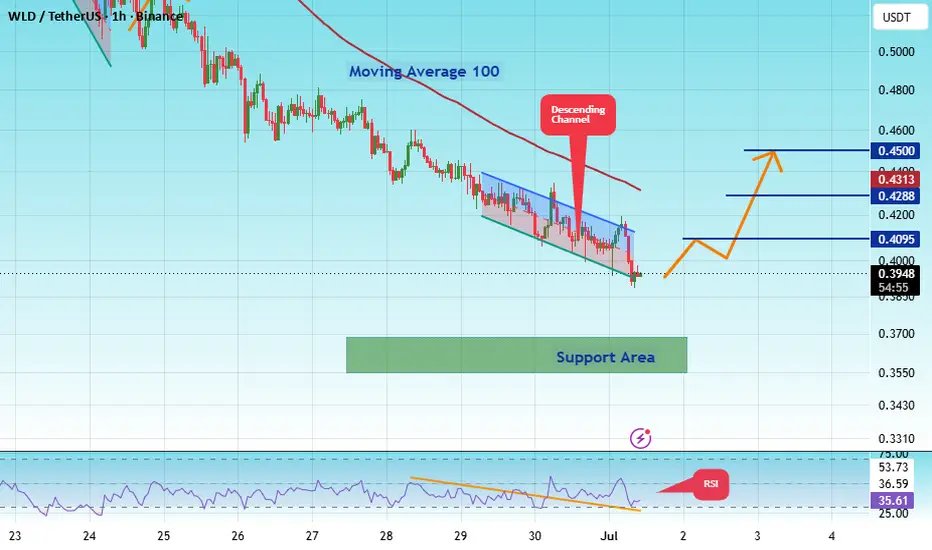
#WLDUSDT LONG SET UP ALERT !#WLD
The price is moving within a descending channel on the 1-hour timeframe and has reached the lower boundary. It is now poised for a bounce and is expected to retest this boundary.
The Relative Strength Index (RSI) indicates a downward trend, which is likely to continue given the overbought conditions.
There is a key support zone (in green) at 0.3563, and the price has bounced off this zone several times, making it a strong support level.
The price is trending towards the 100-period moving average, which we are approaching. This trend supports an upward move.
Entry Price: 0.3942
First Target: 0.4095
Second Target: 0.4288
Third Target: 0.4500
Stop Loss: At the resistance zone (in green)
Remember this simple rule: Money Management.
Any questions? Please leave a comment.
Thank you.
WLDUSDT Forming Bullish MomentumWLDUSDT is forming a clear bullish momentum pattern, a classic bullish wave signal that often indicates an upcoming breakout. The price has been consolidating within a narrowing range, suggesting that selling pressure is weakening while buyers are beginning to regain control. With consistent volume confirming accumulation at lower levels, the setup hints at a potential bullish breakout soon. The projected move could lead to an impressive gain of around 90% to 100% once the price breaks above the key resistance zone.
This bullish momentum pattern is typically seen at the end of downtrends or corrective phases, and it represents a potential shift in market sentiment from bearish to bullish. Traders closely watching WLDUSDT are noting the strengthening momentum as it approaches a critical breakout area. Good trading volume adds confidence to this setup, showing that market participants are positioning early in anticipation of a sustained upward move.
Investors’ growing interest in WLDUSDT reflects rising confidence in the project's long-term fundamentals and current technical strength. If the breakout confirms with sustained buying volume, this could mark the beginning of a fresh bullish leg. The current consolidation phase suggests that buyers are steadily accumulating positions while bearish momentum continues to weaken, increasing the probability of a strong upward expansion.
Traders might find this a valuable setup for medium-term gains, especially as the bullish momentum pattern nears completion and buying pressure continues to build. A confirmed breakout above resistance could attract additional market participation and potentially drive the price toward its projected upside target over the coming weeks.
✅ Show your support by hitting the like button!
✅ Leave a comment below! (What is your opinion about this coin?)
Your feedback and engagement keep me inspired to share more insightful market analysis with you!
WLD: deep pullback into the $0.42 decisionThe Macro Picture 🗺️
WLD staged one of the sharpest runs of the quarter, exploding off a $0.24–$0.30 base to a $0.72 structural peak in mid-June before gravity took over. The retrace has been just as violent — price has surrendered roughly half the entire move to sit at $0.42, with RSI cooling to a neutral 44. A move this size demands a deep correction, and now the market is deciding whether $0.42 is the shelf that holds or just a pause on the way back to the base.
The Setup ⚙️
The Reaction: Price is printing a first bounce off the $0.36 pullback low, but the recovery is tentative — RSI sitting mid-range rather than surging. Buyers are testing the water here, and the strength of the next few closes decides whether the correction is done or has another leg.
The Accumulation Zone: A deeper flush toward the $0.30–$0.32 pre-rally base opens a textbook pocket for staggered, averaging-based entries — the exact platform the June rally launched from, where patient exposure lines up with a full retest of the origin.
The Roadmap: Reclaiming the $0.48 decision reopens the path toward the $0.55 macro resistance, where the green roadmap points. Invalidation: a sustained 1D close below $0.36 would drop price toward the $0.30 macro support and the base beneath it.
Worldcoin (WLD) Breakdown Setup: Price Trading Below Key SupportAfter a 26% downside move from our previous analysis, Worldcoin is now trading below a key support level.
We believe that if the price fails to reclaim this support and fresh geopolitical headlines trigger another wave of selling, the breakdown could extend toward the next major support zone.
Based on our analysis, this remains one of the cleaner short setups if overall risk sentiment weakens again.
Trade Levels:
Entry: $0.43 – $0.45
Take Profit: $0.39, $0.33
Stop Loss: $0.48
WLDUSD UPDATEEURONEXT:WLD is sitting at an interesting level, but that doesn't mean it's a good long yet.
One of the biggest mistakes traders make is entering just because price looks "cheap." A low price is not a confirmation.
For me, a long only becomes valid after the market proves buyers are taking control.
✅ Break above resistance with a strong candle.
✅ Volume increases on the breakout.
✅ Price holds the breakout level after a retest.
✅ Market structure shifts from lower highs to higher highs.
If those confirmations don't appear, I'm staying out.
Remember, missing a trade is always better than forcing one. There will always be another setup, but protecting your capital comes first.