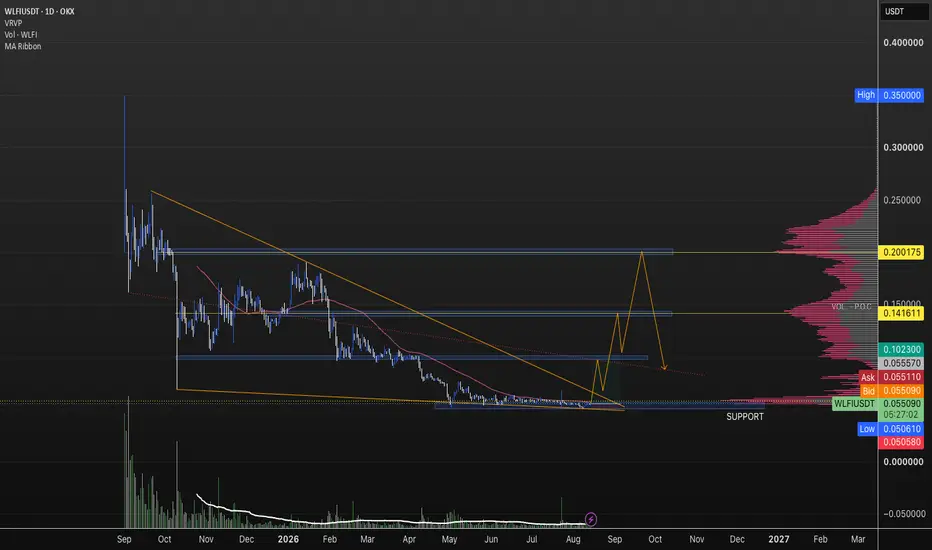
WLFI/USDT (4h) Compressing Inside a Descending TriangleWLFI/USDT is consolidating inside a descending triangle on the 4H chart, with price forming a clear sequence of lower highs beneath descending resistance while repeatedly testing the support zone around $0.0560–$0.0565.
The support has already been tested several times, while each rebound remains w
WLFI: Downward Target ReachedWLFI: Downward Target Reached – Patience Strategy Awaiting Relief Bounce for Optimal Short Entries
WLFI is unfolding precisely in accordance with our prior technical roadmap, delivering an impressive 2R profit margin for traders who caught the move. Observing the H4 technical structure from the vi
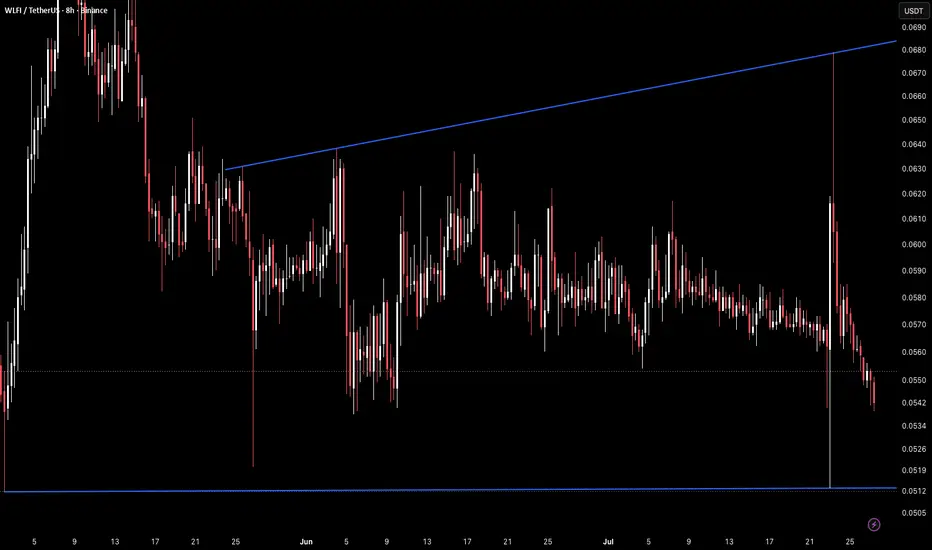
WLFI 8H – Sharp Drop Into Macro Support and Rising TrendlineWLFI on the 8H timeframe is currently trading around 0.0542 after a sharp spike down on July 22 that pierced through the 0.0542–0.0546 horizontal support and briefly touched the macro horizontal floor near 0.0512–0.0515 before recovering, with price now sitting directly on the key support zone as th
WLFI: Lower-High Compression CompletedWLFI: Lower-High Compression Completed – Optimal Trend-Following Short Setup
WLFI is flashing highly definitive technical signals indicating the continuation of its broader macro downtrend. Following a relatively steep technical rebound from its third retest of the $0.05 psychological round number
WLFI/USDT (1d) This would be a powerful move WLFI/USDT is compressing inside a symmetrical triangle on the daily chart, with price trading near the apex and volatility narrowing.
A confirmed breakout above the descending resistance could open the way toward 0.0866 USDT. A breakdown below the rising support would invalidate the bullish scenari
WLFI 8H – Triangle Breakout Attempt at Upper TrendlineWLFI on the 8H timeframe is currently trading around 0.0616 after the symmetrical triangle that had compressed price into its apex has now broken to the upside, with price pushing through the descending upper trendline and pressing directly into the 0.0600–0.0610 resistance zone for the first confir
WLFI/USDT (1h) Near the Apex of a Symmetrical TriangleWLFI/USDT is consolidating inside a large symmetrical triangle on the 1H chart, with price approaching the apex and testing the descending resistance.
A confirmed breakout above the upper trendline could trigger a bullish expansion toward higher resistance levels. A rejection followed by a break be
WLFI 1D – Triangle Apex Reached, Breakout ImminentWLFI on the 1D timeframe is currently trading around 0.0806 after spending over two months compressing inside a symmetrical triangle, with the descending upper trendline and rising lower trendline now meeting almost exactly at current price as the structure reaches its apex.
The chart shows the sam
WLFI 1D – Symmetrical Triangle Compression at ApexWLFI on the 1D timeframe is currently trading around 0.0806 after consolidating inside a symmetrical triangle since the April low near 0.0513, with the two converging trendlines now squeezing price into the apex as the structure approaches a breakout in either direction.
The chart shows a symmetric
See all ideas
Summarizing what the indicators are suggesting.
Oscillators
Neutral
Oscillators
Neutral
Summary
Neutral
Summary
Neutral
Summary
Neutral
Moving Averages
Neutral
Moving Averages
Neutral
Displays a symbol's price movements over previous years to identify recurring trends.