WLFI/USDT (4h) Compressing Inside a Descending TriangleWLFI/USDT is consolidating inside a descending triangle on the 4H chart, with price forming a clear sequence of lower highs beneath descending resistance while repeatedly testing the support zone around $0.0560–$0.0565.
The support has already been tested several times, while each rebound remains weaker, which gradually increases bearish pressure on the lower boundary. A confirmed breakdown below $0.0560 would strengthen the bearish continuation scenario.
On the other hand, a breakout above th
In-depth trading ideas
WLFI: Downward Target ReachedWLFI: Downward Target Reached – Patience Strategy Awaiting Relief Bounce for Optimal Short Entries
WLFI is unfolding precisely in accordance with our prior technical roadmap, delivering an impressive 2R profit margin for traders who caught the move. Observing the H4 technical structure from the visual data in , the price action is locked completely underneath the dynamic MA100 trendline, confirming that bears maintain absolute control over the market framework.
However, with the price action
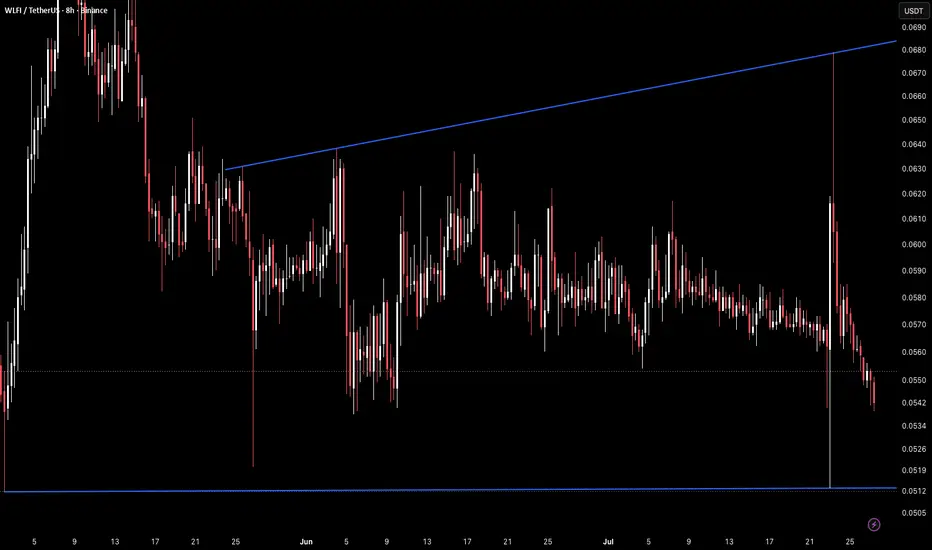
WLFI 8H – Sharp Drop Into Macro Support and Rising TrendlineWLFI on the 8H timeframe is currently trading around 0.0542 after a sharp spike down on July 22 that pierced through the 0.0542–0.0546 horizontal support and briefly touched the macro horizontal floor near 0.0512–0.0515 before recovering, with price now sitting directly on the key support zone as the rising trendline climbs into the 0.0680 area far above.
The chart shows a rising trendline originating from the May low near 0.0512, connecting the June recovery high near 0.0636 and continuing to
WLFI: Lower-High Compression CompletedWLFI: Lower-High Compression Completed – Optimal Trend-Following Short Setup
WLFI is flashing highly definitive technical signals indicating the continuation of its broader macro downtrend. Following a relatively steep technical rebound from its third retest of the $0.05 psychological round number support floor (bottom 3), the price action established its next local peak at the $0.068 area (top 3). This price behavior officially confirms the completion of a textbook lower-high compression patt
WLFI/USDT (1d) This would be a powerful move WLFI/USDT is compressing inside a symmetrical triangle on the daily chart, with price trading near the apex and volatility narrowing.
A confirmed breakout above the descending resistance could open the way toward 0.0866 USDT. A breakdown below the rising support would invalidate the bullish scenario and could expose the 0.0374 USDT area.
WLFI 8H – Triangle Breakout Attempt at Upper TrendlineWLFI on the 8H timeframe is currently trading around 0.0616 after the symmetrical triangle that had compressed price into its apex has now broken to the upside, with price pushing through the descending upper trendline and pressing directly into the 0.0600–0.0610 resistance zone for the first confirmed test above the structure.
The chart shows the same symmetrical triangle visible across the prior two ideas on this coin, with the descending upper trendline now clearly being tested from above fo
WLFI/USDT (1h) Near the Apex of a Symmetrical TriangleWLFI/USDT is consolidating inside a large symmetrical triangle on the 1H chart, with price approaching the apex and testing the descending resistance.
A confirmed breakout above the upper trendline could trigger a bullish expansion toward higher resistance levels. A rejection followed by a break below the ascending support would favor bearish continuation. Volume confirmation is important before entering either direction.
WLFI 1D – Triangle Apex Reached, Breakout ImminentWLFI on the 1D timeframe is currently trading around 0.0806 after spending over two months compressing inside a symmetrical triangle, with the descending upper trendline and rising lower trendline now meeting almost exactly at current price as the structure reaches its apex.
The chart shows the same symmetrical triangle covered in the prior idea, with the descending upper trendline from the April high near 0.0840 and the rising lower trendline from the May low near 0.0513 having converged to wi
WLFI 1D – Symmetrical Triangle Compression at ApexWLFI on the 1D timeframe is currently trading around 0.0806 after consolidating inside a symmetrical triangle since the April low near 0.0513, with the two converging trendlines now squeezing price into the apex as the structure approaches a breakout in either direction.
The chart shows a symmetrical triangle formed by a descending upper trendline originating from the April high near 0.0860 and connecting through the May high near 0.0760 and subsequent lower highs, while the rising lower trendl
WLFI: range coil with a $0.076 destinationThe Macro Picture 🗺️
WLFI spent April through May bleeding from $0.10 down into a deep May flush that swept liquidity all the way to $0.049 — a textbook structural reset. Since then price has refused to make new lows, carving a tightening base between $0.055 and $0.064. This kind of prolonged sideways compression after a capitulation wick is a volatility playground: it clears out over-leveraged shorts, rebuilds fuel, and typically resolves with a sharp expansion once one side of the range brea
WLFI has formed a reversal pattern (8H)After a strong bullish impulse, WLFI is trading just below the trigger lines and has developed a healthy compression, indicating an accumulation phase.
Following the formation of an SW Low, the price moved higher and formed a bullish iCH.
From the current demand zone, WLFI is expected to advance toward the highlighted supply zone.
A daily candle close below the invalidation level would invalidate this analysis.
If you would like us to analyze a coin or altcoin for you, first like this post,
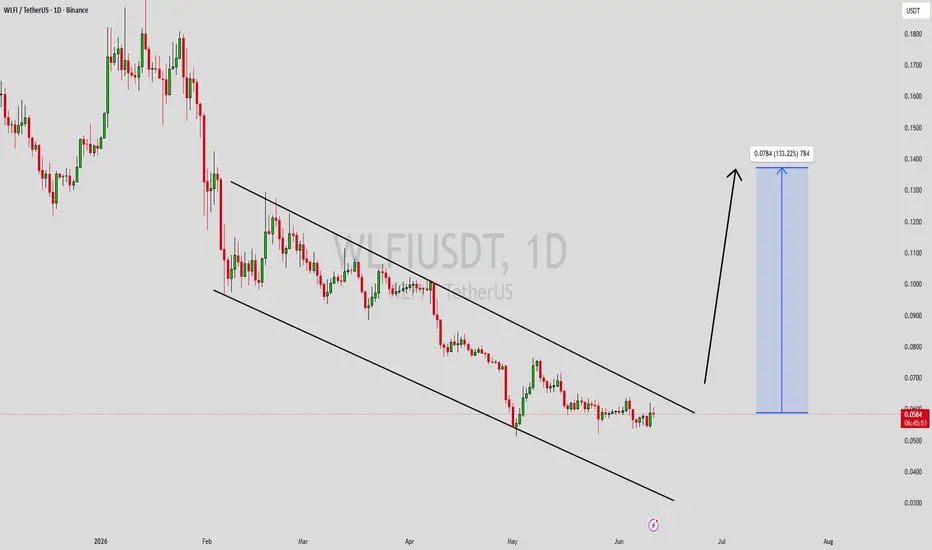
WLFIUSDT Forming Falling WedgeWLFIUSDT is forming a clear falling wedge pattern, a classic bullish wave signal that often indicates an upcoming breakout. The price has been consolidating within a narrowing range, suggesting that bearish pressure is gradually fading while buyers are beginning to step back into the market. With steady volume supporting accumulation near key support levels, the setup points toward a potential bullish breakout in the near term. The projected move could result in an impressive gain of around 90%
WLFI 8H – Final Wedge Test at Rising SupportWLFI on the 8H timeframe is currently trading around 0.0539 inside the same descending wedge structure that has been compressing price since the May highs near 0.0760.
Price attempted a push toward the descending resistance near 0.0620–0.0640 in early June before being rejected and selling back toward the rising support trendline near 0.0540, which is now being tested directly for what appears to be the final time before the wedge reaches its apex.
The wick to 0.0512 on May 27 showed buyers de
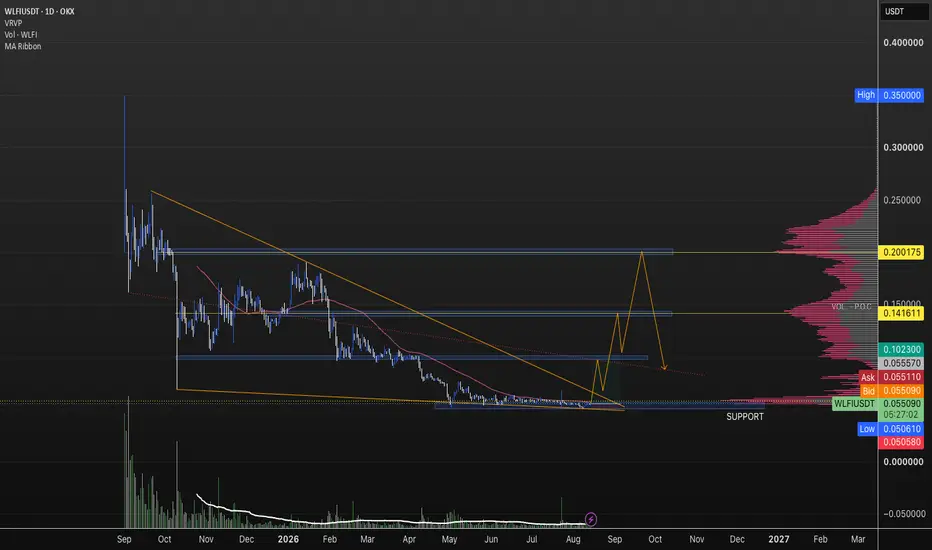
WLFIUSDT 1D#WLFI is currently testing the descending resistance on the daily chart.
Consider entering this coin only after a clean breakout above both the descending resistance and the daily SMA50. If the breakout is confirmed, the following upside targets could come into play:
🎯 $0.0733
🎯 $0.0848
🎯 $0.0941
🎯 $0.1034
🎯 $0.1166
🎯 $0.1335
⚠️ Always remember to use a tight stop-loss and maintain proper risk management.
WLFI BULLISH OR JUST DEAD CAT BOUNCE?$WLFI Bullish or Just Dead Cat Bounce?
WLFI banking license could be the catalyst we've been waiting for.
Back in January, World Liberty Trust applied for a national trust bank charter with the OCC to issue and manage USD1 reserves under federal oversight.
If approved, $WLFI becomes a federally regulated entity, opening the door to institutions, TradFi integrations, and broader stablecoin adoption.
Price definitely won't remain the same lol
WLFI 8H – Wedge Compression Continues at Lower SupportWLFI on the 8H timeframe is currently trading around 0.0555 still inside the same descending wedge structure formed by the descending resistance trendline from the May highs near 0.0760 and the rising support trendline from the May lows near 0.0513.
Price attempted a push toward the descending resistance near 0.0620–0.0640 in early June before being rejected and selling back down toward the lower boundary, which is now sitting near 0.0525–0.0530.
The structure has been compressing for over a m
WLFI 4H – Wedge at Final Compression PointWLFI on the 4H timeframe is currently trading around 0.0597 inside a tightening wedge structure formed by a descending resistance trendline from the May highs near 0.0760 and a rising support trendline from the May lows near 0.0513.
Both trendlines are now extremely close to converging with price sitting directly on the rising support trendline near 0.0525–0.0530, while the descending resistance has closed in to just 0.0605–0.0610 above.
The wedge is at its apex and a directional move is immin
WLFI Price Bearish Structure Continues World Liberty Financial (WLFI) continues to display a clear bearish market structure on the daily timeframe, with price action consistently forming lower highs and lower lows. This ongoing trend confirms that sellers remain in control, while bullish momentum continues to weaken across the broader structure. Recent attempts at recovery have struggled to sustain momentum, reinforcing the overall downtrend currently visible on the chart.
One notable development is the reclaim of a key daily suppor
WLFI 4H – Compression SetupWLFI on the 4H timeframe is currently trading around 0.0602 while being compressed inside a tightening structure formed by a descending resistance trendline from the May highs near 0.0760 and a rising support trendline from the April lows near 0.0513.
Price bounced aggressively from the April low, rallied toward the descending resistance, got rejected, and has since been making lower highs while the rising trendline continues to climb from below, squeezing price into an increasingly tight range
WLFI – Bulls Trying to Shift Momentum?WLFI has been overall bearish, trading within the falling red channel for the past several months 📉
However, this week price strongly rejected the $0.05 round number, signaling that buyers are finally stepping in around this psychological support zone 🔍
Despite the recent bounce, the overall structure remains bearish for now.
For the bulls to take over and shift momentum in their favor, a confirmed break above the last major high marked in red is needed 🚀
Until then, this recovery could stil