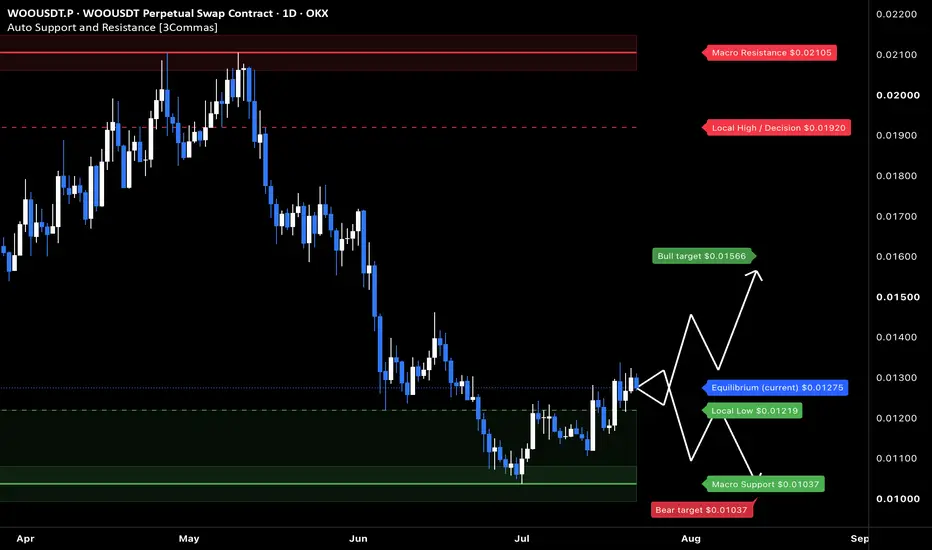
WOO: local squeeze with $0.0157 destinationThe Macro Picture 🗺️
WOO unwound from the $0.021 highs down to the $0.01037 floor in June, then reversed and reclaimed ground to $0.01278. Price is building higher off the base — the tape is rotating up rather than continuing to break down.
The Setup ⚙️
The Range Floor 🟢
$0.01037 (Macro Support)
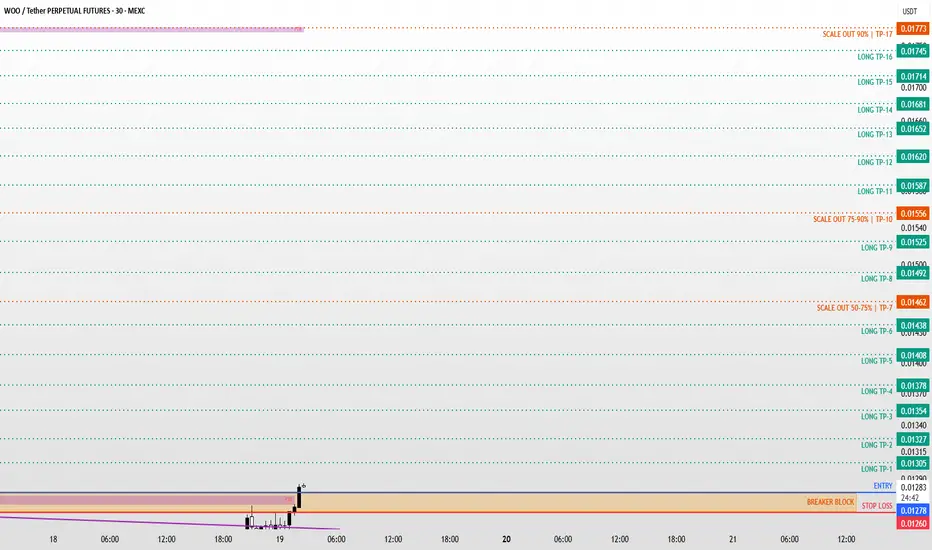
WOO / WOOUSDT Long Setup | Breaker Block ReclaimSOMI / SOMIUSDT Bullish Setup | Futures Trade Idea
SOMI / SOMIUSDT Long Setup | Breaker Block Reclaim
MARKET ANALYSIS
WOO is currently reacting from a key technical area highlighted on the chart.
As long as the protected support zone remains intact, the bullish market structure remains valid
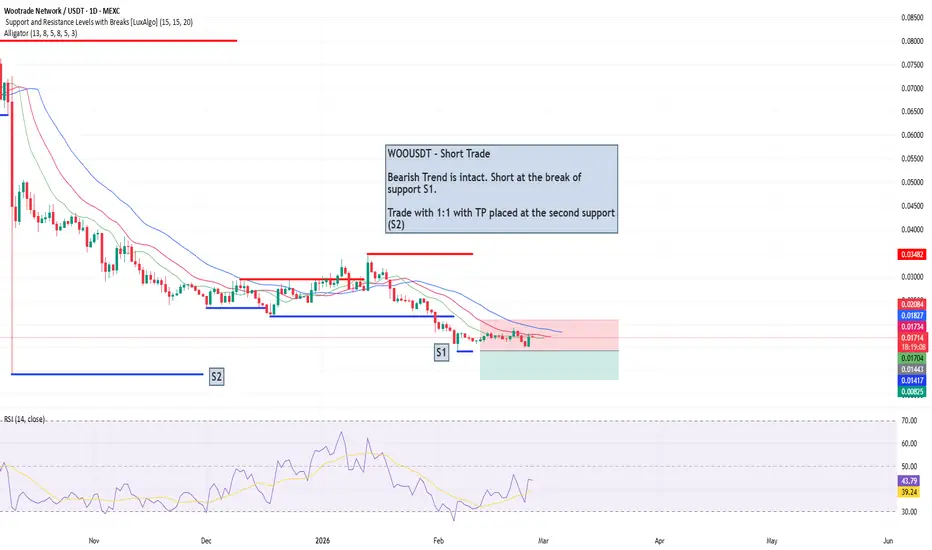
woousdt shortInstructions:
Entry point: yellow
Stop loss: red
Take profit: green
👉Leverage x 5-10-20 for crypto
👉Leverage x 20-50-100 for commodities, stocks, indices, and forex
👉Margin 1-5% max.
Always practice risk and money management.
Invest a maximum of 5% on any trade or across all your trades.
Invest on
WOOUSDT 1D#WOO is moving above the daily EMA50 and is on the verge of breaking above the descending resistance on the daily chart. If confirmed, the potential upside targets are:
🎯 $0.0222
🎯 $0.0243
🎯 $0.0263
🎯 $0.0293
🎯 $0.0331
⚠️ Always remember to use a tight stop-loss and maintain proper risk management
WOOUSDT UPDATE#WOO
UPDATE
WOO Technical Setup
Pattern: Falling Wedge Pattern
Current Price: $0.0293 USDT
Target Price: $0.0600 USDT
Target % Gain: 125.74%
Technical Analysis: WOO is showing signs of a potential breakout from a falling wedge pattern on the 1D chart, indicating bullish reversal potential if
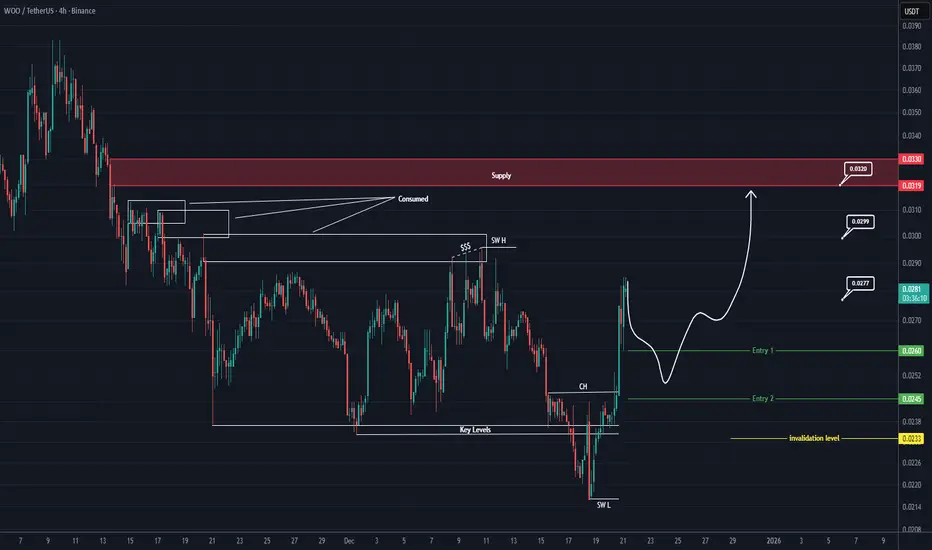
WOO Buy/Long Setups (4H)The order blocks at the top of the chart have been consumed, and most sellers have lost a large portion of their orders.
Price has completed a strong CH and is currently trading around a key level. There is also a liquidity pool visible above the chart near the Swing High (SW H).
All of these sign
#WOO/USDT Ready for Breakout After Long Consolidation!#WOO
The price is moving in a descending channel on the 1-hour timeframe. It has reached the lower boundary and is heading towards breaking above it, with a retest of the upper boundary expected.
We have a downtrend on the RSI indicator, which has reached near the lower boundary, and an upward reb
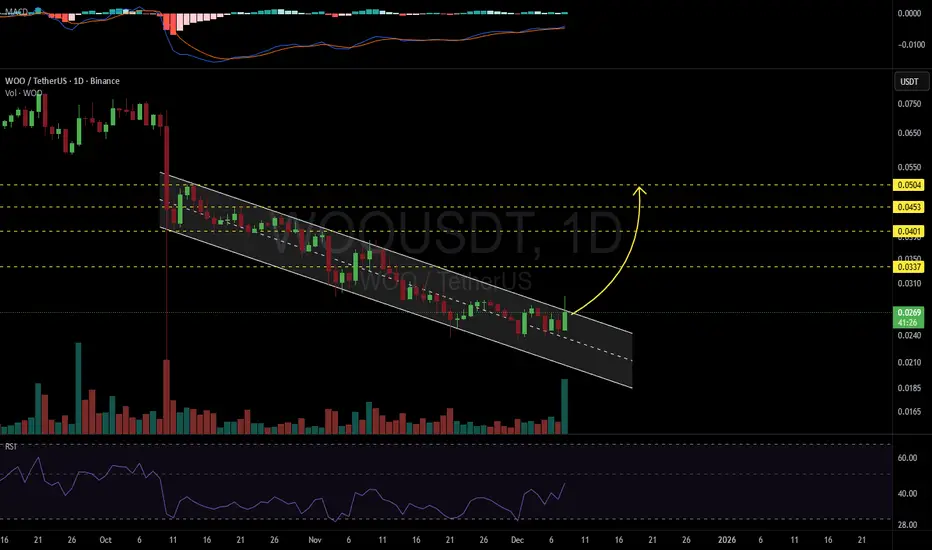
WOOUSDT 1D#WOO is moving inside a descending channel on the daily chart and volume has increased. It is trying to break above the channel resistance. If that happens, the potential targets are:
🎯 $0.0337
🎯 $0.0401
🎯 $0.0453
🎯 $0.0504
⚠️ Always remember to use a tight stop-loss and maintain proper risk manag
WOO Looks Bullish (2H)At the top of the chart, we have a large liquidity pool.
Currently, WOOUSDT has created conditions that, with an appropriate risk-to-reward ratio, may move toward the targets and sweep the liquidity pools.
We have a bullish CH and BOS on the chart, and the momentum is strong.
Remember, if you ente
See all ideas
Summarizing what the indicators are suggesting.
Oscillators
Neutral
SellBuy
Strong sellStrong buy
Strong sellSellNeutralBuyStrong buy
Oscillators
Neutral
SellBuy
Strong sellStrong buy
Strong sellSellNeutralBuyStrong buy
Summary
Neutral
SellBuy
Strong sellStrong buy
Strong sellSellNeutralBuyStrong buy
Summary
Neutral
SellBuy
Strong sellStrong buy
Strong sellSellNeutralBuyStrong buy
Summary
Neutral
SellBuy
Strong sellStrong buy
Strong sellSellNeutralBuyStrong buy
Moving Averages
Neutral
SellBuy
Strong sellStrong buy
Strong sellSellNeutralBuyStrong buy
Moving Averages
Neutral
SellBuy
Strong sellStrong buy
Strong sellSellNeutralBuyStrong buy
Displays a symbol's price movements over previous years to identify recurring trends.