WOOUSDT: Pressing the 200 MA, Breakout Toward 0.02576 Next Leg🪙 WOO keeps chewing through 0.013 and leaning on the daily 200 MA, like a dog pushing at a door that is about to give.
Fundamentals: WOO is a decentralized trading and liquidity network, now 99.3% below its all-time high. WOOFi TVL stands at $7.52M, up 2.6% over 30 days, while open interest is $1.34M, down 6% over 7 days.
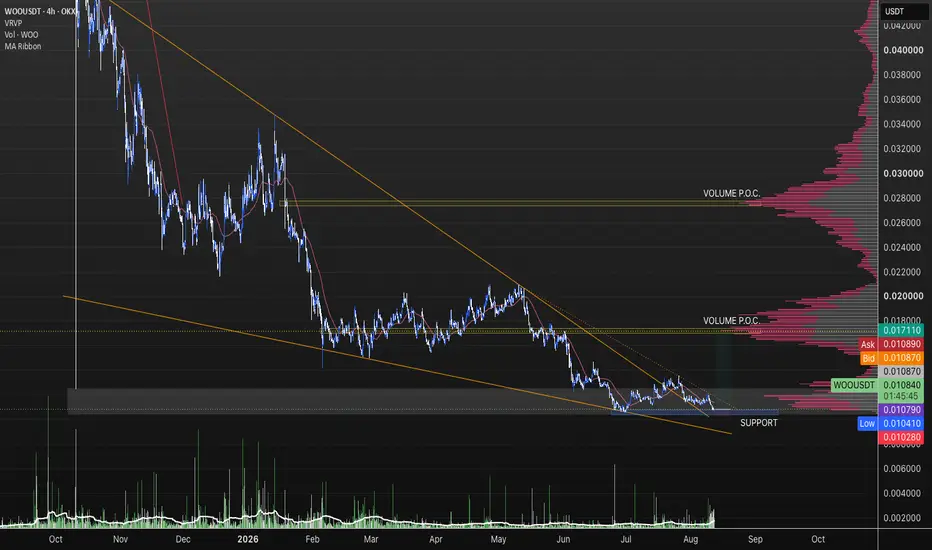
WOO technicals: on the daily, price spent months inside a falling channel and has now pushed above its inner trendline. Right now it sits around 0.01273, grinding the 0.013 l
In-depth trading ideas
#WOO MACRO BREAKOUT CONFIRMED – PAY CLOSE ATTENTION! 🔥 #WOO MACRO BREAKOUT CONFIRMED – PAY CLOSE ATTENTION! 🚀📈
CRYPTOCAP:WOO (WOO Network/USDT) has officially broken out of its multi-year descending resistance trendline on the 1W timeframe! After a prolonged accumulation phase near macro bottom levels, price has pushed cleanly past the trendline, signaling a major structural trend reversal.
Holding above this converted diagonal support line opens the door for a massive expansion rally toward multi-month horizontal targets! 🎯
📊 Technical Snaps
WOO / WOOUSDT Bullish Setup | Futures Trade IdeaMARKET ANALYSIS
WOO is currently reacting from a key technical area highlighted on the chart.
As long as the protected support zone remains intact, the bullish market structure remains valid and higher liquidity targets may continue to attract price action.
A breakdown below the invalidation level would weaken the current bullish scenario and require a reassessment of market conditions.
📍 Entry, Stop Loss and Take Profit levels are marked directly on the chart.
━━━━━━━━━━━━━━
⚠️ DISCLA
WOO Descending Trendline, Reversal or Another Rejection?The chart shows that WOO remains within a long-term bearish structure, with price trading below a Descending Trendline that has been forming since the major high around $0.38. However, the current price is approaching an important area around the trendline, making a potential breakout or rejection increasingly important to watch.
---
📐 Pattern: Descending Trendline
🔻 A Descending Trendline forms when price consistently creates Lower Highs (LH) and remains below a declining resistance line.
O
WOOUSDT — Waiting for a Pullback Into the Impulse BaseI’m looking at WOO for a LONG only on a deeper pullback into the 0.01041–0.01020 area.
This zone acted as the base before the previous strong expansion higher. Price spent some time building structure there, and once buyers took control, WOO moved away from the area with clear momentum.
That is exactly why I don’t want to chase the current price.
My preferred scenario is:
pullback → retest of the previous base → buyer reaction → continuation higher
Entry zone: 0.01041–0.01020
Invalidation:
WOO / WOOUSDT Bullish Setup | Futures Trade IdeaMARKET ANALYSIS
WOO is currently reacting from a key technical area highlighted on the chart.
As long as the protected support zone remains intact, the bullish market structure remains valid and higher liquidity targets may continue to attract price action.
A breakdown below the invalidation level would weaken the current bullish scenario and require a reassessment of market conditions.
📍 Entry, Stop Loss and Take Profit levels are marked directly on the chart.
━━━━━━━━━━━━━━
⚠️ DISCLA
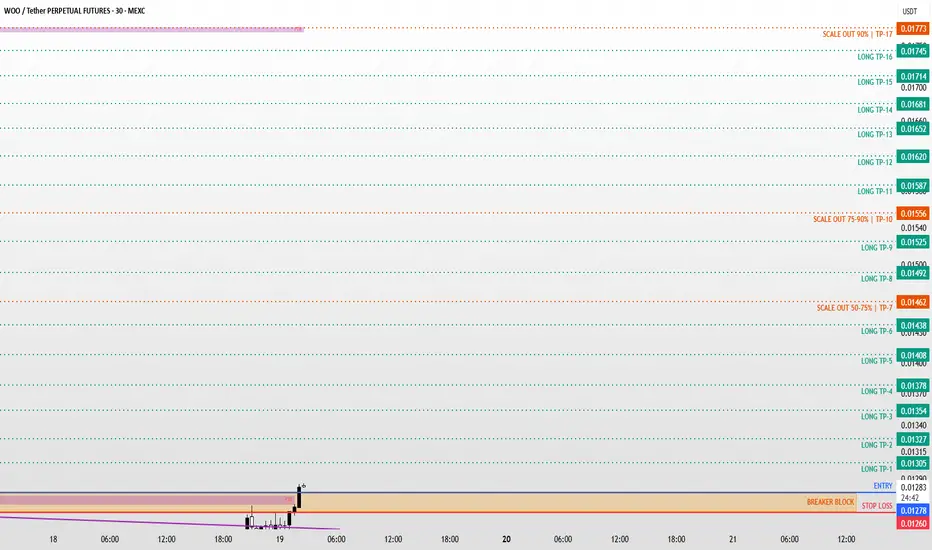
WOO / WOOUSDT Long Setup | Breaker Block ReclaimMARKET ANALYSIS
WOO is currently reacting from a key technical area highlighted on the chart.
As long as the protected support zone remains intact, the bullish market structure remains valid and higher liquidity targets may continue to attract price action.
A breakdown below the invalidation level would weaken the current bullish scenario and require a reassessment of market conditions.
📍 Entry, Stop Loss and Take Profit levels are marked directly on the chart.
━━━━━━━━━━━━━━
⚠️ DISCLA
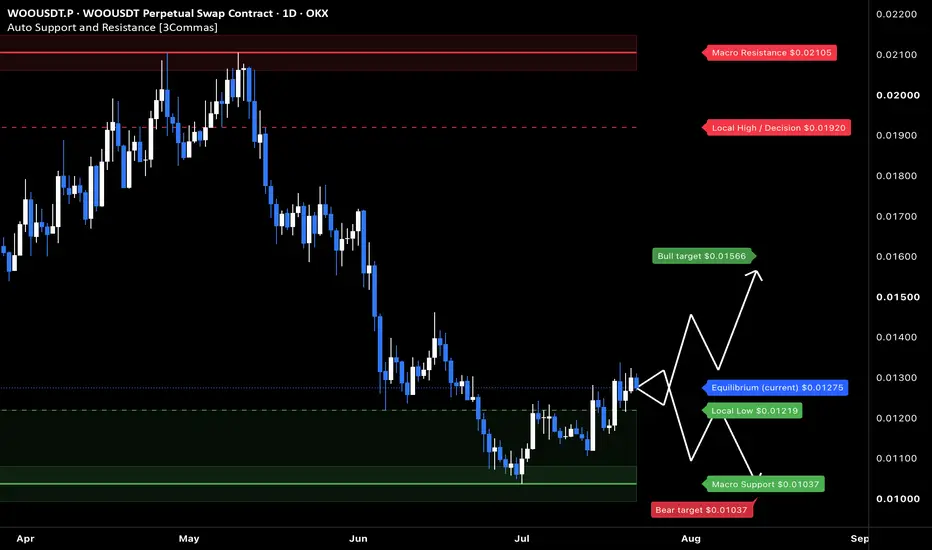
WOO: local squeeze with $0.0157 destinationThe Macro Picture 🗺️
WOO unwound from the $0.021 highs down to the $0.01037 floor in June, then reversed and reclaimed ground to $0.01278. Price is building higher off the base — the tape is rotating up rather than continuing to break down.
The Setup ⚙️
The Range Floor 🟢
$0.01037 (Macro Support) is the demand base, with $0.01219 (Local Low) as the nearer shelf. Both have held, and that's the floor this range pivots on.
The Decision Point 🔴
$0.01920 (Local High) is the structural gate. Before
WOO / WOOUSDT Long Setup | Breaker Block ReclaimSOMI / SOMIUSDT Bullish Setup | Futures Trade Idea
SOMI / SOMIUSDT Long Setup | Breaker Block Reclaim
MARKET ANALYSIS
WOO is currently reacting from a key technical area highlighted on the chart.
As long as the protected support zone remains intact, the bullish market structure remains valid and higher liquidity targets may continue to attract price action.
A breakdown below the invalidation level would weaken the current bullish scenario and require a reassessment of market conditions.
WOOUSDT 1D#WOO is moving above the daily EMA50 and is on the verge of breaking above the descending resistance on the daily chart. If confirmed, the potential upside targets are:
🎯 $0.0222
🎯 $0.0243
🎯 $0.0263
🎯 $0.0293
🎯 $0.0331
⚠️ Always remember to use a tight stop-loss and maintain proper risk management.
WOOUSDT UPDATE#WOO
UPDATE
WOO Technical Setup
Pattern: Falling Wedge Pattern
Current Price: $0.0293 USDT
Target Price: $0.0600 USDT
Target % Gain: 125.74%
Technical Analysis: WOO is showing signs of a potential breakout from a falling wedge pattern on the 1D chart, indicating bullish reversal potential if price continues to hold above key breakout levels. The token is currently trading around ~$0.0293 USDT, and a sustained breakout above the wedge resistance—with confirmation from volume—could validate
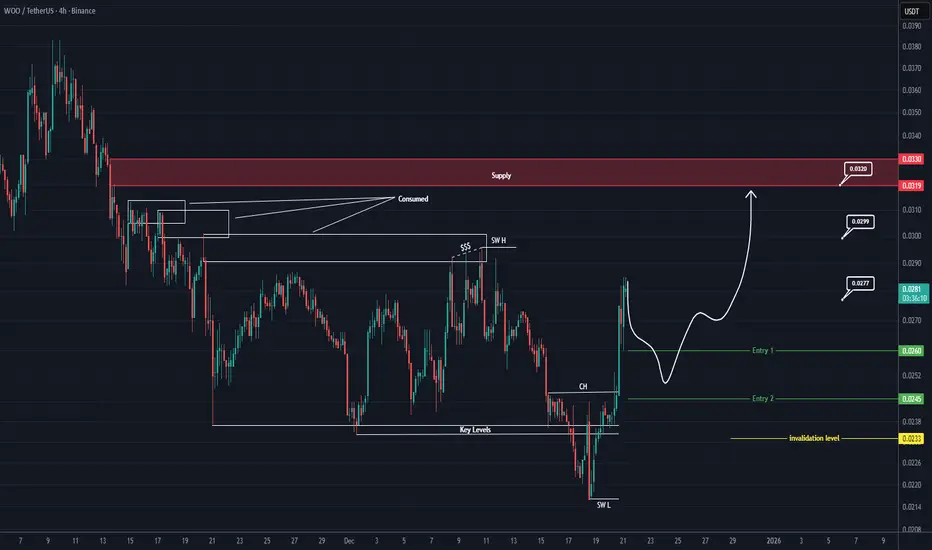
WOO Buy/Long Setups (4H)The order blocks at the top of the chart have been consumed, and most sellers have lost a large portion of their orders.
Price has completed a strong CH and is currently trading around a key level. There is also a liquidity pool visible above the chart near the Swing High (SW H).
All of these signs indicate that if a pullback occurs, price could move back toward higher levels.
The targets are marked on the chart, but the main target is the red supply zone.
For risk control, a pullback is nee
#WOO/USDT Ready for Breakout After Long Consolidation!#WOO
The price is moving in a descending channel on the 1-hour timeframe. It has reached the lower boundary and is heading towards breaking above it, with a retest of the upper boundary expected.
We have a downtrend on the RSI indicator, which has reached near the lower boundary, and an upward rebound is expected.
There is a key support zone in green at 0.02557. The price has bounced from this level multiple times and is expected to bounce again.
We have a trend towards consolidation above t
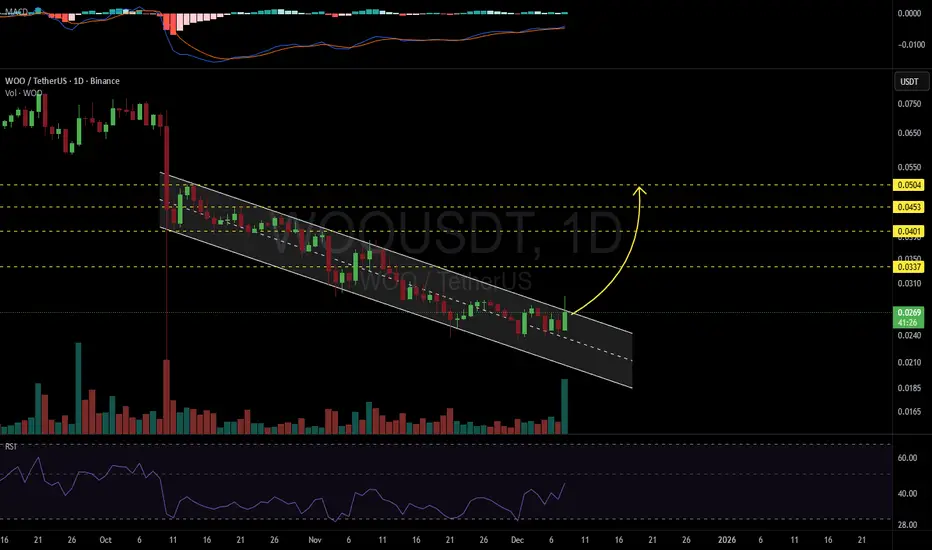
WOOUSDT 1D#WOO is moving inside a descending channel on the daily chart and volume has increased. It is trying to break above the channel resistance. If that happens, the potential targets are:
🎯 $0.0337
🎯 $0.0401
🎯 $0.0453
🎯 $0.0504
⚠️ Always remember to use a tight stop-loss and maintain proper risk management.
WOO Looks Bullish (2H)At the top of the chart, we have a large liquidity pool.
Currently, WOOUSDT has created conditions that, with an appropriate risk-to-reward ratio, may move toward the targets and sweep the liquidity pools.
We have a bullish CH and BOS on the chart, and the momentum is strong.
Remember, if you enter a position, stick to your stop-loss, as the risk-to-reward is only valuable if you respect it.
Touching the invalidation level will invalidate this analysis and signal.
Do not enter the position w
WOOUSDT UPDATE#WOO
UPDATE
WOO Technical Setup
Pattern: Bullish falling wedge pattern
Current Price: $0.0735
Target Price: $0.1367
Target % Gain: 85.40%
SWB:WOO is breaking out of a falling wedge pattern on the 1D timeframe. Current price is $0.0735 with a target near $0.1367, showing about 85% potential upside. The breakout signals a strong bullish reversal setup, indicating possible continuation to the upside. Always use proper risk management.
Time Frame: 1D
Risk Management Tip: Always use proper risk
WOOUSDT 1D#WOO is moving inside a symmetrical triangle on the daily chart. For the bullish scenario, it must break above the resistance cluster — which includes the triangle resistance, the daily SMA200, and the Ichimoku cloud. If that happens, the potential targets are:
🎯 $0.0842
🎯 $0.0953
🎯 $0.1080
🎯 $0.1207
🎯 $0.1388
🎯 $0.1619
⚠️ Always remember to use a tight stop-loss and follow proper risk management.
WOO/USDT – Descending Triangle Pressing Price at Key Zone!📌 Technical Overview
WOO/USDT is currently trapped inside a Descending Triangle on the daily timeframe. Sellers are consistently creating lower highs, while buyers are defending the critical support zone at 0.054–0.066.
This structure reflects the final stage of accumulation or distribution before the market makes a decisive move. With the triangle’s apex approaching (late September – early October), a major breakout or breakdown is likely imminent.
---
📊 Pattern Details
Main pattern: Descend