WORMHOLE / W / WUSDTUSDT Long Setup | Breaker Block ReclaimMARKET ANALYSIS
WORMHOLE - W - WUSDT is currently reacting from a key technical area highlighted on the chart.
As long as the protected support zone remains intact, the bullish market structure remains valid and higher liquidity targets may continue to attract price action.
A breakdown below the invalidation level would weaken the current bullish scenario and require a reassessment of market conditions.
📍 Entry, Stop Loss and Take Profit levels are marked directly on the chart.
━━━━━━━━━━━━━━
⚠️ DISCLAIMER
This publication is provided solely for educational and market observation purposes.
Nothing contained in this analysis should be considered financial advice, investment advice, or a recommendation to buy or sell any financial instrument.
All trading and investment decisions remain solely the responsibility of the individual trader.
Always conduct your own research and apply proper risk management before entering any position.
━━━━━━━━━━━━━━
🎯 PARALOG
▪️Crypto Market Analysis
▪️BTC Futures Signals
▪️Bitcoin & Altcoin Market Analysis
Precision • Momentum • Timing
━━━━━━━━━━━━━━
Exchange: #MEXC Futures
#bitcoin #btc #crypto #futures #technicalanalysis
In-depth trading ideas
W USDT LONG SIGNAL55. W/USDT – Trade Setup (LONG)
📈 Position Type: LONG
🕒 Timeframe: 1H
📊 Market: Futures
💰 Entry Zone:
0.008890
0.008014
🛑 Stop-Loss:
0.007898
🎯 Take-Profit Targets:
• TP1: 0.008666
• TP2: 0.009072
• TP3: 0.009588
• TP4. 0.010110
Tp5.
⚙️ Leverage:
5*
▫️ After TP1, move SL to Entry + 0.2%.
▪️ Exit Plan:
• 40% at TP1
• 20% at TP2
• 20% at TP3
20% at TP4
📌 Risk Management:
Risk only 1–2% of your capital per trade.
⚠️ Always check and confirm the setup on your chart before entering the trade.
W at macro floor: base recovery toward $0.0116The Macro Picture 🗺️
W unwound from the $0.0165 highs down to the $0.00846 macro floor and has flattened into a base just above it at $0.00913. The steep selling has given way to a sideways grind — exhaustion rather than continuation.
The Setup ⚙️
The Accumulation Zone 🟢
$0.00846–0.00913 is where the selling has dried up. The macro floor has held on retest, and this is the demand shelf a recovery would build from.
The Decision Point 🔴
$0.01328 (Local High) is the structural gate. Before it, the $0.01157 measured-move target is the first objective — reclaiming it proves buyers are stepping back in.
The Roadmap 🛣️
Hold the $0.00846 floor → recover toward $0.01157 → then challenge $0.01328. Invalidation is a clean daily close below $0.00846 — that voids the accumulation thesis.
This is a textbook DCA Accumulation Zone setup: scale in across the $0.00846–0.00913 band and let the base do the work.
More setups in profile.
#W #Wormhole #crypto #trading #TA #3Commas #DCA
Here is the English translation of the "Three Mainstream TechnicHere is the English translation of the "Three Mainstream Technical Tools Comprehensive Analysis" for WUSDT.
---
WUSDT – Comprehensive Analysis Using Three Mainstream Technical Tools
Tool 1: Moving Average System (MA)
MA Type Current Value Technical Implication
MA5 $1.0001 Short-term price anchor
MA20 $1.0000 Medium-term value center
MA60 $1.0000 Long-term peg reference
MA200 $0.9998 Extreme deviation regression reference
MA Judgment: All moving averages are tightly converged around $1.0000, showing a **perfect balance between bullish and bearish forces**. The price is above all moving averages — theoretically a "bullish alignment," but the practical significance is limited. The key observation is that **the price has never effectively broken below the MA200** (~$0.9998), indicating a stable long-term peg.
---
Tool 2: Bollinger Bands
Indicator Current Value Technical Implication
Upper Band $1.0025 Short-term premium ceiling
Middle Band $1.0000 Equilibrium value line
Lower Band $0.9975 Short-term discount floor
Bandwidth Extremely narrow (~0.25%) Very low volatility; no directional breakout
Bollinger Judgment: The bandwidth is at historically narrow levels — a condition that typically precedes a "breakout." For a stablecoin, however, the breakout direction is most likely a reversion to the mean (middle band), rather than a sustained trend.
Trading Reference:
· Price touches lower band ($0.9975) → Extreme discount → Buy opportunity
· Price touches upper band ($1.0025) → Extreme premium → Sell opportunity
---
Tool 3: Relative Strength Index (RSI)
Period RSI Value Technical Implication
RSI(14) 52 Neutral-to-bullish; no overbought/oversold
RSI(7) 55 Slightly bullish in the short term
RSI(21) 50 Completely neutral
RSI Judgment: RSI(14) is stable around 50, typically fluctuating within the 45–55 range. This reflects the market's strong confidence in the WUSDT peg, with no panic selling (RSI < 30) or aggressive buying (RSI > 70).
Trading Reference:
· RSI > 65 → Short-term overheating → Possible premium pullback
· RSI < 35 → Short-term oversold → Possible discount recovery
---
💡 Comprehensive Technical Scorecard
Technical Tool Signal Score (1–10)
Moving Averages Fully bullish alignment; stable peg 9/10
Bollinger Bands Extremely contracted; awaiting mean reversion 8/10
RSI Neutral; no extreme signals 8/10
Overall Technical Score Healthy and stable 8.3/10
---
📌 Final Conclusion
As a stablecoin, WUSDT's technical indicators consistently oscillate around the $1.0000 peg. For traders, WUSDT offers very little speculative value. However, as a store of value and payment instrument, its technical profile demonstrates a high degree of reliability.
If you are interested in a practical trading approach, here is a technical-indicator-based trading plan:
Strategy Entry Condition Target Stop-Loss
Discount Buy Price < $0.9980 $1.0000 $0.9950
Premium Sell Price > $1.0020 $1.0000 $1.0050
Hold $0.9990 – $1.0010 N/A Monitor USDT reserves
---
Disclaimer: This analysis is for educational purposes only and demonstrates the application of technical tools. It does not constitute investment advice. Stablecoin investments carry underlying asset risks. Always conduct your own research.
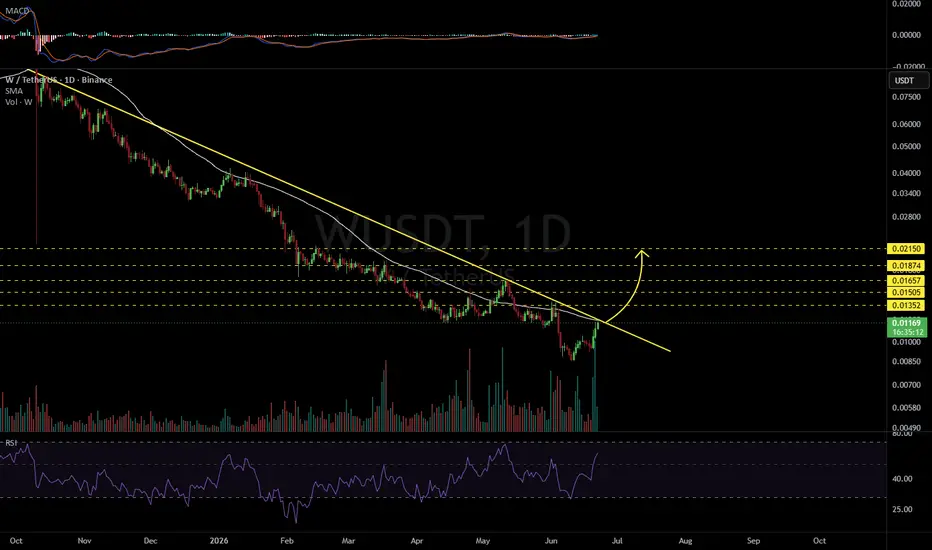
WUSDT 1D#W is on the verge of breaking out above the descending resistance and the SMA50 on the daily chart. In case of a confirmed breakout, the potential upside targets are:
🎯 $0.01352
🎯 $0.01505
🎯 $0.01657
🎯 $0.01874
🎯 $0.02150
⚠️ Always remember to use a tight stop-loss and maintain proper risk management.
WUSDT: Prolonged Stagnation Below the 0.01 USD ThresholdWUSDT: Prolonged Stagnation Below the 0.01 USD Threshold – Risk Management Playbook to Avoid Liquidity Sweeps
WUSDT is printing highly stagnant price action, continuing to validate the macro precision of our bearish (Short) bias from prior strategic market reviews. The asset's actual movement records no significant volatility updates or structural shifts. From a professional analysis standpoint, the core technical highlight is that price candles remain strictly confined below the psychological round-number boundary of 0.01 USD, while the broader chart completely lacks any high-probability bullish reversal triggers.
Observing the visual technical chart , the horizontal candlestick consolidation following the steep downward leg serves as solid evidence that buying momentum is severely exhausted. For investors who have already established trend-following Short positions and are locked into strong accrued returns, the most disciplined action now is to proactively trail your stop-loss down to tighter thresholds to shield your capital and let profits run safely.
Conversely, for sidelined market participants, it is vital to completely avoid late emotional herd behavior (FOMO) within this ambiguous accumulation zone. While entering a fresh sell entry at current market levels with a tight strategic stop-loss placed right above the 0.01 USD psychological floor seems to offer an immediate setup, this position carries an exceptionally high risk profile. Because the immediate price action lacks supplementary technical confirmations, chasing the trend here leaves the position highly vulnerable to sudden stop-hunts or volatile liquidity sweeps before the primary downward expansion resumes.
this is not investment advice, DYOR
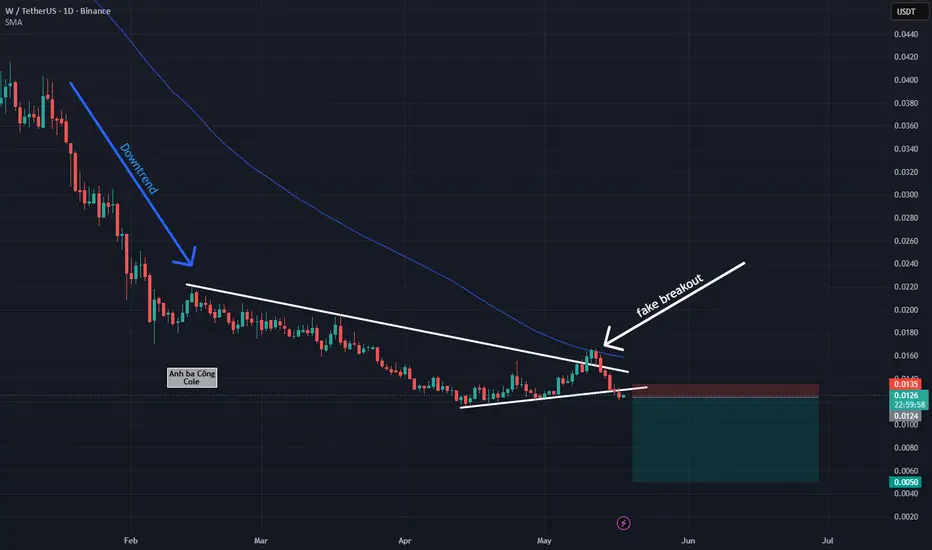
WUSDT: Puncturing the Psychological 0.01 USD MarkWUSDT: Puncturing the Psychological 0.01 USD Mark – Trading Playbook as Bears Maintain Absolute Dominance
WUSDT continues to demonstrate the macro accuracy of our technical roadmap, declining with high precision in line with the strategic evaluation from our previous analysis. Actual price action indicates that the asset has officially and decisively punctured straight through the critical psychological round-number boundary of 0.01 USD. Losing this vital support floor amid weak broader market conditions serves as clear evidence that selling pressure holds absolute control, opening a clear path for a continued aggressive slide toward the 0.005 USD zone.
Observing the technical chart, the downward candlestick structure remains intensely powerful following the previous failed fake breakout. Active momentum-driven supply continuously forces the price to print lower lows, completely neutralizing any short-term recovery attempts by the bulls.
In this highly volatile environment, strict discipline is your ultimate tool for capital preservation. For traders currently locked into highly profitable positions, the most intelligent action right now is to proactively trail your stop-loss down to tighter thresholds to lock in accrued returns. For those currently sidelined, my sincere advice is to completely avoid emotional herd behavior (FOMO). Remain patient and only trigger a new sell (Short) position if the market presents a well-defined technical retracement back to reasonable resistance levels.
this is not investment advice, DYOR
WUSDT Forming Falling WedgeWUSDT is forming a clear falling wedge pattern, a classic bullish wave signal that often indicates an upcoming breakout. The price has been consolidating within a narrowing range, suggesting that selling pressure is weakening while buyers are beginning to regain control. With consistent volume confirming accumulation at lower levels, the setup hints at a potential bullish breakout soon.
The projected move could lead to an impressive gain of around **90% to 100%** once the price breaks above the wedge resistance. This falling wedge pattern is typically seen at the end of downtrends or corrective phases, and it represents a potential shift in market sentiment from bearish to bullish.
Traders closely watching WUSDT are noting the strengthening momentum as it nears a breakout zone. The healthy trading volume adds confidence to this pattern, showing that market participants are positioning early in anticipation of a reversal.
Investors’ growing interest in WUSDT reflects rising confidence in the project's long-term fundamentals and current technical strength. If the breakout confirms with sustained volume, this could mark the start of a fresh bullish leg. Traders might find this a valuable setup for medium-term gains, especially as the falling wedge pattern completes and buying momentum accelerates.
✅ Show your support by hitting the like button!
✅ Leave a comment below! (What is your opinion about this coin?)
Your feedback and engagement keep me inspired to share more insightful market analysis with you!
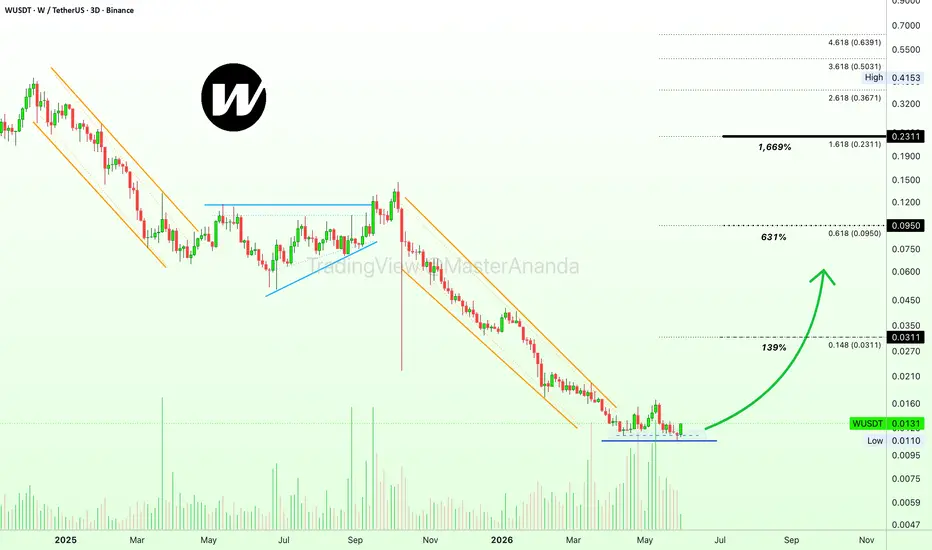
Wormhole (WUSDT): All-Time Low vs Easy 1,669%This is it, this is what we are looking for. We are looking for a project that is a strong buy-opportunity, that can move fast, has high potential for growth coupled with very low risk. A trading pair that can move within days. This is it—WUSDT.
Wormhole looks really good as volume is really high at the all-time low range. Here I don't recommend a stop-loss, spot trading, better yet, buy as much as you can. If it goes down? Crypto is going up.
The RSI looks pretty good on the weekly timeframe. The current candle has been active for a few hours only and it is full green, showing a great start to this new month and week. Starting the week green right after the previous session close can be taken as a signal that supports short-term bullish action. That is, this project is already moving and can move much higher in the coming days.
Consider the targets and this is how you know this bullish cycle will be a massive boom. It will be a comeback for the altcoins market. While this market is new, many people are of the believe that it is already over; gone. Thinking that Crypto will never shine again.
Nope... It is the other way around. We are preparing for the biggest bullish cycle in the history of the Cryptocurrency market. It all starts now, early/mid-2026. It will continue for years to come.
Here we have another good project with a great chart. New all-time low with huge potential for growth.
Namaste.
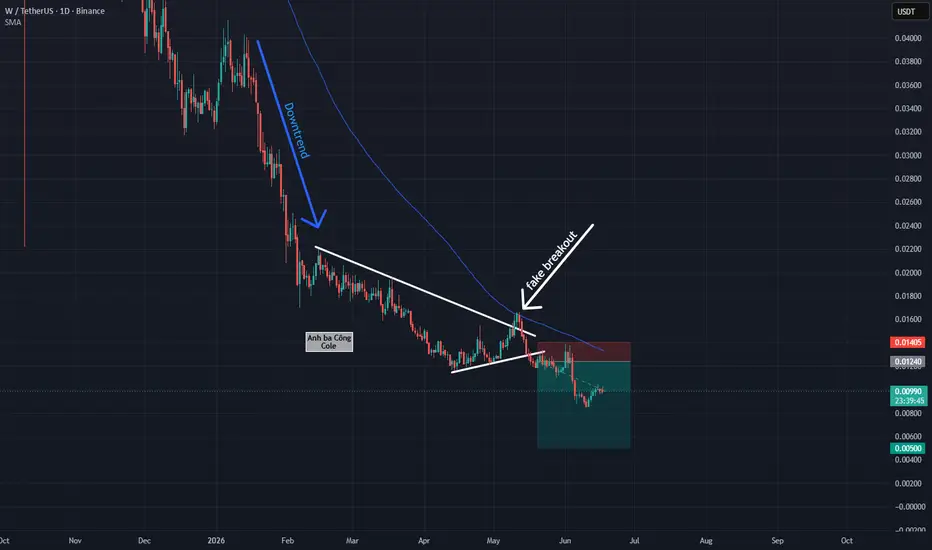
WUSDT: Downtrend Continues
WUSDT continues to move accurately in line with its macro downtrend, posting an 8% drop following a well-defined fake breakout. The current market structure completely favors the bears as they maintain decisive selling pressure. The optimal strategy at this juncture is to advise traders with existing Short positions to trail their stop-losses to protect profits. New market participants should remain patient and stay on the sidelines, avoiding FOMO at these volatile lower price bounds.
this is not investment advice, DYOR
WUSD: Macro Bearish Continuation Signals
WUSD is currently outlining a classic technical scenario for continued downward momentum in 2026. From a strategic perspective, there are three pivotal arguments confirming that selling pressure remains fully in control of the market. First, examining the macro picture, the asset remains trapped within a persistent long-term bearish cycle, creating a prevailing sense of caution across the entire market structure.
The second noteworthy point emerges in the medium-term timeframe. Following a recovery effort aimed at finding new momentum, the price generated a "fakeout" (false breakout) as it failed to close decisively above the 100-period moving average (MA100). This failure at a critical technical barrier proves that buying power is exhausted and the bulls lack the strength to shift the current narrative. Finally, the most recent short-term upward pulse was officially broken when the price pierced through its lower support, confirming a decisive return of the bears.
Given this current structure, a Short position is opening up with a highly promising risk-to-reward (RR) ratio. The most disciplined strategy is to place a stop-loss immediately above the recently broken short-term uptrend line to decisively protect capital. Profit targets are clearly identified at the $0.01 psychological round number, with further expectations at the $0.005 mark. Always maintain a cool head and adhere strictly to capital management rules.
this is not investment advice, DYOR
W/USDT: Testing the $0.015 BoundaryWUSDT confirms a decisive downtrend after a major crash, forming a lower high structure. The priority strategy is to establish Short positions at the confluence of the trendline's 3rd touch and the $0.015 psychological level. This setup offers an excellent risk management advantage with a tight stop-loss and high profit potential. Investors must maintain iron discipline and patiently wait for confirmation at the technical pivot point to optimize trading efficiency.
this is not investment advice, DYOR
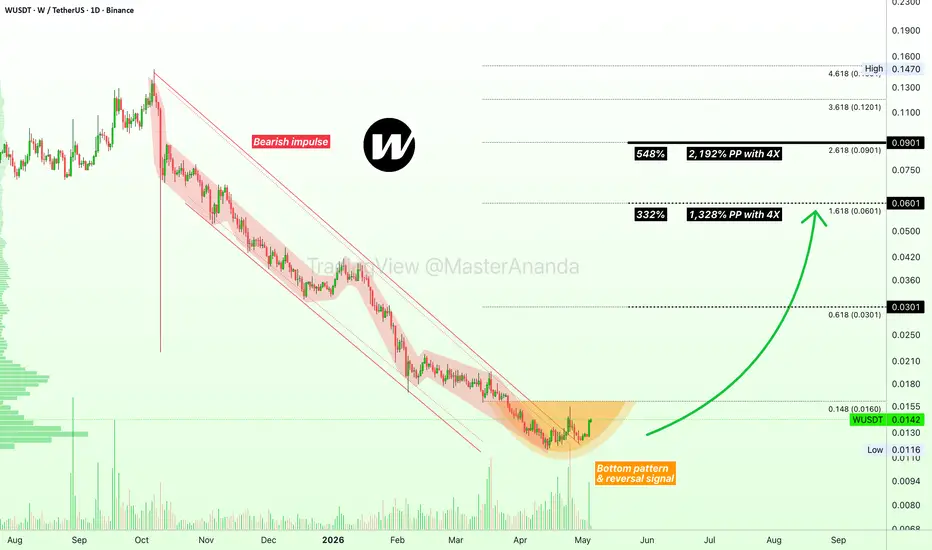
Wormhole (WUSDT) hits bottom, ready to start new bull market—4XBefore October 2025 Wormhole was producing very high volume, then it went bearish. While it was bearish, trading volume was very low. After March 2026 WUSDT started again to produce high volume, the same signal that was present when this project was going up.
Now a rounded bottom is acitve and trading volume is rising again. There are many big green volume bars as WUSDT trades near its all-time low, one last chance to buy cheap-affordable before the market turns.
Bullish action is really intensifying today. Is it because Bitcoin moved easily above $80,000? Is it because of some particular event? Or has this cycle been in the making for years, since the last crash appeared?
The truth is that the market moves based on cycles and within these cycles we have waves. We witnessed a bearish cycle. Within the bearish cycle the market goes down but also up. Each time we get a down-move the end result is a lower low. Within a bullish cycle, it is the same. The market goes up but there are also corrections and retraces. Regardless of the swings and fluctuations, the end result is always a pattern of higher highs and higher lows, that's the main definition of a bullish cycle, long-term growth.
The market is saying, from left to right, a new bullish cycle is unfolding right now, after Q1 2026. Supporting signals are present on hundreds and hundreds of charts, also on the one and only Crypto-King, Bitcoin. Bitcoin has been rising three months non-stop, 35% up from its $60,000 6-February low.
As Bitcoin continues to grow above $80,000, the altcoins market will blow up. Wormhole is one of those altcoins. It already hit bottom. It is already starting a recovery phase. In the coming months we can see huge change. From extreme fear, to extreme joy, profits and excitement, even some greed when the market peaks.
It is still early. The action is still happening at support. Everything can change fast though. Make sure to buy and hold.
Namaste.
WUSDT Potential Macro Reversal From Historical SupportWormhole has completed a prolonged corrective decline into a major historical demand zone after forming a clear five-wave bearish structure from the macro top.
Price is now trading inside a key accumulation region where downside momentum appears heavily exhausted. The current zone presents a high-risk/high-reward accumulation area as long as the local low structure remains protected.
A successful recovery from this demand region could trigger a strong relief expansion toward the major descending resistance zone around 0.06132, while broader bullish continuation may extend toward the higher resistance targets around 0.40389 over time.
Wormhole (W): Bearish Momentum ContinuesWormhole (W) continues its decisive downtrend, having achieved 50% of its target path as per last week's analysis. The current market structure belongs entirely to the bears, with demand significantly weakening at key boundaries. Investors with existing Short positions should proactively move their stop-loss to protect capital and realized gains. For those on the sidelines, maintain iron discipline and strictly avoid FOMO-selling to stay safe from unexpected technical corrections as technical barriers are neutralized.
this is not investment advice, DYOR
Wormhole (W): Downtrend Confirmed
Wormhole (W) is behaving exactly according to the bearish scenario we outlined last week. After breaking its long-standing triangle accumulation structure, the price candles have officially established a decisive downward trend. The breach of this critical support is not just a standard decline; it marks a complete shift in the asset's behavioral nature for 2026. Currently, the bears hold absolute control, turning weak recovery attempts into opportunities for sellers to strengthen their positions as momentum fades.
The key lies in the retest phase at the 0.015 USD boundary. According to technical principles, once a solid "floor" collapses, it immediately transforms into a heavy psychological resistance "wall." The visible exhaustion of demand at this threshold is evidence that institutional capital is quietly exiting the position. Given the current trajectory, the macro target of 0.010 USD is well within reach and is highly likely to be achieved within the next two weeks. Investors must maintain iron discipline and strictly avoid "catching a falling knife" while the downward impulse remains overpowering. Among professionals, patience at this stage is the ultimate key to capital preservation. Closely monitor price reactions; as long as the old psychological barriers remain unneutralized, the decline will proceed with sharp and cleansing efficiency.
w usdt long signal📢 Official Trade Signal – W/USDT
📈 Position Type: LONG
💰 Entry Price: 0.03584 (Limit Order)
🎯 Take-Profit Targets (Partial Exits):
• TP1: 0.03665
• TP2: 0.03767
• TP3: 0.03870
• TP4: —
• TP5: —
• TP6: —
🛑 Stop-Loss: 0.035
📊 Timeframe: 15m
⚖️ Risk/Reward Ratio: TBD
💥 Suggested Leverage: 5× – 10×
🧠 Technical Analysis Summary
W/USDT shows bullish momentum with support around 0.035. Price is reacting positively from this level on the 15m chart, forming higher lows and confirming buying interest.
Partial take-profits align with liquidity zones:
0.03665 → 0.03767 → 0.03870
Breaking TP1 (0.03665) increases the probability of reaching higher targets.
⚙️ Trade Management Rules
✔ Take partial profit at TP1
✔ Move SL to Break-Even once TP1 hits
✔ Trail SL as price approaches higher targets
✔ Avoid re-entry if SL is hit
✔ Confirm structure before entering
📌 TradingView Hashtags
#WUSDT #CryptoSignal #LongSetup #TradingView #FuturesTrading #Altcoins #TechnicalAnalysis
Wormhole to da moonWormhole did not just accumulate for 180 days to pump and dump around this zone. Q1 is going to be awesome for W accumulations.
First two targets are very conservative, will be playing step by step.
Box zone determines bullishness
Wormhole is going to be one of the coins to talk during 2025.
Merry Christmas!
WUSDT 1D#W is holding above the broken descending resistance on the daily chart, and a bounce is expected from here. For the bullish scenario to be confirmed, it needs to reclaim the daily SMA200. If that happens, the potential targets are:
🎯 $0.1006
🎯 $0.1294
🎯 $0.1526
🎯 $0.1758
🎯 $0.2089
🎯 $0.2510
⚠️ Always remember to use a tight stop-loss and maintain proper risk management.
WUSDT | Turning BullishW/USDT is showing strong signs of reversal momentum. A clear Inverse Head & Shoulders pattern has been completed, with the neckline breakout suggesting a potential bullish trend shift. Price is consolidating near the neckline, which is now acting as support, adding strength to the breakout.
If momentum sustains, the next upside targets open toward $0.19 – $0.29, with an extended bullish potential toward $1.85 in the long run. On the downside, support is seen around $0.061 – $0.049, keeping risk-to-reward highly attractive for medium to long-term investors.