 Short
Short
XAG / TetherUS PERPETUAL CONTRACT
No trades
No trades
In-depth trading ideas
Short

1-hour technical trading chart a 1-hour technical trading chart for XAGUSD. It highlights a short position setup, visualized with a red risk area and a blue reward area, indicating a bearish trade strategy.
Short
15-minute technical analysis"We have already shared this analysis before."😏🤑💵
15-minute technical analysis chart for Silver (XAGUSD). It highlights a short position setup with a resistance zone in red and a target/support level below in light blue, indicating a strategy expecting a price decline.
Short
XAGUSD- Rejection, Retest, and High‑Probability Short ZonesBearish. Price structure on the 30‑minute chart favors shorts while price remains below the upper supply cluster and inside the descending channel. Two high‑probability short entries are available: an aggressive short on resistance rejection and a conservative short on a failed retest after a breakdown. Use expanding volume on the trigger candle, strict stops, and layered profit taking to manage risk.
Chart Read and Rationale
Trend and structure: The 30m timeframe shows a sequence of lower highs and lower lows framed by a descending channel, indicating a higher probability of continuation to the downside.
Supply zone: The upper resistance cluster (channel upper boundary / recent swing highs) is the preferred area for aggressive shorts.
Support structure: Layered horizontal supports below provide logical profit‑taking levels and places to trail stops.
Confirmation: Prefer entries that coincide with a bearish reversal candle at resistance or a failed retest after a breakdown, confirmed by expanding volume on the trigger candle.
Trade Management Rules and Checklist
Trend filter: Confirm bearish structure on 30m (lower highs/lows and channel slope).
Trigger candle: Wait for a closed trigger candle; do not enter on intrabar noise.
Volume: Require volume expansion on the trigger candle for higher probability.
Risk: Calculate position size so a stop hit equals ≤ 1–2% of account.
Partial exits: Scale out at predefined support levels; move stop to breakeven after first partial.
Invalidation: If price closes and holds above the supply cluster and channel upper boundary, cancel the short plan and reassess.
Journal: Record entry, stop, targets, rationale, and outcome for every trade.
Long
XAGUSDT - SILVER LONG - FROM OTE ZONE WITH LG (liquidity grap)This XAG/USDT analysis identifies a bullish setup predicated on a liquidity sweep strategy. The price is currently consolidating near the 0.618 Fibonacci level, but the primary thesis anticipates a temporary move lower into the "liquidity gap" to hunt stop-orders around the $70.00 area. Following this hunt, the expectation is a sharp reversal and expansion toward the $92.31 target, clearing the previous swing highs. The setup relies on the SMA 55 providing dynamic support during the dip and a subsequent MACD momentum shift to confirm the impulsive move upward.
Long
Silver at 74 USD spot - real, physical price 88,9 EuroGood day, we see Silver spot price lower and expect a bottom around the 50 level.
Even tho the spot price of silver went down, we can not find real physical silver for anything near that price. In fact, in Germany, the cheapest offer i can find right now is 88,9 Euro for one Ounce of fine Silver...
If you can help to locate better options for real, physical silver, please let me know. I would also be interested in coins, which sold out a lot... Thank you!

[LOI] - SILVERKey Points:
- JP. Morgan is reputable for manipulating Silver markets, having been fined. Not impossible that as this dump was not followed by the Shanghai Spot physical, SILVER derivatives, likely to match price upwards after the weekend.
Notes on how I personally use my charts/NFA:
Each level L1-L3 and TP1-TP3 (Or S1-S3) has a deployment percentage. The idea is to flag these levels so I can buy 11% at L1 , 28% at L2 and if L3 deploy 61% of assigned dry powder. The same in reverse goes for TP. TP1: 61%, TP2:28% and TP3:11%. If chart pivots between TP's, in-between or in Between Sell levels these percentages are still respected. I like to use the trading range to accumulate by using this tactic.
Just my personal way of using this. This is not intended or made to constitute any financial advice.
This is not intended or made to constitute any financial advice.
NOT INVESTMENT ADVICE
I am not a financial advisor.
The Content in this TradingView Idea is for informational purposes only, you should not construe any such information or other material as legal, tax, investment, financial, or other advice. Nothing contained within this idea constitutes a solicitation, recommendation, endorsement, or offer to buy or sell any securities or other financial instruments in this or in in any other jurisdiction in which such solicitation or offer would be unlawful under the securities laws of such jurisdiction.
All Content on this idea post is information of a general nature and does not address the circumstances of any particular individual or entity. Nothing in the idea/post constitutes professional and/or financial advice, nor does any information on the idea/post constitute a comprehensive or complete statement of the matters discussed or the law relating thereto. You alone assume the sole responsibility of evaluating the merits and risks associated with the use of any information or other Content on the idea/post before making any decisions based on such information.
Sir. Galahad - QUANT
Disclaimer
The information and publications are not meant to be, and do not constitute, financial, investment, trading, or other types of advice or recommendations supplied or endorsed by.
Update idea
Add note
SirGalahad-QUANT
Disclaimer
The information and publications are not meant to be, and do not constitute, financial, investment, trading, or other types of advice or recommendations
Long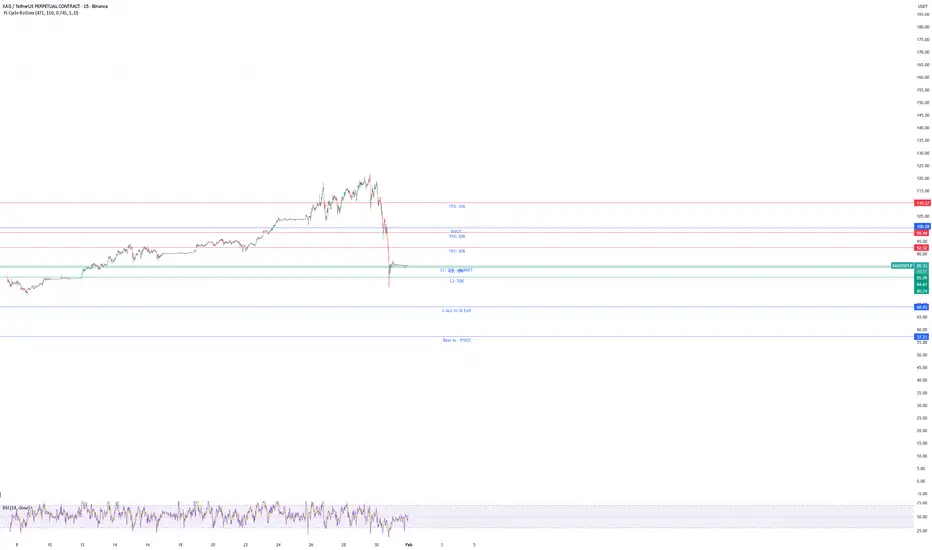
SILVER READY FOR CORRECTION | FALLING WEDGE & MACROLiquidity Rotation, Not Capitulation: Bitcoin Caught in a Macro Pause ▶️
Global capital is clearly rotating. Gold and the S&P 500 are printing record highs, while Bitcoin is struggling to regain momentum, but on-chain data suggests this is fatigue and rebalancing, not a full-scale exit 💸
Two signals define the current pressure:
📊 A deeply negative Coinbase Premium shows persistent U.S. selling, pointing to institutional deleveraging rather than retail panic
📊 Stablecoin supply contraction confirms that some capital has temporarily moved back to fiat, reducing near-term “dry powder” for impulsive rebounds
At the same time, leverage metrics show repeated futures open interest resets, meaning recent volatility is driven more by liquidations than aggressive spot selling. This aligns with historical mid-to-late cycle cooling phases, where momentum fades before structure breaks
Importantly, liquidity has not fully left crypto. Stablecoin ratios, exchange outflows, and DeFi activity suggest capital is waiting on clearer direction rather than funding the gold rally directly. This is diversification, not abandonment
Scenarios to watch:
📉 Bearish: Continued institutional selling could pressure BTC toward structural supports (~$81K, $70K, worst-case $58K)
🕯 Neutral/Base case: Sideways consolidation as the market absorbs supply and rebuilds liquidity
📈 Bullish: Stablecoin inflows resume, leverage stabilizes, and spot demand returns, reigniting trend continuation
Bitcoin isn’t breaking, it’s pausing. Direction will be decided by liquidity returning, not headlines ☄️
Short