XAI Major Resistance Ahead — Breakout or Rejection?The chart shows a Descending Trendline that has been limiting XAI's price movement within a prolonged downtrend. The current price is around $0.00905, while the main trendline remains above price and acts as dynamic resistance.
---
📐 PATTERN: DESCENDING TRENDLINE
🔻 A Descending Trendline forms when price continues to create Lower Highs (LH), causing the resistance line to slope progressively lower over time.
📉 On this chart, the trendline has developed from the $0.09–$0.10 area and continues
In-depth trading ideas
xai looking bullish this setup is showing a strong breakout attempt from a long-term descending trendline. If the breakout is confirmed and price manages to hold above the resistance zone, we could see a strong relief move, potentially in the 50–60% range from the breakout area. A successful breakout could open the door for a much larger upside move, offering a strong profit opportunity. 🚀
Key confirmation: sustained price action above the descending trendline and the marked resistance zone.
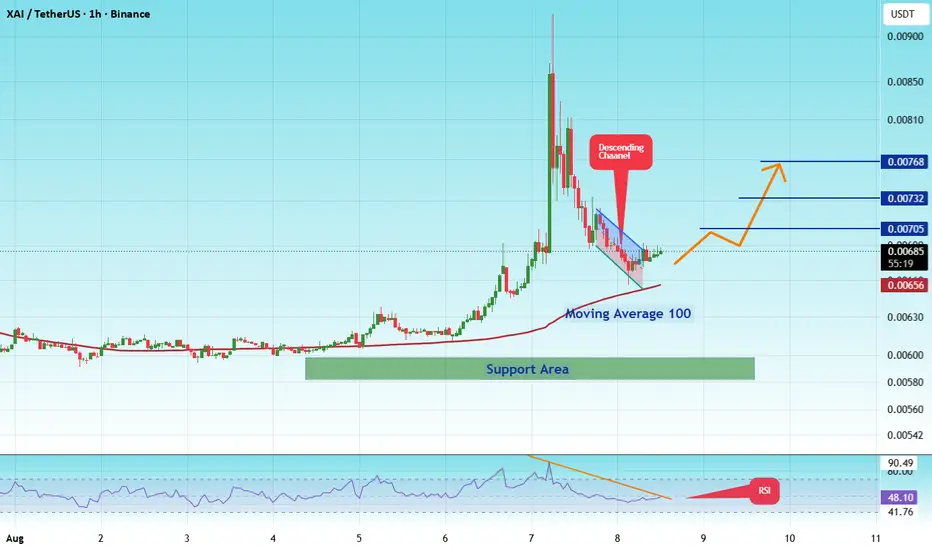
#XAIUSDT — Descending Triangle: Ready for Takeoff or Breakdow#XAI
The price is moving within a descending channel on the 1-hour timeframe and has reached the lower boundary. It is now poised for a bounce and is expected to retest this boundary.
The Relative Strength Index (RSI) indicates a downward trend, which is likely to continue given the overbought conditions.
There is a key support zone in green at 0.00582, and the price has bounced off this zone several times, making it a strong support level.
The price is trending towards the 100-period moving
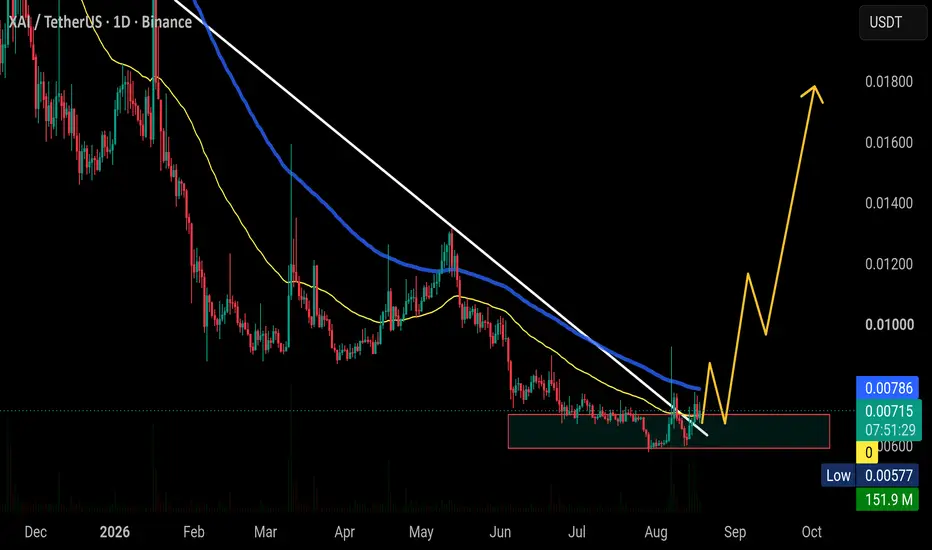
$XAI pulled back around 20% after getting rejected from the 99 ENASDAQ:XAI pulled back around 20% after getting rejected from the 99 EMA.
Still bullish here 👀
If price reclaims and holds above the blue EMA, the upside setup stays valid. We’re also still holding above the accumulation zone, which is a good sign.
From here, I’m watching for another move higher. 📈
Stop-loss: below the accumulation zone on a closing basis.
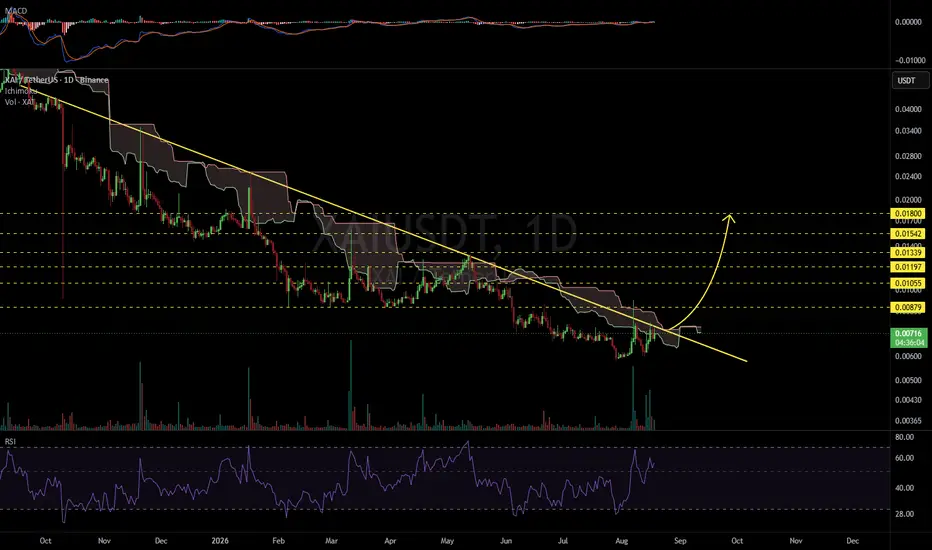
XAIUSDT 1D#XAI is testing the long-term descending resistance trendline along with the Ichimoku Cloud. Keep a close eye on the price action. In case of a solid breakout above these resistance levels, the potential upside targets are:
🎯 $0.00879
🎯 $0.01055
🎯 $0.01197
🎯 $0.01339
🎯 $0.01542
🎯 $0.01800
⚠️ Always use a tight stop-loss and apply proper risk management.
Can #XAI still rise?📊Can #XAI still rise?
🧠From a structural perspective, we are currently testing the S/R zone near the support line. We first need to see how it performs as support, so the probability of continued upward movement from here is relatively high.
➡️Market sentiment and trading volume are very good, so the primary outlook is bullish.
🤜Follow me, and I will guide you through market changes. Remember to like💖 and share💬
BYBIT:XAIUSDT.P
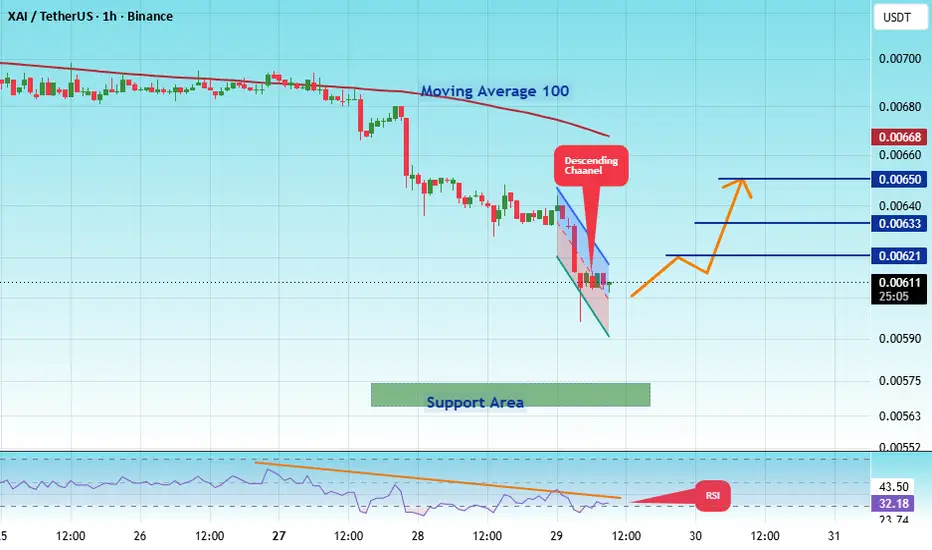
#XAIUSDT — Descending Triangle: Ready for Takeoff or Breakdow#XAI
The price is moving within a descending channel on the 1-hour timeframe and has reached the lower boundary. It is now poised for a bounce and is expected to retest this boundary.
The Relative Strength Index (RSI) indicates a downward trend, which is likely to continue given the overbought conditions.
A key support zone (in green) has been identified at 00580. The price has bounced off this zone several times, making it a strong support level.
The price is trending towards the 100-period
#XAIUSDT — Descending Triangle: Ready for Takeoff or Breakdow#XAI
The price is moving within a descending channel on the 1-hour timeframe and has reached the lower boundary. It is now poised for a bounce and is expected to retest this boundary.
The Relative Strength Index (RSI) indicates a downward trend, which is likely to continue given the overbought conditions.
There is a key support zone (in green) at 0.00708. The price has bounced off this zone several times, making it a strong support level.
The price is trending towards the 100-period moving a
#XAIUSDT — Descending Triangle: Ready for Takeoff or Breakdow#XAI
The price is moving within a descending channel on the 1-hour timeframe and has reached the lower boundary. It is now poised for a bounce and is expected to retest this boundary.
The Relative Strength Index (RSI) indicates a downward trend, which is likely to continue given the overbought conditions.
There is a key support zone (in green) at 0.00700. The price has bounced off this zone several times, making it a strong support level.
The price is trending towards the 100-period moving a
#XAIUSDT — Descending Triangle: Ready for Takeoff or Breakdow#XAI
The price is moving within a descending channel on the 1-hour timeframe and has reached the lower boundary. It is now poised for a bounce and is expected to retest this boundary.
The Relative Strength Index (RSI) indicates a downward trend, which is likely to continue given the overbought conditions.
There is a key support zone in green at 0.00567. The price has bounced off this zone several times, making it a strong support level.
The price is trending towards the 100-period moving ave
XAI/USDT (4h) Approaching the Apex of a Descending TriangleXAI/USDT is compressing inside a descending triangle on the 4H chart, with price gradually approaching the apex.
A confirmed breakout above the descending resistance could signal a bullish reversal. A breakdown below horizontal support would confirm bearish continuation and open the way for further downside.
#XAIUSDT — Descending Triangle: Ready for Takeoff or Breakdow#XAI
The price is moving within a descending channel on the 1-hour timeframe and has reached the lower boundary. It is now poised for a bounce and is expected to retest this boundary.
The Relative Strength Index (RSI) indicates a downward trend, which is likely to continue given the overbought conditions.
There is a key support zone in green at 0.00647. The price has bounced off this zone several times, making it a strong support level.
The price is trending towards the 100-period moving ave
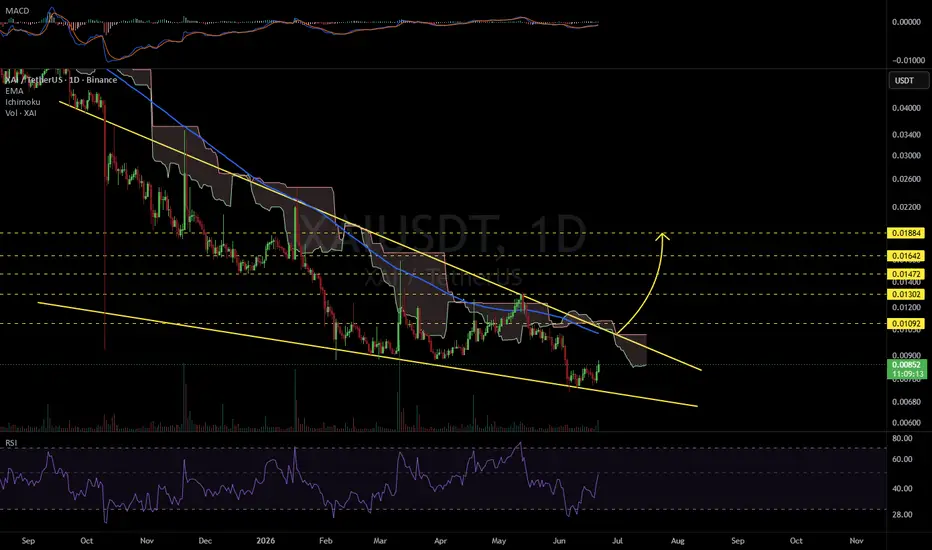
XAIUSDT 1D#XAI is moving inside a falling wedge pattern on the daily chart. In case of a breakout above the resistance cluster, which consists of the wedge resistance, the Ichimoku Cloud, and the daily EMA100, the potential upside targets are:
🎯 $0.01092
🎯 $0.01302
🎯 $0.01472
🎯 $0.01642
🎯 $0.01884
⚠️ Always remember to use a tight stop-loss and maintain proper risk management.
XAIUSDT Forming Bullish MomentumXAIUSDT is forming a clear bullish momentum pattern, a classic bullish wave signal that often indicates an upcoming breakout. The price has been consolidating within a narrowing range, suggesting that selling pressure is weakening while buyers are beginning to regain control. With consistent volume confirming accumulation at lower levels, the setup hints at a potential bullish breakout soon. The projected move could lead to an impressive gain of around 60% to 70% once the price breaks above the
#XAIUSDT — Descending Triangle: Ready for Takeoff or Breakdow#XAI
The price is moving within a descending channel on the 1-hour timeframe and has reached the lower boundary. It is now poised for a bounce and is expected to retest this boundary.
The Relative Strength Index (RSI) indicates a downward trend, which is likely to continue given the overbought conditions.
A key support zone has been identified in green at 0.00712. The price has bounced off this zone several times, making it a strong support level.
The price is trending towards the 100-period
#XAIUSDT — Descending Triangle: Ready for Takeoff or Breakdow#XAI
The price is moving within a descending channel on the 1-hour timeframe and has reached the lower boundary. It is now poised for a bounce and is expected to retest this boundary.
The Relative Strength Index (RSI) indicates a downward trend, which is likely to continue given the overbought conditions.
There is a key support zone (in green) at 0.00705. The price has bounced off this zone several times, making it a strong support level.
The price is trending towards the 100-period moving a
#XAIUSDT — Descending Triangle: Ready for Takeoff or Breakdow#XAI
The price is moving within a descending channel on the 1-hour timeframe and has reached the lower boundary. It is now poised for a bounce and is expected to retest this boundary.
The Relative Strength Index (RSI) indicates a downward trend, which is likely to continue given the overbought conditions.
There is a key support zone (in green) at 0.00923. The price has bounced off this zone several times, making it a strong support level.
The price is trending towards the 100-period moving a
#XAIUSDT — Descending Triangle: Ready for Takeoff or Breakdow#XAI
The price is moving within a descending channel on the 1-hour timeframe and has reached the lower boundary. It is now poised for a bounce and is expected to retest this boundary.
The Relative Strength Index (RSI) indicates a downward trend, which is likely to continue given the overbought conditions.
There is a key support zone (in green) at 0.00882. The price has bounced off this zone several times, making it a strong support level.
The price is trending towards the 100-period moving a
#XAIUSDT — Descending Triangle: Ready for Takeoff or Breakdow#XAI
The price is moving within a descending channel on the 1-hour timeframe and has reached the lower boundary. It is now poised for a bounce and is expected to retest this boundary.
The Relative Strength Index (RSI) indicates a downward trend, which is likely to continue given the overbought conditions.
There is a key support zone in green at 0.00875. The price has bounced off this zone several times, making it a strong support level.
The price is trending towards the 100-period moving ave
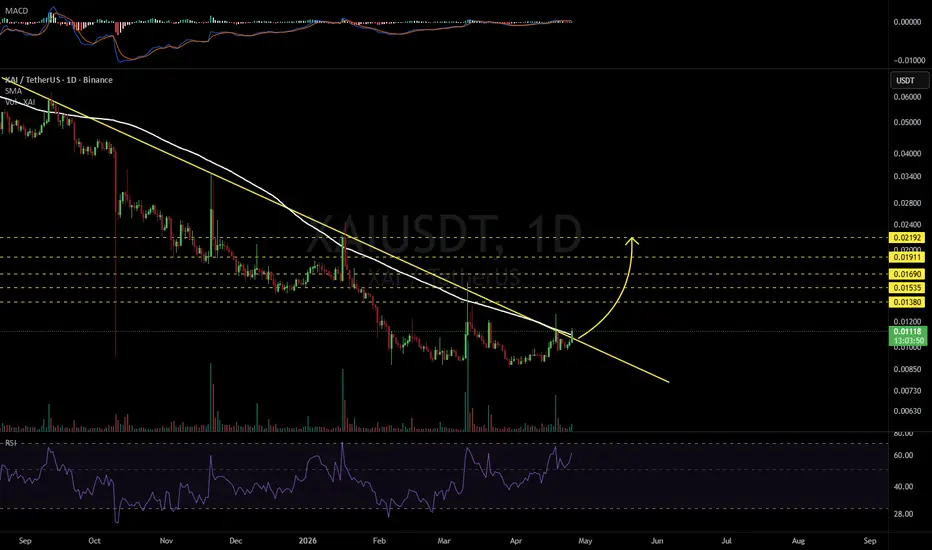
XAIUSDT 1DKeep an eye on the #XAI daily chart. It is attempting to break out above the descending resistance and the daily SMA100. If that occurs, the upside targets are:
🎯 $0.01380
🎯 $0.01535
🎯 $0.01690
🎯 $0.01911
🎯 $0.02192
⚠️ Always remember to use tight stop-losses and maintain proper risk management.
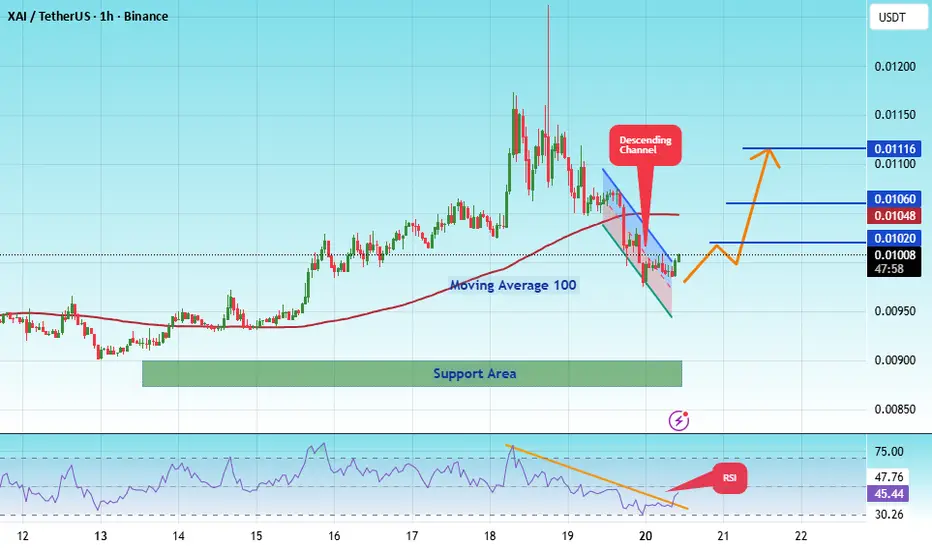
#XAI/USDT — Descending Triangle: Ready for Takeoff or Breakdow#XAI
The price is moving within a descending channel on the hourly timeframe. It has reached the lower boundary and is trending towards a bounce. A retest of this boundary is expected.
The Relative Strength Index (RSI) indicates a downward trend, and this trend is likely to continue due to the overbought condition.
A key support zone (in green) was found at 0.0100, and the price has bounced off this zone several times, making it a strong support level.
The price is trending towards the 100-p
#XAIUSDT — Descending Triangle: Ready for Takeoff or Breakdow#XAI
The price is moving within a descending channel on the hourly timeframe. It has reached the lower boundary and is trending towards a bounce. A retest of this boundary is expected.
The Relative Strength Index (RSI) indicates a downward trend, and this trend is likely to continue due to the overbought condition.
A key support zone has been identified in green at 0.00880, and the price has bounced off this zone several times, making it a strong support level.
The price is trending towards