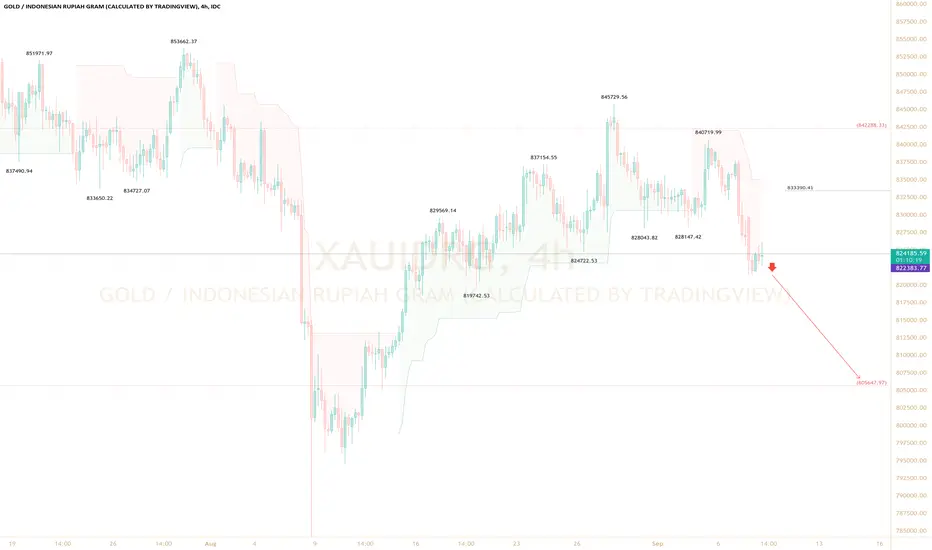
gold price📈 Trend Overview
Overall trend: Strong uptrend since early August 2025.
The price has moved within a rising channel (drawn with two parallel blue lines).
Recently, gold has touched the lower boundary of the channel — a critical area for potential trend continuation or breakdown.
🔍 Current Price Action
Current price: ~IDR 2,123,000 per gram.
Resistance zone: Around 2,320,000 – 2,470,000 — price failed to sustain this level twice, forming a double-top–like structure.
Support zone: Around 2,070,000 — marked by your note and coincides with the channel support trendline.
If this level breaks, the next strong support lies near 1,730,000–1,750,000, aligning with the previous base from early September.
⚙️ Momentum and Pattern Insight
Short-term trend: Weakening — the slope of the last leg down is sharp.
Momentum: Selling pressure increasing; candles show lower highs and lower lows.
Pattern: Possible rising wedge breakdown (bearish structure) forming as price exits the upward channel.
If confirmed, target area would be:
First target: ~2,070,000 (short-term support)
Second target: ~1,730,000 (wider correction target)
🧭 Scenarios
Bullish case (rebound)
Price bounces off 2,070,000, regains footing inside the channel.
Must close above 2,180,000 on strong volume to confirm recovery.
Upside targets: 2,280,000 → 2,320,000 → 2,470,000.
Bearish case (breakdown)
A decisive break and close below 2,070,000 could lead to accelerated selling.
Potential correction toward 1,730,000 — the lower blue projection line in your chart.
💡 Summary
Aspect Observation Implication
Trend Uptrend but weakening Watch for channel break
Momentum Bearish short-term Possible correction
Key Support 2,070,000 Crucial pivot for next move
Key Resistance 2,320,000 Must break for bullish continuation
Risk Level Elevated Protect profit if holding long
In-depth trading ideas
Gold in Monthly Chart "mengkhawatirkan" concerning!FX_IDC:XAUIDRG
IF volume declines and breaks the fibo 0.5; it would be a nightmare for gold.
Fundamentally, gold has been massively collected by some major countries in the last few years. If they got an economic crisis, such as China with Evergrande, they would sell Gold as one of their assets to stimulate their people economically.
#greedycreatesdecentralized
GOLD IDR 31 year bullish cycleThanks for viewing,
This just comes after looking at gold vs a number of different currencies like XAU/AUD which and XAU/NZD both of which have set new all time highs. The value of gold is one thing, the value of your home currency is a another thing. This is why people hold gold - to protect themselves from the slow and steady (or not so slow and steady at times) devaluation of the currency.
Since the overseas markets are mostly down over the past 18 months, bond yields are near all time lows, and central banks are seemingly starting a new monetary easing (currency devaluation) cycle there seems not to be many reliable stores of value in the market. Except much maligned but very reliable gold that has played that role countless times over thousands of years. Here it is going parabolic once again - a mix of rising USD gold prices and rupiah depreciation vs USD.
Normally I view parabolic moves with a high degree of suspicion, and if gold sets new all-time highs in USD terms - which a lot of people expect to happen - who knows how high that will be in IDR terms. Gold is well utilised in Indonesia as a store of value after recent (2013 to now) steady and the sharper steeper devaluations on 1998. I wonder if, looking back at the gold/idr price since 1997 you can point to a time where it would not have been a good time to buy gold? Because in a lot of economies, there is no such time. The right time to buy gold in a weak currency is now.