XAUUSD 30M Institutional Market Analysis | Liquidity & SMSGold is currently trading inside a corrective structure after a strong bearish move from the previous high. Price has created a consolidation range and is now approaching the Weak Low / Liquidity Zone, where institutional buyers may look for a liquidity sweep before the next expansion.
From a Smart Money Concepts perspective, the market is showing signs of potential accumulation. The previous downside move collected sell-side liquidity, while the current zone acts as a possible demand area. A valid bullish reaction requires confirmation through CHoCH (Change of Character) and BOS (Break of Structure) before expecting a continuation toward higher liquidity.
Bullish Scenario: If price sweeps the Weak Low area and holds the demand zone, buyers may target:
First resistance: 4,032–4,050
Next liquidity target: Strong High around 4,110–4,120
A break and hold above the resistance zone would confirm stronger bullish momentum.
Bearish Scenario: If sellers maintain control and price breaks below the Weak Low zone, the market may continue searching for deeper liquidity before any reversal.
Key Technical Levels:
Liquidity / Demand Zone: 3,995–4,010
Resistance Zone: 4,032–4,050
Major Target: 4,110–4,120 Strong High
Structure Confirmation: CHoCH + BOS
Fundamental View: Gold is currently influenced by U.S. Dollar strength, Treasury yields, and expectations around Federal Reserve policy. A stronger dollar and higher yields can pressure gold, while geopolitical uncertainty and safe-haven demand can support upside moves. �
Reuters +1
Today’s focus remains on Federal Reserve expectations and upcoming economic data, as traders are watching whether monetary policy signals support the dollar or increase demand for gold as a hedge. �
Reuters
Summary:
Gold is positioned at a critical liquidity area. The market is likely to seek liquidity first, and the next major move depends on whether buyers defend the demand zone or sellers continue the bearish structure. Confirmation is required before execution.
Spot Gold / Silver Diff
No trades
No trades
In-depth trading ideas
Gold 30Min Engaged ( Bullish Reversal Detected )HANZO MARKET LIQUIDITY REPORT
Gold
Timeframe: 30min (Volume Basis)
Scale: Higher Timeframe Context / Deep Volume analysis
━━━━━━━━━━━━━━━━━━━━━━
Market Observation
This analysis is focusing on structural behavior, liquidity zones, Volume analysis
and key areas of interest within the current range.
━━━━━━━━━━━━━━━━━━━━━━
Market Bias
Full liquidity Map
━━━━━━━━━━━━━━━━━━━━━━
🔥Bullish Reversal
Key Volume Zone : 4075 Area
━━━━━━━━━━━━━━━━━━━━━━
Structure Factors:
• Higher timeframe Volume reaction level
• High-volume / Hidden
• Range Defend structure
• Volume Stacking
• Quarter Volume
XAUUSD | Institutional Liquidity Decision ZoneGold is trading within a critical institutional decision area where liquidity and market structure remain the primary focus. A sustained hold above 4110 favors bullish continuation toward internal and external buy-side liquidity. Conversely, a confirmed break below 4110 would invalidate the current bullish framework and increase the probability of bearish continuation toward lower liquidity objectives. Traders should wait for confirmation before execution and maintain disciplined risk management.
Gold 30Min Engaged ( Bearish Reversal Detected )HANZO MARKET LIQUIDITY REPORT
Gold
Timeframe: 30min (Volume Basis)
Scale: Higher Timeframe Context / Deep Volume analysis
━━━━━━━━━━━━━━━━━━━━━━
Market Observation
This analysis is focusing on structural behavior, liquidity zones, Volume analysis
and key areas of interest within the current range.
━━━━━━━━━━━━━━━━━━━━━━
Market Bias
Full liquidity Map
━━━━━━━━━━━━━━━━━━━━━━
🔥Bearish Reversal
Key Volume Zone : 4080 Area
━━━━━━━━━━━━━━━━━━━━━━
Structure Factors:
• Higher timeframe Volume reaction level
• High-volume / Hidden
• Range Defend structure
• Volume Stacking
• Quarter Volume
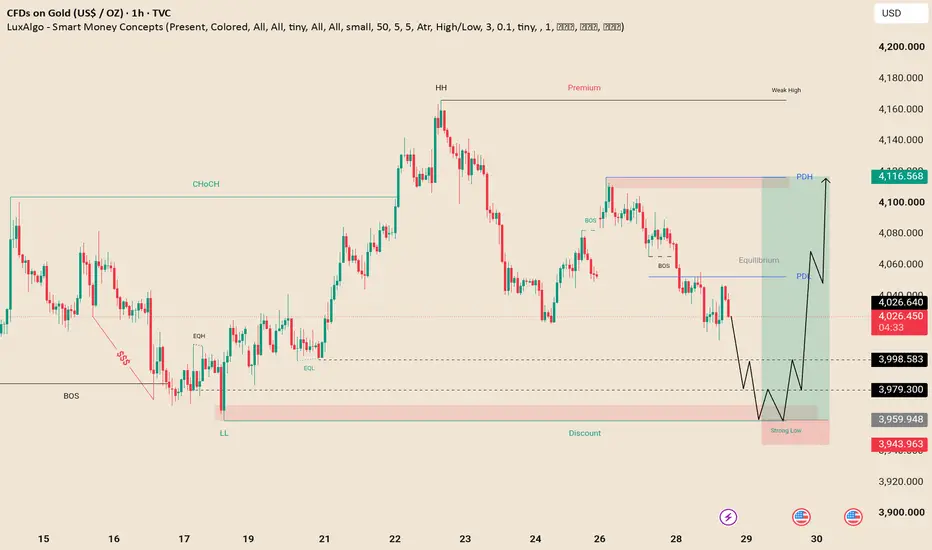
XAUUSD Bullish Reversal Setup from Discount ZoneGold is currently trading inside a key discount area, where price is approaching a strong demand/support zone that has previously attracted buying interest. The chart suggests that liquidity may be taken below the recent lows before a potential bullish reaction.
The projected scenario looks for a recovery from the discount zone, followed by a move back toward the Previous Day Low (PDL) and Previous Day High (PDH) if buyers regain momentum. A confirmed bullish market structure shift and strong price action would strengthen this outlook.
This analysis is based on market structure, liquidity concepts, and key support/resistance areas. It represents one possible scenario, not a prediction. Always wait for confirmation and apply proper risk management before making any trading decisions.
📌 Key Levels:
Support Zone: 3,960–3,980
Current Price: ~4,028
Resistance / Target Area: 4,050 → 4,116 (PDH)
This chart is shared for educational and informational purposes only and does not constitute financial or investment advice. Always perform your own analysis before entering any trade.
XAUUSD 4H | Liquidity Sweep & Supply Demand MappingXAUUSD 4H | Smart Money Structure + Liquidity Reaction Zones
Detailed Candle By Candle Educational Analysis (With Reasons)
1. Strong Bullish Recovery Phase
Market started with a strong recovery move where multiple bullish candles formed from the lower area. These candles showed that buyers were actively defending the support region and absorbing selling pressure. Long lower wicks indicated rejection from lower prices, showing that sellers were losing control.
Reason:
Buyers entered from discounted levels and created upward momentum after liquidity was collected from previous lows.
---
2. Formation of Higher Highs & Short-Term Strength
After the initial recovery, bullish candles pushed price higher and created a temporary change in momentum. The candles showed strong body formation with less rejection, indicating aggressive buying participation.
Reason:
Market participants started targeting previous highs where liquidity was resting.
---
3. Arrival Into Supply Zone
As price reached the upper orange supply area, candles started losing strength. Small bodies and upper wicks appeared, showing rejection from higher levels. This area became important because previous sellers were waiting here.
Reason:
Supply zone contained seller orders, causing buying momentum to slow down.
---
4. Bearish Rejection Candles
After testing resistance, strong bearish candles appeared and pushed price lower. These candles confirmed that sellers were defending the supply area and rejected the attempt to move higher.
Reason:
Sellers took control after price failed to break the resistance zone.
---
5. Break of Structure (BOS) Candles
The bearish move continued with strong impulsive candles breaking previous support levels. This BOS confirmed that market structure shifted in favor of sellers.
Reason:
Lower lows and lower highs started forming, confirming bearish market structure.
---
6. Range Formation & Liquidity Building
After the strong decline, price entered consolidation. Candles became smaller and moved sideways between support and resistance. This phase showed accumulation of liquidity on both sides.
Reason:
Smart money often creates a range before the next expansion move.
---
7. Demand Zone Reaction
When price reached the blue demand zone, sellers started losing momentum. Multiple candles showed rejection from the lower area, proving that buyers were defending this zone.
Reason:
Demand zone contained buying interest where institutions may accumulate positions.
---
8. CHoCH (Change of Character) Formation
Price created CHoCH after breaking minor highs from the consolidation area. This showed that short-term order flow changed and buyers gained temporary control.
Reason:
Buyers successfully shifted short-term momentum after defending demand.
---
9. Retest & Failed Continuation
After moving upward, price returned toward the trendline and resistance area. Candles became weaker with smaller bodies, showing uncertainty between buyers and sellers.
Reason:
Market was testing resistance strength before choosing the next direction.
---
10. Current Trendline Reaction
The latest candles are approaching the dynamic trendline resistance. Price is respecting this descending structure, showing that sellers are still active around higher levels.
Reason:
Trendline acts as a dynamic resistance where sellers continue to defend positions.
---
11. Liquidity Perspective
Below the current structure, liquidity remains around previous lows. A sweep of these lows can happen before a strong reversal or continuation move.
Reason:
Markets often target stop liquidity before making the next institutional move.
---
12. Final Educational Summary
XAUUSD 4H is showing a mixed structure with bearish pressure from the trendline and resistance zones, while buyers are defending the demand area. The important factor is confirmation.
Bullish Confirmation:
Break and hold above resistance
Strong bullish BOS
Successful retest
Bearish Confirmation:
Rejection from trendline
Break below demand zone
Liquidity sweep of weak lows
Trading Lesson:
Do not follow candles alone. Combine Market Structure + Trendline + Liquidity + Supply/Demand Zones for a professional SMC analysis.
XAUUSDHello Traders! 👋
What are your thoughts on Gold?
Gold has been trading within the highlighted support and resistance zones for several weeks, forming a well-defined trading range. This price action reflects an ongoing corrective and sideways phase, with the market repeatedly rotating between the upper and lower boundaries of the range without establishing a sustained trend.
From a technical perspective, price has successfully broken above the descending trendline that had capped the market for weeks and is now completing a pullback toward the breakout area. As long as Gold remains above the highlighted support zone, our bias remains bullish, and we expect the short-term uptrend to continue toward the highlighted resistance area, which aligns with the 0.50 and 0.618 Fibonacci retracement levels.
A decisive breakout and close above the highlighted resistance zone would confirm the end of the corrective phase, a breakout from the multi-week trading range, and the beginning of a new short-term bullish leg. Such a move would likely strengthen bullish momentum and pave the way for further upside.
On the other hand, a break below the highlighted support zone would invalidate the bullish scenario, increasing the likelihood of an extended corrective move toward lower support levels.
Finally, traders should remain cautious ahead of the market open. Given the latest geopolitical developments, there is a possibility that Gold opens with a price gap, which could result in elevated volatility during the first trading session of the week.
If you found this analysis helpful, please support it with a like and share your thoughts in the comments! Good luck with your trades!❤️
Xauusd Market Structure Update | Pullback Before Continuation?The market remains within a broader bearish trend despite the recent impulsive recovery from the 4,000 demand zone. After establishing a Change of Character (CHoCH) from the lows, price rallied aggressively into a key liquidity area, sweeping the Equal Highs (EQH) around 4,115–4,120 before encountering significant selling pressure.
The rejection from this resistance zone was followed by a Bearish Break of Structure (BOS) on the lower timeframe, suggesting that bullish momentum has weakened and the market is currently undergoing a corrective phase.
Price is now trading around the equilibrium (50%) of the recent bullish range, an area that often serves as a decision point between continuation and deeper retracement. A sustained hold above this region could attract buyers and support another attempt toward the resistance zone. Conversely, a decisive break below equilibrium may expose the discount area (4,035–4,045), with the higher-timeframe bullish order block near 4,000 remaining the next significant area of interest.
Key Levels
Resistance: 4,115–4,120 (Liquidity / Supply Zone)
Equilibrium: ~4,055 (50% of the recent impulse)
Buying Zone: 4,035–4,045 (Discount Area)
Major Order Block: 4,000–4,010 (Higher-Timeframe Demand)
Outlook
The current price action suggests a short-term correction within the recent bullish impulse. While the higher-timeframe demand remains intact, confirmation of renewed bullish strength would require a bullish market structure shift from the discount area. Failure to hold above the buying zone may increase the probability of a retest of the 4,000 order block before any meaningful continuation develops.
Disclaimer: This analysis is provided for educational purposes only and reflects a technical interpretation based on Smart Money Concepts (SMC). Financial markets involve risk, and no analysis can guarantee future price movements. Always wait for confirmation and apply appropriate risk management before making trading decisions.
XAUUSD – Bullish Continuation & Trend Reversal Setup📊 XAUUSD – Bullish Continuation & Trend Reversal Setup (8H)
🔍 Market Overview
Gold is showing early signs of a bullish reversal after breaking above the descending trendline and holding firmly above the major demand zone. The recent recovery indicates that selling pressure is weakening, while buyers are gradually regaining market control. Price is now approaching the Ichimoku Cloud, where a confirmed breakout could accelerate bullish momentum.
⸻
📈 Market Structure Insight
* Market Bias: Bullish
* Momentum: Improving
* Current Phase: Trend Reversal into Bullish Continuation
The market has completed a strong defense of the demand zone and is beginning to establish a sequence of higher lows. A sustained move above the Ichimoku Cloud would confirm the transition into a stronger bullish trend.
⸻
🚀 Trading Scenarios
✅ Bullish Scenario (Primary Bias)
Conditions:
* Price remains above the key demand zone.
* Buyers maintain higher lows after the trendline breakout.
* A confirmed close above the Ichimoku Cloud strengthens bullish continuation.
Trade Plan:
Look for buying opportunities on shallow pullbacks into support or after a confirmed breakout above the cloud.
🎯 Target 1: 4,170
🎯 Target 2: 4,300
⸻
❌ Bearish Invalidation Scenario
Conditions:
* Price falls back below the descending trendline.
* The demand zone fails to hold.
* Strong bearish momentum pushes price below recent swing lows.
Trade Plan:
A confirmed breakdown below the support area would invalidate the bullish outlook and increase the probability of a deeper correction.
🎯 Key Support Zone: 3,943 – 3,980
⸻
📍 Key Levels to Monitor
🟢 Immediate Resistance: 4,170
🟢 Major Resistance: 4,300
🔴 Immediate Support: 3,980
🔴 Major Support: 3,943
⸻
⚠️ Trading Perspective
The recent trendline breakout suggests that bearish momentum is fading and buyers are attempting to regain control. As long as price remains above the highlighted support zone, the bullish recovery remains valid. A decisive breakout above the Ichimoku Cloud would provide strong confirmation for continued upside toward the projected targets.
⸻
🧠 Professional Insight
This setup is supported by:
* Descending trendline breakout.
* Strong demand zone support.
* Improving bullish momentum.
* Higher-low market structure.
* Potential Ichimoku Cloud breakout confirmation.
The highest-probability long entries are typically found on controlled pullbacks into support or after a confirmed breakout above the cloud, rather than chasing impulsive bullish candles.
⸻
🛡️ Risk Management
* Risk only 1–2% of trading capital per position.
* Place your stop-loss below the major demand zone.
* Wait for bullish confirmation before entering.
* Avoid excessive leverage during volatile sessions.
* Always respect invalidation levels and protect your capital.
Disclaimer: This analysis is for educational purposes only and should not be considered financial or investment advice.
GOLD Price Update – Clean & Clear ExplanationGold is currently trading inside a highly volatile range after failing to sustain momentum above the recent resistance zone. The latest rejection from the 4,075–4,105 supply area suggests that sellers are still defending higher prices, while buyers continue to protect the psychological support around 4,000.
Technically, the chart shows a strong bearish rejection after a sharp upward spike, indicating that liquidity above recent highs may have been swept before sellers regained control. As long as price remains below the 4,100–4,145 resistance zone, bearish pressure could continue. A failure to reclaim this area may trigger another decline toward 4,000, followed by 3,980 and potentially 3,970 if selling momentum accelerates.
On the bullish side, buyers need a strong breakout and sustained close above 4,105–4,145 to invalidate the current bearish outlook. Such a move could attract fresh buying interest and open the door for a rally toward higher resistance levels.
Overall Bias: Short-term bearish below 4,105, with sellers targeting the 4,000–3,970 region. A confirmed breakout above 4,145 would shift momentum back in favor of the bulls.
XAUUSD 30M Market Outlook | Key Order Block LevelsGold is currently trading around the 4,041 area, where price is consolidating after a bearish move. The chart highlights two important institutional zones: a lower demand Order Block near 4,000 and an upper supply Order Block around 4,105–4,120.
The current price action remains range-bound, so patience is important. A clean reaction from either key zone, supported by a Market Structure Shift (MSS) or strong confirmation candle, may provide the next directional opportunity.
The projected scenario suggests that price may first sweep nearby liquidity or revisit the lower Order Block before attempting a bullish expansion toward the upper Order Block. However, this remains a market outlook, not a guaranteed prediction.
Trading Rules:
• Wait for confirmation before entering.
• Avoid chasing price in the middle of the range.
• Use proper risk management and a predefined stop-loss.
• Keep risk per trade controlled and maintain a favorable risk-to-reward ratio.
• High-impact news may increase volatility and cause false breakouts.
Key Levels:
🔹 Demand Zone: 4,000–4,005
🔹 Current Price Area: 4,040–4,055
🔹 Supply Zone: 4,105–4,120
This analysis is for educational purposes only and should not be considered financial advice.
SYMMETRICAL TRIANGLE COMPLETIONXAU/USD — SYMMETRICAL TRIANGLE COMPLETION | NEXT BEARISH IMPULSE TOWARD 3925–3940
Timeframe: 2H | Reference price: 4077 | Structure: Post-decline contracting correction
EXECUTIVE THESIS
XAU/USD remains inside a large symmetrical triangle formed after a significant bearish impulse.
The triangle is interpreted as a corrective contraction rather than a confirmed accumulation structure. Price has produced a sequence of lower highs beneath the descending resistance boundary while the rising lower boundary has temporarily contained successive selloffs.
My primary expectation is that this corrective triangle is approaching completion and that the market may transition into the next bearish impulsive phase.
The bearish thesis is not confirmed merely because price remains inside the triangle. Confirmation requires the loss of internal support, displacement below the rising boundary, and subsequent acceptance beneath the broken structure.
The main downside objective currently marked on the chart is the 3925–3940 support and liquidity zone.
The complete invalidation condition is a confirmed breakout and acceptance above the descending upper boundary of the triangle. Such a development would shift the structure from bearish continuation toward a potential bullish expansion.
1. MACRO CATALYST LAYER
The dominant macro regime is a combination of:
Restrictive real-yield pressure.
Federal Reserve policy uncertainty.
Persistent inflation risk.
Geopolitical risk originating from the Middle East.
The Federal Reserve maintained its policy rate at 3.50%–3.75%, but the decision included three dissenting votes in favor of a rate increase.
This division indicates that inflation risk remains material and that the market cannot confidently price an immediate transition toward monetary easing.
USD Channel
A stable-to-firmer U.S. dollar creates a negative translation effect for dollar-denominated gold.
As long as the dollar remains supported by relatively restrictive U.S. policy expectations, upside attempts in gold may remain corrective rather than impulsive.
A sharp dollar breakdown would weaken the bearish gold scenario and increase the probability of an upside triangle breakout.
Real-Yields Channel
The real-yield channel is currently the primary bearish macro force.
Higher nominal Treasury yields, combined with persistent inflation uncertainty, raise the opportunity cost of holding a non-yielding asset such as gold.
For the bearish continuation scenario to remain fundamentally aligned, Treasury yields should remain elevated or extend higher following U.S. inflation and growth data.
A sustained decline in real yields would challenge the bearish structure even before the upper triangle boundary is broken.
Risk-Sentiment Channel
Escalating geopolitical tension creates safe-haven demand for gold.
However, the current geopolitical shock is also lifting energy-price and inflation risks. That transmission can generate higher yields and a more restrictive Federal Reserve path, offsetting the direct safe-haven bid.
Therefore, the present market is not a conventional risk-off environment in which gold rises mechanically.
The more accurate classification is:
Inflationary geopolitical risk with restrictive-yield pressure.
Liquidity Channel
The Federal Reserve is maintaining ample reserves, but there is no broad liquidity expansion strong enough to override the effect of elevated yields.
Liquidity conditions are therefore neutral-to-restrictive for gold rather than decisively supportive.
Catalyst Classification
Primary classification: Inflationary.
Secondary classification: Policy-uncertain.
Growth effect: Potentially growth-negative if elevated yields and energy prices persist.
Structural driver: Elevated real yields and unresolved inflation risk.
Short-term noise: Event-driven safe-haven buying that fails to produce structural acceptance above resistance.
2. SENTIMENT AND CROSS-ASSET FLOW
The recent market reaction shows a conflict between risk-off demand and yield-driven pressure.
Equities have shown vulnerability as elevated long-term borrowing costs pressure valuations.
The U.S. dollar remains supported by policy divergence and safe-haven demand.
Treasury yields remain the more important transmission mechanism for gold.
Geopolitical demand is preventing a cleaner bearish repricing but has not produced a confirmed bullish breakout.
Gold is currently failing to fully benefit from geopolitical stress.
This divergence suggests that higher yields and inflation-driven policy expectations are dominating the traditional safe-haven relationship.
The current movement is therefore better classified as:
Primary: Real-yield repricing.
Secondary: Positioning adjustment inside consolidation.
Not yet confirmed: Broad dollar-debasement trade.
Not yet confirmed: Unconditional flight-to-safety demand.
3. TECHNICAL STRUCTURE
The broader chart shows a major decline followed by a contracting corrective structure.
The triangle consists of:
A descending upper boundary connecting successive lower highs.
An ascending lower boundary connecting the late-June and mid-July swing lows.
Repeated internal rotations showing declining directional conviction.
Price compression ahead of a potential volatility expansion.
This structure is consistent with post-impulse consolidation.
Because the triangle formed after a bearish leg, the contextual probability currently favors bearish continuation. However, symmetrical triangles are directionally neutral until one boundary is broken and accepted beyond.
Key Resistance Levels
4095–4115: Recent swing-high cluster and visible buy-side liquidity.
4140–4160: Descending triangle boundary and primary structural invalidation region.
Above 4160: Potential transition toward a bullish expansion regime.
Key Support Levels
4020–4005: Immediate internal support and recent local-low cluster.
3970–3985: Rising triangle boundary near the current time axis.
3925–3940: Primary projected support and downside objective.
4. LIQUIDITY AND ORDER-FLOW CONTEXT
The recent highs around 4095–4115 contain visible buy-side liquidity.
A temporary move into this region would not automatically invalidate the bearish scenario. It could represent a liquidity sweep before bearish displacement.
The critical distinction is the behavior following any sweep:
Sweep followed by immediate rejection: Supports bearish continuation.
Break above 4115 without acceptance: Potential liquidity grab only.
Sustained acceptance above 4115: Weakens the immediate bearish thesis.
Displacement and acceptance above the upper trendline: Invalidates the bearish triangle interpretation.
On the downside, the 4020–4005 area represents the first meaningful sell-side liquidity pool.
A sharp break through this region would indicate long liquidation and potentially fresh bearish positioning.
The quality of the move is important:
Sharp, wide-range bearish candles: Displacement and probable institutional repricing.
Slow decline with overlapping candles: Grind without sufficient confirmation.
Break followed by continuation beneath support: Acceptance.
Break followed by immediate recovery above support: Rejection and failed breakdown.
5. POSITIONING AND STRUCTURAL BIAS
Narrative Bias
The symmetrical triangle is interpreted as the final corrective phase following the previous bearish impulse.
The preferred narrative is that price is preparing to begin another downside expansion toward 3925–3940.
Structural Confirmation
The narrative becomes structurally confirmed only after:
Price loses the 4020–4005 internal support region.
The rising triangle boundary is broken with clear bearish displacement.
A retest of the broken structure fails.
Price establishes acceptance beneath approximately 3970–3985.
Intraday Bias
Neutral-to-bearish while price remains below 4095–4115.
The intraday bearish bias strengthens below 4020 and becomes confirmed below the rising triangle boundary.
Intraday Invalidation
Sustained acceptance above 4115 would invalidate the immediate short setup and expose the upper triangle boundary.
Medium-Term Bias
Bearish continuation while price remains beneath the descending triangle resistance at approximately 4140–4160.
Medium-Term Invalidation
A confirmed 2H close above the descending boundary, followed by successful support acceptance above the breakout level, would invalidate the medium-term bearish thesis.
A wick above the boundary without follow-through would not be sufficient.
6. CONTINUATION SCENARIO — PRIMARY
Required Conditions
Price fails to establish acceptance above 4095–4115.
A rejection or liquidity sweep forms near the recent highs.
The 4020–4005 support cluster is broken.
Bearish displacement reaches and closes below the rising triangle boundary.
Trigger
A decisive 2H breakdown below the rising triangle boundary with an expanded candle body and limited lower-wick rejection.
Confirmation
A failed retest of the broken boundary or the 3970–3985 region as resistance.
The strongest confirmation would be a lower-timeframe bearish market-structure shift during the retest.
Execution Framework
Aggressive entry: Bearish rejection from 4095–4115 after a liquidity sweep.
Conservative entry: Breakdown and failed retest of 4020–4005.
Highest-confirmation entry: Breakdown and retest of the rising triangle boundary.
Downside Objectives
4020–4005: Initial liquidity objective.
3970–3985: Triangle boundary and confirmation level.
3925–3940: Primary projected target and support zone.
The 3925–3940 zone is currently treated as the first major destination rather than a guaranteed final bottom.
Price behavior must be reassessed at this zone before projecting lower targets.
Continuation Invalidation
Sustained acceptance above 4115 invalidates the immediate bearish entry model.
A confirmed breakout above 4140–4160 invalidates the complete bearish continuation scenario.
7. REVERSAL SCENARIO — ALTERNATIVE
The bullish scenario becomes relevant if the market refuses to break the rising triangle support and instead removes the upper structural boundary.
Required Structural Failure
The 4020–4005 support area continues to hold.
Any downside liquidity sweep is rapidly reclaimed.
Price breaks through 4095–4115 with bullish displacement.
The descending triangle boundary is breached.
Bullish Trigger
A decisive 2H close above approximately 4140–4160.
Bullish Confirmation
A successful retest of the broken descending boundary as support, followed by a higher low and renewed bullish displacement.
Bullish Invalidation
A breakout above the triangle followed by an immediate close back below the upper boundary would indicate a failed breakout.
Loss of the reclaimed 4095–4115 area after the breakout would further weaken the bullish scenario.
8. EVENT-RISK FRAMEWORK
The most important near-term economic catalysts are U.S. PCE inflation, Core PCE, GDP and labor-market data.
Hot Inflation / Strong Growth Outcome
Likely reaction: Higher Treasury yields.
Likely USD reaction: Firmer dollar.
Likely gold reaction: Bearish, particularly if 4020–4005 breaks.
Technical implication: Increased probability of downside triangle resolution.
Soft Inflation / Weak Growth Outcome
Likely reaction: Lower yields and reduced tightening expectations.
Likely USD reaction: Weaker dollar.
Likely gold reaction: Supportive.
Technical implication: Increased probability of a move through 4115 and a test of the upper triangle boundary.
Geopolitical Escalation
The reaction depends on whether the safe-haven channel or the inflation channel dominates.
Gold higher while yields fall: Genuine risk-off demand.
Gold lower while oil and yields rise: Inflationary tightening shock.
Gold and USD rising together: Defensive safe-haven positioning.
Gold failing while USD rises: Dollar and real-yield dominance.
9. STRATEGIC DECISION
Market Classification: Bearish continuation setup inside unresolved symmetrical consolidation.
Primary Driver: Elevated real yields and persistent inflation-related policy uncertainty.
Secondary Driver: U.S. dollar resilience and the market's inability to establish acceptance above recent buy-side liquidity.
Counterforce: Geopolitical safe-haven demand.
Current Tactical Stance:
Maintain a conditional bearish bias while price remains below 4095–4115, but avoid treating the projection as confirmed before support is broken.
The preferred trade is not an unconfirmed short in the middle of the triangle.
The preferred execution is either:
A confirmed rejection after a sweep of 4095–4115.
A breakdown and failed retest of 4020–4005.
A confirmed break and retest beneath the rising triangle boundary.
The main projected destination is 3925–3940.
A confirmed breakout and acceptance above 4140–4160 would invalidate the entire bearish structure and shift the strategic bias toward bullish continuation.
FINAL VIEW
The triangle appears mature enough for a volatility expansion, and the preceding bearish impulse gives the downside scenario contextual priority.
However, the setup remains a forecast until price removes support with displacement and establishes acceptance below the lower boundary.
Below the rising boundary: bearish impulse confirmation.
Above the descending boundary: bearish thesis invalidation and bullish regime transition.
This analysis presents a conditional market framework and is not financial advice. Position size and risk should be adjusted for elevated volatility surrounding major U.S. economic releases.
GOLD - Ahead of the Fed meeting. Bearish trendICMARKETS:XAUUSD is rebounding from the 4000 level but remains trapped within the 4010–4050 trading range. At the same time, the U.S. Dollar Index has entered a consolidation phase as markets await the upcoming Federal Reserve meeting
Gold is trading cautiously ahead of the Fed decision amid renewed geopolitical tensions. The key catalyst will be the Fed's guidance on the future path of interest rates. Any hint of a dovish shift could fuel a rally in gold, while a hawkish message would likely restore downside pressure.
Bullish drivers: Dovish Fed rhetoric, A weaker U.S. dollar, Lower rate expectations, Geopolitical de-escalation
Bearish drivers: Hawkish Fed guidance (persistent inflation concerns, hints of further tightening, a more hawkish voting balance), Escalation of geopolitical tensions, supporting both the U.S. dollar and oil prices
Resistance levels: 4070, 4083, 4116
Support levels: 4011, 3983
Fundamentally, there are reasons to expect the Federal Reserve to maintain a hawkish tone. From a technical perspective, gold remains under pressure within a broader bearish trend. As a result, the upcoming news-driven volatility could trigger a retest of the 4070–4083 resistance zone—or even 4116—before the downtrend resumes toward the 4000–3950 area.
Best regards,
R. Linda
Trading Rewards Survival, Not ExcitementMost new traders chase the wrong goal.
Bigger targets. Bigger payouts. More accounts.
But prop firms do not pay you for having the best expectancy on a spreadsheet. They pay you for surviving long enough to withdraw.
A 30% win-rate system targeting 3R can look similar on paper to a 65% win-rate system targeting 1R. In reality, the losing streaks, drawdown and psychological pressure can feel completely different. 📊 Consistency Beats “More Profitable”
On a prop account, variance is the enemy. Tight drawdown rules punish long losing streaks—even when the strategy may be profitable over a large sample.
🎯 That is why Model 1 exists
Model 1 targets 50% of the CLS range, usually around 1:1 to 1.2R. It is not designed to look exciting. It is the bread-and-butter setup: higher win rate, repeatable execution and less psychological damage. 🎯 Model 2 targets the full range.
It becomes more useful after Model 1 has created a profit buffer not when it is your only plan for paying rent. 🧪 One percent of $100K is still more than ten percent of $5K. Scaling capital matters more than forcing heroic returns from one small account.
🎯 Stage 1: Build the Edge
Phase one is not about payouts. It is about answering one question:
⁉️ Can I execute the same setup correctly 50 times in a row?
Start with one model. Backtest toward 200 logged trades . Spend Weeks 1–4 studying and marking charts with no live money.
📍 For every Model 1 setup, follow the same sequence:
HTF CLS range → premium/discount → liquidity → manipulation → displacement → order-block close → fixed stop → 50% target.
‼️ No manipulation, no trade. No moving the stop. No negotiating with the target after entry
Use fixed R:R or 50% so your data tests the quality of your setup selection not whether random exit management rescued the trade and no partials. This is one shot trade.
📓 Journal Like a Scientist
Log the setup, HTF context, session, manipulation, confirmation timeframe, stop, target, R:R, entry screenshot and one honest line about your state of mind.Then review every Saturday with no open positions and no pressure. 🧪 Track three things:
- What happened—continuation or reversal, trend or range
- Where it happened—premium, discount, inside or outside the dealing range
- When it happened—session, day and time
If your win rate is weak, do not call yourself a failure. Find the variable that appears in your losses and test removing it. Messy Asia range. Entering during the sweep. No order-block close. Premium longs.
💰 Stage 2: Make Payouts Boring
Your first payout is proof of process not permission to start living like a full-time trader.
Trade one funded account until execution becomes automatic. Use fixed risk around 0.7% where the firm’s rules and your personal limits allow it. Take Model 1 targets. Protect the week.
Keep separate income while consistency is fragile. The moment you need today’s trade to pay a bill, every stop loss becomes negotiable.
Save most of the payout. Reinvest a small part. Slow is smooth. Smooth is fast.
🚀 Stage 3: Scale Capital, Not Ego
More accounts multiply good execution—but they also multiply mistakes. Do not copy one impulsive entry across twenty accounts and call it scaling. Group accounts into sections, trade a maximum of five at once, reach the payout objective, lock that section and rotate to another accounts section.
If one week goes wrong, you damage one section—not the entire operation.
Keep Model 1 as the consistency engine. Use Model 2 selectively when the setup qualifies and booked profit provides a buffer. See details about this risk management i n this article.
Reinvest roughly 20–30% of payouts into more funded capital while saving the rest. Keep journaling. Keep the Saturday review.
📍The path is simple:
1️⃣ Build one repeatable edge.
2️⃣ Turn that edge into boring payouts.
3️⃣ Scale the capital without scaling your ego.
At scale, your survival rate matters more than one heroic month. The traders who last are the ones who can repeat a good process for years. And mainly who can do the work before the profits comes
✅ Be Patient, do deep focused work
Can you work on patiently on your trading business? Many people cant. My recent social experiment confirms it. I created two articles on the second one I added word - LATER. And as you can see 3x less people clicked on it. Why ? Because everyone looking for information that solve trading now. Not later. Unfortunately it's not how it works in the trading. You work on your system and processes and profits comes later. Not other way around.
Adapt useful, Reject useless and add what is specifically yours.
David Perk
🚀Boost | 🔁 Share | 💬 Comment | ✅ Follow for more Education
XAUUSD 4H | Market Structure + Key Liquidity ZonesMarket Structure Overview:
XAUUSD is currently showing a mixed structure where price is moving inside a defined range between supply and demand zones. The market has created multiple BOS (Break of Structure) and CHoCH (Change of Character) signals, showing continuous battle between buyers and sellers. Price is still respecting important resistance and support levels, making these zones critical for the next major move.
Bearish Trendline Resistance:
The descending trendline from the higher levels is acting as dynamic resistance. Each rejection from this trendline shows that sellers are still defending the bearish pressure. As long as price remains below this resistance, sellers have the advantage and rallies may face selling pressure.
Major Supply Zone (4200–4230 Area):
The upper orange zone represents a strong supply area where sellers previously entered the market. If price returns to this zone, traders should watch for rejection, liquidity sweep, and bearish confirmation before considering short opportunities.
Key Resistance Level (4111 Area):
This level is acting as an important decision point. A strong breakout and retest above this area can indicate bullish strength and possible continuation toward higher resistance zones. Failure to break this level may result in another rejection.
Current Price Action Zone:
The current area shows market indecision between buyers and sellers. Candles are reacting around the middle of the range, meaning confirmation is required before entering any position. Professional traders avoid chasing moves and wait for clear structure confirmation.
Demand Zone (3985–3940 Area):
The blue highlighted zone represents buyer interest and a potential demand area. Price may react from this zone if sellers push lower. A strong bullish reaction from demand can create a recovery move, but buyers need confirmation through CHoCH and BOS.
Liquidity Zone / Weak Low (3900 Area):
The lower level represents a liquidity pool where stop orders may exist below previous lows. Smart Money may target this area to collect liquidity before making the next directional move.
SMC Analysis Perspective:
From a Smart Money Concept view, the market is currently searching for liquidity while respecting key supply and demand areas. The important focus remains on:
Trendline reaction
Liquidity sweep confirmation
BOS and CHoCH signals
Supply and demand zone reactions
Risk management before entries
Trading Plan Education:
Wait for price to reach key zones instead of entering in the middle of the range. Follow the market structure, respect support and resistance, and allow confirmation candles to guide the decision. Patience and discipline are important because high-quality setups appear only around important liquidity areas.
Overall Summary:
XAUUSD 4H is positioned between a strong resistance zone above and a demand zone below. A breakout above 4111 can open the path toward higher targets, while rejection from resistance can bring price back toward the 3985–3940 demand area. The next move depends on liquidity reaction and structure confirmation.
XAU/USD | A Huge Fall Ahead ? (READ THE CAPTION)By analyzing the #Gold chart on the 2H timeframe, we can see that price followed our bearish scenario exactly as expected. Gold entered a heavy sell-off, dropped toward $4017, and is currently trading around $4031. While most analysts were talking about further upside, I maintained my bearish outlook and expected this decline. Taking a view against the broader market sentiment required conviction, but once again price confirmed the scenario.
The previous analysis has now delivered more than 500 pips of movement, and in my view, the bearish move is not finished yet. As long as Gold remains below the nearby resistance levels, I expect another decline toward $4000 and eventually a move below this psychological level. After that, $3980 and $3960 could become the next downside targets. For now, my main bias remains bearish.
Please support me with your likes and comments to motivate me to share more analysis with you and share your opinion about the possible trend of this chart with me !
Best Regards , Arman Shaban
XAUUSD Technical Outlook: High-Probability Buy SetupXAUUSD Technical Analysis | Smart Money Perspective
XAUUSD is currently trading within a critical technical area where price is reacting from a well-defined demand zone after rejecting lower levels. The overall market structure remains constructive, with buyers attempting to regain momentum while approaching a significant supply zone overhead. This area is likely to determine the next directional move, making patience and confirmation essential before entering a position.
From a Smart Money perspective, recent price action suggests liquidity has been collected below support, followed by a strong recovery. The current consolidation may represent an accumulation phase before expansion. If buyers continue defending the demand zone and price breaks above the recent swing high with convincing volume, the bullish trend could resume toward the next institutional resistance levels.
🟢 Bullish Scenario
A sustained hold above the demand zone, followed by a confirmed Break of Structure (BOS), would strengthen the bullish outlook. A breakout above the supply zone could trigger fresh buying pressure and open the path toward higher resistance targets. Traders should wait for candle confirmation rather than entering on anticipation, as confirmation significantly improves trade quality.
🔴 Bearish Scenario
Failure to hold the current demand zone or repeated rejection from the overhead supply zone may shift momentum back in favor of sellers. A confirmed Change of Character (CHoCH) followed by a break below support would increase the probability of a deeper correction toward lower liquidity areas. In that case, bearish continuation setups become more favorable.
📌 Key Technical Levels
* Major Supply Zone: Primary resistance where selling pressure may emerge.
* Major Demand Zone: Strong support where buyers are expected to defend price.
* Liquidity Areas: Watch for sweeps above highs or below lows before the next impulsive move.
* Market Structure: BOS and CHoCH confirmations remain the most important signals for direction.
🎯 Trading Perspective
The current setup offers a favorable risk-to-reward opportunity, but the market is still at a decision point. Avoid chasing price inside the range. Instead, let the market confirm its intention through structure, volume, and candle closes. Whether trading the breakout or the rejection, disciplined execution and proper risk management should always take priority over prediction.
Smart Money Concepts Explained | Complete SMC Trading FrameworkSmart Money Concepts (SMC) Masterclass | Complete Trading Education Guide
This educational chart explains the complete Smart Money Concept (SMC) framework, showing how every candle represents the actions of buyers, sellers, institutions, and liquidity movements. Each candle has a purpose, and understanding its position, reaction, and structure helps traders read the market like professionals.
1. Market Structure & BOS (Break of Structure)
Every candle contributes to market structure. When price creates Higher Highs (HH) and Higher Lows (HL), buyers are in control. When price breaks a previous swing point, it creates a BOS, confirming trend continuation.
A strong bullish candle after breaking resistance shows buyer strength, while a strong bearish candle breaking support confirms seller dominance.
2. CHoCH (Change of Character)
CHoCH appears when candles stop following the previous trend and create a new structure. It is the first indication that market control may be shifting.
Example:
Bullish trend → price breaks previous low = possible bearish CHoCH.
Bearish trend → price breaks previous high = possible bullish CHoCH.
3. Support & Resistance
Candles repeatedly reacting from specific levels create important zones.
Multiple rejections from the same area show resistance, where sellers defend price.
Multiple bullish reactions show support, where buyers accumulate.
Each candle rejection gives information about market strength at that level.
4. Supply & Demand Zones
Large impulsive candles usually originate from institutional zones.
Strong bearish candles leaving a zone indicate Supply, where sellers entered.
Strong bullish candles leaving a zone indicate Demand, where buyers entered.
The return of price to these zones can create new reactions because unfilled orders may remain.
5. Liquidity Concept
Markets often move toward liquidity before making the next direction.
Candles forming:
Equal Highs (EQH)
Equal Lows (EQL)
Previous Highs/Lows
create liquidity pools. Smart money may sweep these areas to collect orders before a strong move.
6. Order Block Analysis
The last opposite candle before a powerful move is considered an Order Block.
Last bearish candle before bullish expansion = Bullish Order Block.
Last bullish candle before bearish expansion = Bearish Order Block.
The reaction candles after returning to these areas show institutional interest.
7. Fair Value Gap (FVG)
Fast-moving candles create imbalance in the market. The gap between candles represents an inefficient price area.
Price often returns to these zones to rebalance before continuing the original move.
8. Premium & Discount Zones
Every candle movement has a valuable trading area.
Premium Zone: Expensive area, where selling opportunities are considered.
Discount Zone: Lower-value area, where buying opportunities are considered.
Professional traders avoid chasing price and wait for better locations.
9. Trendline & Breakout Analysis
Candles respecting trendlines show market direction.
Higher lows along support indicate buyer strength.
Lower highs along resistance indicate seller pressure.
A breakout candle with strong momentum confirms possible continuation.
10. Risk Management
Every candle provides information, but no setup is guaranteed. Professional traders combine:
Market structure
Liquidity
Entry confirmation
Stop loss placement
Risk-to-reward ratio
before entering a trade.
Final Lesson: Every candle tells a story:
Who is controlling the market?
Where is liquidity located?
Where are institutions entering?
Is momentum continuing or changing?
Mastering SMC means understanding the reason behind every candle, not just predicting the next move.
Learn. Practice. Stay Disciplined. Protect Capital.
Gold Volatility Is Through the Roof. Here's How to Survive It.If you've traded Gold over the last few months, you've probably felt it.
Volatility is through the roof.
And although Gold has been my main trading instrument for more than 10 years, I can honestly say I've never seen it behave quite like this.
The market has always been volatile, but today it reacts to almost everything.
- Geopolitics.
- Interest rates.
- Inflation.
- Central bank comments.
- A single headline.
- A tweet
- A rumor.
A move that used to take an entire trading session can now happen in a matter of minutes. A $30 move while you're making coffee is no longer unusual—it's becoming normal.
So the question isn't whether Gold is volatile.
The real question is:
How do you adapt without becoming another victim of that volatility?
1. Forget Breakout Trading
In this environment, breakout trading is one of the fastest ways to get trapped.
Gold loves to fake a breakout, trigger retail stops, and reverse just as aggressively.
Instead of chasing candles, let the market come to you.
Focus on major support and resistance zones and use pending orders where the probabilities are already in your favor. Let price enter your zone instead of entering wherever price happens to be.
Patience has become a trading edge.
2. Widen Your Stops
If you're still using the same 50-pip stop loss you used 2 years ago, you're fighting today's market with yesterday's strategy.
You're cooked.
A normal intraday fluctuation today can easily travel hundreds of pips before the real move even begins.
Gold can move $10 while you're lighting a cigarette.
That doesn't mean you should accept bigger losses.
It means your position size must shrink while your stop loss reflects today's volatility. The market has changed, and your risk management has to change with it.
3. Think Bigger
Many traders are still looking for 100 or 200 pips.
Meanwhile, Gold moves 1,000 pips without breaking a sweat.
When volatility expands, your expectations should expand as well.
If your analysis is correct, don't suffocate the trade with tiny profit targets. Give the market enough room to reward the risk you're taking.
4. Demand Better Risk-to-Reward
With larger stops comes one simple rule:
Never sacrifice your Risk-to-Reward ratio.
Personally, I would rarely consider anything below 1:3 in the current environment.
If the market is asking you to risk more, then it should also pay you more.
Anything less simply doesn't compensate for the uncertainty.
5. Think in Money, Not in Pips
This is probably the most important point.
Most traders still think in pips.
If volatility doubles, your lot size should probably be reduced accordingly.
The goal isn't to make the same number of pips.
The goal is to maintain consistent dollar risk per trade.
Let volatility create the opportunities—not the losses.
Final Thoughts
Gold hasn't become impossible to trade.
It has simply become a different market.
The traders who keep using yesterday's methods will wonder why they keep getting stopped out.
The traders who adapt—by using pending orders, wider stops, smaller position sizes, ambitious but realistic targets, and disciplined risk management—will discover that extreme volatility is not an enemy.
It's an opportunity.
The market doesn't reward the smartest trader.
It rewards the trader who adapts the fastest.
Best of luck!
Mihai Iacob
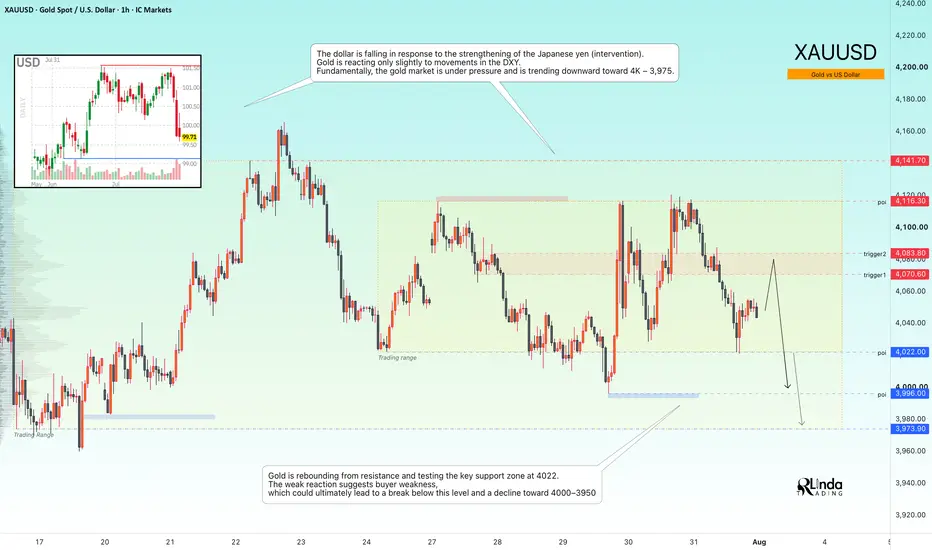
GOLD - Consolidation Amid a Bearish Trend ICMARKETS:XAUUSD remains trapped within the 4022–4116 trading range as markets await the next major economic catalysts. From a technical perspective, however, the broader bearish trend continues to dominate
The U.S. dollar has weakened following renewed strength in the Japanese yen, driven by intervention efforts. Despite this, gold has shown only a muted response to the decline in the DXY. Fundamentally, the metal remains under pressure, with the market still favoring a move toward the 4000–3975 area.
The fundamental backdrop remains challenging for gold. The Federal Reserve is facing an unusually deep policy divide, with three members favoring another rate hike, uncertainty surrounding Governor Waller's outlook, weaker U.S. macroeconomic data (GDP at 1.5%, PCE easing to 3.3%), and renewed geopolitical tensions in the Middle East. Higher oil prices continue to reinforce inflation concerns and support a more hawkish Fed outlook.
Technically, gold has rejected resistance and is now testing the key 4022 support level. The weak buying response suggests limited bullish momentum, increasing the probability of a downside breakout toward 4000–3950
Resistance levels: 4070, 4083, 4116
Support levels: 4022, 3996, 3973
Before the broader decline resumes, the market may first retest the 4070–4083 resistance zone from the session open. The 4116 level also remains a key area to watch. A short squeeze into these resistance levels could provide the catalyst for another bearish reversal toward 4000.
Best regards,
R. Linda
XAUUSD 30M Market Outlook | Order Block & Price ActionGold is currently trading near the 4,057 area after reacting from the lower demand zone and moving into a short-term consolidation phase. The chart highlights important Order Block zones, Market Structure Shifts (MSS), and key liquidity areas that may influence the next price movement.
The current structure suggests that price may continue consolidating between the nearby support and resistance levels before a clearer directional move develops. The projected bullish scenario is based on a possible reaction from the current support area, followed by a move toward the marked imbalance and upper Order Block zone. However, this scenario requires confirmation and is not a guaranteed prediction.
Key Areas to Watch
🔹 Immediate Support: Around 4,048–4,052
🔹 Current Price Area: Around 4,057–4,063
🔹 Potential Resistance / Imbalance: Around 4,075–4,080
🔹 Major Supply Order Block: Around 4,110–4,120
🔹 Lower Demand Order Block: Around 4,000–4,005
Trading Approach
• Wait for a clear MSS, strong candle close, or confirmed price reaction before considering an entry.
• Avoid entering while price remains inside the consolidation range.
• A confirmed break above the nearby resistance may support further bullish continuation.
• A break below the marked support area may invalidate the bullish idea and increase the possibility of a deeper retracement.
• Use a predefined stop-loss and manage risk according to your trading plan.
• High-impact economic news may create increased volatility, spread expansion, or false breakouts.
Note: This chart represents a technical market outlook for educational purposes only. It is not financial advice, investment advice, or a guarantee of future performance. All trading involves risk, and traders should conduct their own analysis before making any decision.
XAUUSD H1: Gold Just Made Its Move. Now Comes the Real TestMost traders will remember today's explosive rally.
Few will pay attention to what happens next.
That difference often separates traders who react from those who anticipate.
The rally itself wasn't particularly surprising. Price first reached beneath the previous swing lows, swept sell-side liquidity, and immediately attracted aggressive buying. Once the descending channel gave way, momentum accelerated as trapped sellers covered positions and late buyers rushed into the move.
Now the market has entered a completely different phase.
Instead of asking whether Gold is bullish or bearish, the more important question is whether buyers are willing to defend the premium they've just created.
The first answer should appear around 4,070–4,080.
This area combines a Fibonacci retracement with the first meaningful supply left behind during the impulsive expansion. Markets frequently revisit these zones after strong displacement, not because the trend has failed, but because large participants need another opportunity to position themselves.
If demand absorbs selling pressure here, the recent breakout gains credibility. That would shift attention back toward the previous high near 4,110, while the larger extension around 4,166 becomes a realistic objective rather than simply a projected level.
On the other hand, a weak response inside this reaction zone would completely change the market's message.
A failed retest after such an aggressive rally often tells us that the move was driven more by liquidity collection than genuine accumulation. Under those conditions, price may gradually unwind the entire expansion and revisit the liquidity resting beneath 4,000 before searching for fresh buyers again.
For now, the chart isn't asking traders to predict the next hundred-dollar move.
It's asking a much simpler question:
Will buyers defend the ground they fought so hard to reclaim?
The answer to that single question will likely define Gold's next trend.
XAUUSD Triangle Support Holds, Recovery Toward $4,100Hello traders! Here’s my technical outlook based on the current XAUUSD (2H) chart structure. XAUUSD previously declined inside a bearish channel before finding support and reversing higher. After the recovery, price formed an ascending triangle, with buyers consistently defending the 4,020 Buyer Zone while sellers continue protecting the 4,100 Seller Zone and the descending resistance line. Currently, XAUUSD is trading above the 4,020 Buyer Zone while remaining below the 4,100 Seller Zone and the descending resistance line. The latest rebound from support suggests buyers are still attempting to build bullish momentum. As long as XAUUSD holds above the 4,020 Buyer Zone and respects the ascending support line, the bullish scenario remains valid. A continuation higher could push price toward the 4,100 Seller Zone (TP1). However, a rejection from resistance or a break below 4,020 would weaken the bullish outlook and increase the risk of another decline. Please share this idea with your friends and click "Boost" 🚀