XAUUSD – Bullish Breakout & Upside Expansion Setup📊 XAUUSD – Bullish Breakout & Upside Expansion Setup
🔍 Market Overview
Gold is showing a strong bullish recovery on the 1D timeframe, following an extended consolidation phase above the 4,070–4,125 support zone. Price has recently accelerated higher from the rising trendline and is now testing the upper structure around 4,340–4,400.
The latest bullish expansion indicates that buyers are gaining control. A sustained hold above the breakout structure could open the way toward the next resistance levels.
📈 Market Structure Insight
* Market Bias: Bullish
* Momentum: Strong & Improving
* Current Phase: Bullish Breakout / Continuation
The formation of higher lows along the ascending trendline, followed by the recent impulsive move, suggests a transition from accumulation into a potential upside continuation phase.
🚀 Trading Scenarios
✅ Bullish Scenario — Primary Bias
Conditions:
* Price holds above the recent breakout structure.
* Buyers maintain higher lows.
* Price sustains above the ascending trendline.
* Bullish momentum continues through the 4,400 area.
Trade Plan:
Look for buying opportunities on controlled pullbacks toward the breakout area or after a confirmed bullish continuation above resistance.
🎯 Target 1: 4,540
🎯 Target 2: 4,705
❌ Bearish Invalidation Scenario
Conditions:
* Price fails to sustain the breakout.
* Strong rejection develops around the 4,400 resistance area.
* Price breaks below the ascending trendline.
* The key demand zone is lost with strong bearish candles.
A confirmed breakdown below the major support structure would weaken the bullish setup and could trigger a deeper corrective move.
🎯 Key Support Zone: 4,070 – 4,125
📍 Key Levels to Monitor
🟢 Immediate Resistance: 4,400
🟢 Target 1: 4,540
🟢 Major Target: 4,705
🔴 Immediate Support: 4,125
🔴 Major Support: 4,070
⚠️ Trading Perspective
The daily structure currently favors the bullish side. Price has respected the rising trendline and produced a strong upside expansion from the consolidation base.
A decisive break and daily close above the 4,400 area would provide additional confirmation for continuation toward 4,540, followed by 4,705.
However, if price loses the 4,070–4,125 demand zone, the bullish structure would require reassessment.
🧠 Professional Insight
This setup is supported by:
* Strong reaction from the demand zone.
* Ascending trendline support.
* Breakout from the recent consolidation range.
* Improving bullish momentum.
* Higher-low structure.
* Potential continuation toward higher resistance levels.
Best approach: Avoid chasing an extended candle. Prefer a controlled pullback/retest or confirmed breakout before considering a continuation entry.
🛡️ Risk Management
* Risk only 1–2% per trade.
* Define invalidation before entering.
* Keep stops below the relevant support structure.
* Avoid excessive leverage during high-volatility sessions.
* Wait for confirmation rather than entering solely on anticipation.
This analysis is for educational purposes only and should not be considered financial advice.
Gold Spot / U.S. Dollar
No trades
No trades
In-depth trading ideas
Market Structure: Bearish | Trend: Downtrend Control | BiasXAUUSD 1D | Smart Money Structure + Liquidity Zones
Professional Candle-by-Candle Educational Description (With Reasons)
---
1. Initial Bullish Expansion Candles
The market started with strong bullish candles creating higher highs and higher lows. Buyers showed clear control and price moved upward through the accumulation phase.
Reason:
Strong buying pressure and demand absorption pushed price into higher levels, confirming bullish market structure.
---
2. Bullish BOS (Break of Structure) Candles
Multiple bullish candles broke previous resistance levels and confirmed continuation of the uptrend.
Reason:
Buyers successfully removed selling pressure and created a new market structure with higher highs.
---
3. Accumulation Zone Candles
Price moved inside a controlled range with smaller candles before the major expansion. This area showed balance between buyers and sellers.
Reason:
Smart Money was building positions before the next directional move.
---
4. Strong Rally Candles
Large bullish candles pushed price aggressively toward the premium area. Momentum increased as buyers entered with strength.
Reason:
Institutional buying created a strong expansion move and captured upside liquidity.
---
5. Rejection Candles From Supply Area
After reaching the top supply zone, candles formed long upper wicks and bearish reactions.
Reason:
Higher prices attracted sellers, creating resistance and profit-taking pressure.
---
6. CHoCH (Change of Character) Candles
The market broke previous bullish structure and created a CHoCH signal, showing a possible shift from bullish control to bearish momentum.
Reason:
Sellers started gaining control after rejecting the premium zone.
---
7. Bearish BOS Candles
Strong bearish candles broke previous support areas and created lower lows.
Reason:
Selling pressure increased and confirmed bearish market structure continuation.
---
8. Downtrend Continuation Candles
Price continued forming lower highs and lower lows while respecting the descending trendline.
Reason:
The trendline acted as dynamic resistance, controlling bearish movement.
---
9. Liquidity Sweep Candles Near Lows
Price moved toward the lower demand area and collected liquidity below previous lows.
Reason:
Smart Money often targets sell-side liquidity before a potential reaction or reversal.
---
10. Current Recovery Candles
Recent bullish candles show buyers attempting to recover from the demand zone and create a short-term structure shift.
Reason:
Demand zone attracted buyers, but confirmation is required above key resistance levels.
---
11. Resistance Test Candles
Current price is approaching the resistance and trendline area. Candles may show rejection or breakout behavior.
Reason:
This zone contains previous seller interest and can decide the next market direction.
---
12. Educational Market Summary
BOS: Confirms market structure continuation
CHoCH: Shows possible trend reversal
Supply Zone: Seller reaction area
Demand Zone: Buyer interest area
Trendline: Dynamic resistance controlling price
Liquidity Zones: Areas where institutional orders may react
Professional Lesson:
Every candle has a purpose. A candle is not only bullish or bearish; its location, liquidity, structure, and reaction area explain the real market intention. Always combine Smart Money Concept + Price Action + Confirmation for analysis.
Gold Rounding Bottom Breakout Signals Further Upside To 4,450$Hello traders! Here’s my technical outlook based on the current XAUUSD (4H) chart structure. XAUUSD previously traded inside a broad range before breaking below the 4,450 Support Level and moving lower. After forming a rounding bottom, price broke above the descending trendline, signaling a bullish shift. Currently, XAUUSD is trading above the 4,300 Buyer Zone while approaching the 4,450 Seller Zone. The recent breakout and strong upward move suggest that buyers remain in control. As long as XAUUSD holds above the 4,300 Buyer Zone, the bullish scenario remains valid. A successful retest of support could push price toward the 4,450 Seller Zone (TP1). However, a breakdown below 4,300 would weaken the bullish outlook. Please share this idea with your friends and click "Boost" 🚀
Mastering High-Probability SMC Reversals: Inducement & OBRetail trading models often fail because they ignore underlying market liquidity. In this detailed lesson, we break down the step-by-step anatomy of a High-Timeframe (HTF) bearish reversal setup where Inducement (IDM) acts as our primary high-probability confirmation.
Core Strategy Overview
Strategy: Smart Money Concepts (SMC) / Inner Circle Trader (ICT)
Trend Context: Bullish-to-Bearish Reversal
Timeframes: Ideal for 15M / 1H (HTF Confirmation: 4H / D1)
Risk to Reward Ratio: 1:3 to 1:10+
Step-by-Step Anatomy of the Setup
Break of Structure (BOS): Price first creates a strong bullish impulse, breaking the previous swing high to maintain the temporary uptrend.
Market Structure Shift (MSS): Market displays structural weakness by breaking below the recent swing low, signaling an early trend shift.
Inducement (Liquidity Grab) - The Key Element: Price does not immediately run into the premium Order Block. Instead, it creates an internal swing high. Retail traders mistake this for a bullish breakout. Smart Money engineers liquidity by trapping early buyers and capturing their Buy Stop Loss orders. Without an Inducement sweep, an Order Block remains high-risk.
Bearish Order Block (OB): Following the liquidity sweep, we identify the unmitigated bearish order block (the last up-candle before the aggressive decline).
Price Rejection from OB: Price retraces into the Order Block and shows an immediate rejection (wick rejection or bearish engulfing pattern).
Imbalance / Fair Value Gap (FVG): The aggressive displacement leaves behind a Fair Value Gap, confirming heavy institutional selling momentum.
Target Previous Swing Low: The primary short-term target is the internal structure's previous swing low (TP1).
Sell Side Liquidity (SSL): The ultimate targets are major swing lows where retail stop losses (SSL) are concentrated (TP2 & TP3).
Execution Rules
Entry: Short position upon candle close confirming rejection inside the Order Block.
Stop Loss (SL): Placed safely above the Order Block high or above the Liquidity Grab high.
Take Profit Targets:
TP1: Previous Swing Low (Risk Reduction / Move SL to Breakeven)
TP2: Sell Side Liquidity (SSL) Pool
TP3: 1:5 to 1:10+ Extended RR
Key Confluences Checklist
HTF Bearish Bias Alignment
Clear BOS followed by MSS
Clean Inducement / Liquidity Grab
Valid Unmitigated Bearish Order Block
Immediate Price Rejection at OB
Concurrency with Fair Value Gap (FVG)
Defined Sell Side Liquidity (SSL) Targets
🔥 What is your take on this SMC Reversal Setup?
Do you wait for Inducement (IDM) before entering at an Order Block, or do you trade direct mitigations? Drop your thoughts and questions in the comments below!
👍 Like & Follow: If this breakdown added value to your trading process, hit the Like button and Follow for daily technical mappings and SMC concepts.
📌 Save/Bookmark: Save this post for quick reference during your live trading sessions.
Disclaimer: This post is strictly for educational purposes and does not constitute financial advice. Always manage your risk properly.
Gold 30Min Engaged ( Bullish Reversal Detected )HANZO MARKET LIQUIDITY REPORT
Gold
Timeframe: 30min (Volume Basis)
Scale: Higher Timeframe Context / Deep Volume analysis
━━━━━━━━━━━━━━━━━━━━━━
Market Observation
This analysis is focusing on structural behavior, liquidity zones, Volume analysis
and key areas of interest within the current range.
━━━━━━━━━━━━━━━━━━━━━━
Market Bias
Full liquidity Map
━━━━━━━━━━━━━━━━━━━━━━
🔥Bullish Reversal
Key Volume Zone : 4340 Area
━━━━━━━━━━━━━━━━━━━━━━
Structure Factors:
• Higher timeframe Volume reaction level
• High-volume / Hidden
• Range Defend structure
• Volume Stacking
• Quarter Volume
XAU/USD: THE 4,460 MACRO TARGET EXPANSION! 🪙🚀
Pulling back toward ascending support at 4,344.255! Are you panic-selling this healthy higher-low retest, or locked in for the multi-wave rally to the 4,460 target ceiling? 🤔
Gold is maintaining a strong bullish trend on this 1-hour OANDA chart. Spot gold is trading around 4,344.255, pulling back gently toward its primary Support line to sweep local sell-stops and absorb liquidity before launching its next macro expansion. 📈💥
Look closely at the black blueprint trajectory mapping out the upcoming sessions. The algorithm projects a textbook multi-wave retest and expansion sequence:
• A localized pullback dipping down toward the primary Support line near $4,290 - $4,300 to clear weak hands and trigger institutional buy orders. 🧹
• A high-velocity impulse rebound surging straight up toward the $4,410 region. ⚡
• A healthy higher-low retest pulling back to $4,365 to lock in structural support. 🌊
• Final powerful expansion rally accelerating straight up to hit the macro Target ceiling near $4,455 - $4,460. 🎯🏹
Maintaining technical patience and trendline alignment is your ultimate superpower in this setup. Trying to short directly into a confirmed ascending support floor is a fast track to getting caught in an aggressive expansion squeeze. Smart money is waiting for the retest into support to accumulate long position blocks. 🧘♂️⚡
🛠 Trade Parameters:
🛒 Long Zone: 4,285 - 4,305 🛍️
🛑 Stop-Loss: 1h close below 4,260 ❌
💰 Take-Profit: 4,460 🎯
The retail bears attempting to short into ascending support are about to get caught offside as institutional buy volume takes total control. Stay focused, strictly manage your risk, and let the algorithm carry the trade up to our target.
Maintain your composure through the waves, and we will see you up at the 4,460 target ceiling
Gold Analysis: Smart Money Accumulation After Liquidity HuntGold is currently showing signs of a potential bullish recovery after a prolonged bearish move. Price formed a strong liquidity sweep near the weak low area, followed by a Change of Character (CHoCH), indicating a possible shift from bearish momentum toward bullish structure.
Demand Zone & Bullish Scenario
Price is holding above the marked demand zone around 4,040–4,083. As long as this zone remains protected, buyers have the opportunity to regain control. A confirmed Break of Structure (BOS) above nearby resistance levels will strengthen the bullish continuation setup.
Upside Targets
If price continues to respect the demand zone and breaks resistance with confirmation:
Target 1: 4,430 area (first liquidity objective)
Target 2: 4,651 area (major resistance/liquidity level)
Target 3: 4,850–4,900 area (strong high liquidity zone)
Invalidation Scenario
A strong breakdown below the 4,040 support level will invalidate the bullish setup. A move below this area may trigger another liquidity hunt toward lower levels before any potential reversal.
SMC Perspective
The current structure suggests:
Liquidity sweep completed near the lows
CHoCH confirmed on the lower structure
Price reacting from demand zone
Next confirmation required: BOS above resistance
The key level to watch is the 4,040 demand area. Holding this zone keeps the bullish scenario valid; losing it shifts the bias back toward bearish continuation.
BULLISH MOMENTUM CONTINUES — CAN BUYERS PUSH TOWARD 4430?Gold continues to break higher strongly, supported by positive news flow for the metal. The H2 structure remains clearly bullish with a sequence of Higher Highs and Higher Lows, keeping buyers firmly in control.
Price is currently consolidating near the 4370–4380 resistance zone after the strong rally. Rather than chasing the breakout, the preferred approach is to wait for a pullback toward 4300–4310 and look for bullish confirmation.
If this support holds, Gold could resume the upside move toward 4420–4430. A deeper correction would bring 4230–4250 into focus as the next major support area.
📍 KEY LEVELS:
🔹 4300–4310
Immediate support and preferred area to monitor for a BUY reaction.
🔹 4230–4250
Major support zone if a deeper pullback develops.
🔹 4370–4380
Current resistance and key breakout area.
🔹 4420–4430
Next upside target if Gold successfully breaks above 4370–4380.
✅ PREFERRED SCENARIO:
Gold holds above 4300–4310.
Wait for a pullback and bullish confirmation before entering BUY positions.
Breakout above 4370–4380 → upside target 4420–4430.
If 4300 fails, monitor 4230–4250 for the next BUY opportunity.
BIAS: 🟢 BUY — The bullish trend remains dominant. Focus on buying pullbacks rather than chasing the breakout.
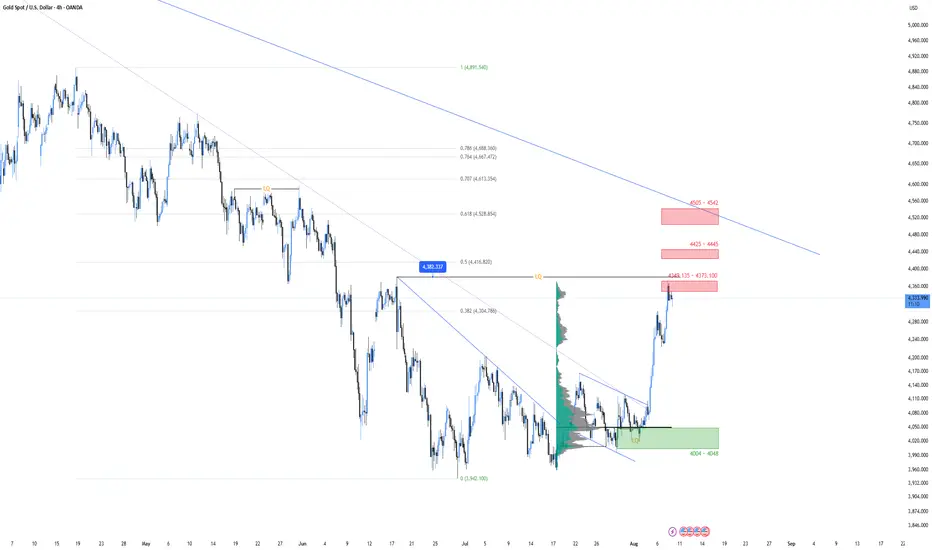
BUY THE PULLBACKSXAUUSD — BULLISH EXPANSION | BUY THE PULLBACKS
Gold has entered a new bullish expansion phase. The higher-timeframe structure favors continuation, with pullbacks becoming the preferred opportunity to join the trend rather than attempting to fade the move.
1. HIGHER-TIMEFRAME STRUCTURE
On the 4H timeframe, Gold has broken out of the previous descending consolidation structure and delivered a strong bullish displacement from the ~3,942 low.
This breakout changes the market condition.
We are no longer dealing with the same corrective structure that previously contained price. The market is now showing clear bullish expansion, with the immediate priority being to identify where buyers may step back in.
Therefore, the current framework is:
4H Bias: Bullish
Market Phase: Bullish expansion / impulse
Preferred Direction: Long
Preferred Entry Concept: Buy confirmed pullbacks
Invalidation: Structural failure below the key breakout/support structure
2. RESISTANCE DOES NOT AUTOMATICALLY MEAN REVERSAL
Gold is now approaching several resistance and liquidity areas:
4,349–4,373 — First resistance zone
4,382 — Key liquidity / horizontal level
4,425–4,445 — Next resistance zone
4,505–4,542 — Major resistance zone
4,528 — Fibonacci 0.618
These levels can produce temporary reactions, consolidation, or a local high.
However, the presence of resistance does not by itself invalidate the bullish structure.
The preferred interpretation is:
Resistance → temporary reaction → support formation → bullish continuation.
We are therefore not interested in shorting every resistance level against a strong higher-timeframe impulse.
We are interested in seeing whether the market can convert previous resistance into support.
3. THE MOST IMPORTANT AREA: 4,500–4,540
The 4,505–4,542 region is the most important resistance cluster on the current chart.
It overlaps with the 4,528 Fibonacci 0.618 level and sits substantially higher than the first reaction zones.
If price reaches this area after another bullish expansion, the probability of a more meaningful temporary correction increases.
This does not mean that Gold must reverse there.
Instead, this is the area where we should pay particular attention to whether the market finally provides a higher-quality pullback.
4. OUR PREFERRED STRATEGY — BUY THE PULLBACK
The objective is not to predict the exact top.
The objective is to participate in the next bullish leg after the market creates a valid retracement.
The ideal sequence is:
Gold reaches a resistance/liquidity area.
A temporary high or consolidation develops.
Price retraces.
The retracement establishes a new support structure.
Buyers defend that support.
Bullish displacement confirms continuation.
Resistance is therefore not the entry.
The reaction from resistance and subsequent support formation is the entry opportunity.
5. IMPORTANT: THE PULLBACK MAY BE SHALLOW
One of the biggest mistakes in a strong trend is assuming that price must provide a deep retracement.
Gold may reach 4,425, 4,500 or even higher and only produce a shallow correction before continuing.
A strong bullish market can correct through:
A shallow price retracement
A sideways consolidation
A short-term liquidity sweep
A lower-timeframe pullback
Therefore, we will not require a deep 4H correction before considering longs.
The requirement is structural confirmation , not a specific percentage retracement.
6. MACRO BACKDROP
The fundamental environment remains supportive of the bullish thesis.
The recent acceleration in Gold has been associated with a repricing of US monetary-policy expectations following weak labor-market data.
The major channels are:
Real Yields: Lower US yields reduce the opportunity cost of holding non-yielding gold.
USD: The current move is not primarily dependent on a major dollar selloff, strengthening the argument that yields and macro risk are more important drivers.
Risk Sentiment: Growth concerns following weaker labor data increase demand for defensive assets.
Liquidity / Positioning: The aggressive upside expansion confirms strong momentum, while simultaneously increasing the probability of short-term profit taking.
The macro backdrop therefore supports continuation, but the magnitude of the recent move means that chasing extended candles carries poor risk/reward.
7. KEY LEVELS
4,349–4,373: First reaction zone
4,382: Key liquidity / horizontal level
4,425–4,445: Intermediate resistance
4,505–4,542: Major resistance
4,528: Fibonacci 0.618
4,304–4,314: Important support / structural reference
4,275–4,238: Lower support area if the bullish structure weakens
The most important principle is simple:
Previous resistance needs to become support.
8. BULLISH CONTINUATION SCENARIO
This remains the primary scenario.
For continuation, we want to see:
Price maintain the 4H bullish structure.
Pullbacks remain corrective rather than impulsive.
Broken resistance levels begin acting as support.
Higher lows continue to develop.
Price breaks and accepts above the 4,425–4,445 area.
The 4,505–4,542 zone is eventually broken with bullish acceptance.
Confirmation:
A pullback into a reclaimed support zone followed by bullish rejection and renewed upside displacement.
Upside objectives:
4,425–4,445
4,505–4,542
4,600+
Above the 4,542 area, the market enters a less-defined overhead supply environment, increasing the potential for another liquidity-driven expansion.
9. DEEP PULLBACK / REVERSAL SCENARIO
The bearish scenario is secondary.
A reaction from resistance should not immediately be classified as a reversal.
The bearish thesis becomes relevant only if the market begins to fail structurally.
The warning sequence would be:
Bullish breakout loses acceptance.
Price produces bearish displacement rather than a normal corrective move.
Previously reclaimed levels fail to hold as support.
4,304–4,314 is decisively lost.
Price fails to reclaim the broken structure.
A sustained break below 4,304–4,314 would materially weaken the current bullish thesis and increase the probability of a deeper retracement toward 4,275–4,238 .
Until that structural failure occurs, aggressive bearish positioning remains counter-trend.
10. EXECUTION FRAMEWORK
The strategy is therefore not:
"Buy because Gold is bullish."
The strategy is:
"Wait for Gold to prove where buyers are defending the trend, then buy the next confirmed expansion."
We do not want to chase vertical candles into resistance.
We want:
Impulse → resistance → reaction → support → confirmation → continuation.
If the correction is deep but remains structurally bullish, we look for longs.
If the correction is shallow and forms a bullish base, we look for longs.
If price simply consolidates below resistance and then breaks higher with acceptance, we look for continuation.
The depth of the pullback is secondary.
The quality of the structure is what matters.
11. FINAL MARKET VIEW
Primary Driver: 4H bullish breakout and expansion from descending consolidation.
Secondary Driver: Falling yields and dovish repricing following weaker US labor-market conditions.
Market Regime: Bullish trend acceleration.
Short-Term Bias: Bullish, but locally extended.
Medium-Term Bias: Bullish.
Preferred Strategy: Buy confirmed pullbacks.
Major Reaction Zone: 4,505–4,542.
Structural Support: 4,304–4,314.
Major Bearish Warning: Sustained loss of 4,304–4,314.
STRATEGIC DECISION: BULLISH — BUY THE PULLBACKS.
Gold has transitioned into a bullish expansion phase.
We are not looking to predict the next top or fight the current impulse.
We are waiting for the market to create the next opportunity to join the trend.
Resistance can produce the pullback.
The pullback can create the support.
And the support can provide the next long opportunity.
XAUUSDHello Traders! 👋
What are your thoughts on Gold?
Over the past several weeks, gold had been trading within a range and successfully held the key support area around 4,000. The price eventually broke out of this range and, following a strong bullish move last week, reached the 4,400 resistance area.
At the current levels, a corrective move toward the support zone is expected. From that area, we expect renewed buying interest to emerge and gold to begin its next bullish leg.
The upcoming U.S. CPI data this week could act as an important catalyst for gold and may accelerate the next directional move.
As long as price remains above the highlighted support zone, the bullish outlook remains valid. A break below the support zone, confirmed by a daily candle close below it, would invalidate the bullish scenario.
If you found this analysis helpful, please support it with a like and share your thoughts in the comments! Good luck with your trades!❤️
Gold Week 33/2026: A $330 Rally and the Trap AboveMy short from last week survived exactly two sessions.
On Monday, price tagged the 4,070-4,083 zone I had marked in the week 32 article. The order filled, price slipped toward 4,042, and I closed part of it, pocketing exactly $23.
On Tuesday, gold turned around and ripped straight up to 4,267. The rest of the position was stopped out. Netting it out, I was down $40.
Losing $40 doesn't bother me. What matters more is what I did afterwards: nothing at all.
✅ THE MINDLESS RULE SAVES ME AGAIN
The week 32 article had one line I wrote for myself: a daily close above 4,120 meant the triangle had broken upward and the Short scenario was invalidated.
On Tuesday, 4 August, the daily candle closed at 4,247. The invalidation triggered, and I stood aside watching gold run on to Friday's high of 4,372.
From Monday's low of 4,042 to that high, gold traveled nearly $330 in one week. For the second straight week, the invalidation rule kept my money safe.
Getting a forecast wrong is a normal part of this job. Staying out after being wrong is the part that takes practice.
🔍 WHO'S BUYING, AND WHY I DON'T TRUST IT YET
This rally has reasons behind it, and they aren't weak.
A soft NFP jobs report dragged down expectations for a Fed rate hike. Pressure on the BOJ to raise rates in September adds weight on the dollar. In the Middle East, the bombs have stopped, but nobody has seen any deal signed.
A weak dollar and quiet guns give gold a reason to run. But another stream of money is telling the opposite story.
In the second quarter, Berkshire Hathaway spent about $4.5 billion on buybacks and nearly $20 billion buying stocks. Greg Abel is putting the company's mountain of cash to work far more aggressively.
People only do that when they believe no recession is coming and inflation is no longer a problem. And those happen to be the two most classic reasons to hold gold.
If Berkshire is right, this $330 surge looks more like FOMO than a new trend. And FOMO near the highs tends to leave traps behind.
The daily RSI sits at 68.3, touching overbought territory for the second time since the all-time high of 5,598 in February. The first time was at that very peak.
🥇 GOLD ETFS ARE SAYING THE OPPOSITE
Let me be blunt: last week's Gold ETF flows were not on my side.
The SPDR fund was a net buyer for four straight sessions. On 4 August it added $449 million, on the 5th another $656 million, on the 6th it slowed to $78 million, then on the 7th another $393 million.
The whole run adds up to nearly $1.58 billion, equivalent to 11.67 tonnes of gold. Holdings jumped from 1,005.9 tonnes to 1,017.5 tonnes. Just one week earlier, the same fund had recorded net outflows of nearly $300 million.
I won't spin this number to flatter my view. Money arriving after the price has already run can be FOMO chasing the move, or institutions genuinely changing their appetite.
The only conclusion I draw: my confidence in this week's Short is lower than usual. So I absolutely will not chase the Sell. If a signal appears at my pre-set zone, I'm in; if not, I pass.
📊 EVERY EMA RECLAIMED, BUT A SUPPLY ZONE SITS ABOVE
On the technical side, credit where it's due: the bulls just did something big.
Last week price was still below all five daily EMAs. Now price at 4,357 stands above every one of them: EMA10 4,249, EMA20 4,187, EMA50 4,190, EMA100 4,287, EMA200 4,266.
But overhead, the obstacles are lining up too.
Plotting a Fibonacci retracement over the 4,891-to-3,942 decline, price has just cleared the 0.382 level at 4,305. The 0.5 sits at 4,417, the 0.618 at 4,529. The 4,417-4,529 area is exactly where price reacted over and over from February through June.
The upper daily Bollinger Band sits at 4,374, right against price. Stochastic has reached 93, and daily ATR is around $98.
No indicator forces this market to reverse. But if the sellers are still there, 4,417 to 4,529 is the most logical place for them to act.
⚠️ HORMUZ, THE VARIABLE THAT DECIDES THE WHOLE BOARD
One more variable lives outside every chart: the negotiating table around the Strait of Hormuz.
There's no clear Oman-Iran agreement yet, and no sign of the US and Iran sitting down. The only fact on the table is that the bombing has stopped.
If a deal takes shape, the likely script is stocks and Bitcoin keep booming while gold and the US dollar get sold at the same time. That scenario works in favor of my Short.
If the talks collapse instead, the way they did in June, the war premium returns instantly and the Short dies on the spot.
🎯 MY PLAN FOR THIS WEEK
I'm waiting for gold to finish its climb into the 4,416 area, the lower edge of the supply zone, right at the 0.5 Fibonacci level.
The script I've drawn: price tags that zone, leaves a Sell signal, then turns down to 4,300, on to 4,200, and at the far end the old bottom at 3,996.
Entry zone (Sell) — Price: 4,416
TP1 — Price: 4,300
TP2 — Price: 4,200
TP3 — Price: 3,996
Invalidation — Price: No Sell signal at 4,416
Stop loss is 200 pips, risking $240. Volume is 0.12 lot split into 0.02, 0.04 and 0.06, taking profit in stages at each target.
This week's invalidation lives in the candles, not in a price level. If price touches 4,416 without leaving any Sell signal candle, I don't enter. A trade cancelled before it opens is still better than a trade opened in the wrong place.
Last week the market collected $40 in tuition from me. This week I'm putting that exact lesson to work: no chasing, no guessing, just waiting at the agreed spot.
And you, do you think this $330 surge is the real trend, or the bulls' final sprint before the trap?
---
P/S: Don't forget to leave a Like and ask anything you'd like to discuss to trade better every day!
Follow Tô Triều on TradingView to stay connected for the long haul, and talk through each trade together. I believe sharing and discussion help us learn more, and make every analysis and every comment on TradingView more useful for everyone ⚡️
Liquidity Hunt & Market Reversal | Professional SMC BreakdownHigh Time Frame analysis is the foundation of professional trading. These charts show how price moves through market structure, liquidity zones, Break of Structure (BOS), Change of Character (CHoCH), and institutional order flow.
The first step is always identifying the overall market direction. Initially, price was following a bearish structure where sellers controlled the market and multiple BOS confirmations showed downside continuation. After creating a strong low area, the market started showing signs of weakness in sellers and strength from buyers.
The important shift happened when price created a CHoCH (Change of Character). This indicates that market behavior is changing and buyers are beginning to take control. After CHoCH, price confirmed bullish momentum by creating consecutive BOS to the upside, showing that institutions were supporting higher prices.
Key Lessons From This Chart:
1. Market Structure Comes First Never enter a trade only because of a candle pattern. First understand:
Where is the strong high?
Where is the strong low?
Is the market making Higher Highs & Higher Lows or Lower Highs & Lower Lows?
Structure tells the story of smart money.
2. Liquidity Is The Main Target Institutions often move price toward liquidity areas:
Previous Highs (PWH)
Previous Lows (PWL)
Equal Highs (EQH)
Equal Lows (EQL)
Liquidity is where many traders place stop losses. Smart money often collects this liquidity before the next major move.
3. CHoCH Is The Early Warning Signal A CHoCH does not mean instant entry. It only tells us that the previous trend may be losing power.
Professional confirmation comes after:
CHoCH appears
Price breaks structure (BOS)
Retest occurs at a valid zone
4. BOS Confirms Direction After the bullish CHoCH, every new BOS confirmed buyer dominance. This shows that demand is stronger than supply and the probability of continuation increases.
5. High Time Frame Controls Lower Time Frame The higher timeframe gives the roadmap:
Daily/4H → Market direction and important zones
1H → Setup formation
15M/5M → Entry confirmation
A trader should not fight the higher timeframe trend.
Current Market Education:
Price has shifted from a bearish environment into a bullish structure after breaking previous resistance levels. Buyers are currently defending higher lows, showing strength.
The main areas to watch:
Resistance / Liquidity Zone: Previous highs and weak highs can become liquidity targets where price may search for orders.
Support / Demand Zone: Previous BOS areas and strong lows can act as institutional buying zones.
If buyers continue holding above important structure, continuation toward higher liquidity is possible. However, if price loses the last protected low, the bullish structure can weaken and a deeper retracement may occur.
Professional Trading Rules From This Analysis:
✓ Follow structure, not emotions
✓ Wait for liquidity sweep before entry
✓ Use CHoCH for reversal confirmation
✓ Use BOS for trend continuation
✓ Enter from strong zones, not random candles
✓ Always protect capital with risk management
✓ Discipline is more important than prediction
The biggest lesson: "Professional traders do not predict every move. They wait for the market to reveal its intention through structure, liquidity, and confirmation
Market Structure Shift + Liquidity Expansion
This chart represents a professional Smart Money Concept (SMC) approach where price action is analyzed through structure, liquidity, and institutional order flow.
The market first created a consolidation phase where buyers and sellers were collecting liquidity. During this phase, equal highs and equal lows formed, creating liquidity pools that institutions often target before the next major move.
After the formation of a CHoCH (Change of Character), buyers started gaining control. Price broke previous resistance levels and printed multiple BOS (Break of Structure) confirmations, showing a clear shift from accumulation into bullish expansion.
The strong bullish impulse shows that demand is dominating the market. After the breakout, price entered a retracement phase to rebalance the move while maintaining the bullish structure.
Key Learning Points:
• Accumulation Before Expansion:
Smart money often builds positions during sideways movement before a strong directional move.
• CHoCH Gives Early Confirmation:
A change in market behavior is the first sign that the previous trend may be ending.
• BOS Confirms Continuation:
Every successful break of structure increases the probability of trend continuation.
• Liquidity Is The Target:
Price is attracted toward weak highs, previous highs, and liquidity zones where institutional orders are available.
• Strong Low Protection:
As long as the protected low remains intact, buyers maintain control.
Trading Lesson:
Do not chase large candles after a breakout. Professional traders wait for:
Liquidity sweep
Structure confirmation
Retest of demand/order block
Risk-managed entry
The market does not move randomly; every expansion phase is built after liquidity collection and structural confirmation.
SMC Rule:
First understand where liquidity is resting, then follow where smart money is moving
This chart represents a complete SMC bullish reversal model, where price transitions from a bearish environment into a strong institutional expansion phase.
The market was initially moving inside a range with repeated BOS and CHoCH formations, showing the battle between buyers and sellers. After creating a Strong Low, price started showing accumulation signs and buyers began absorbing selling pressure.
The major turning point came when price broke above the previous bearish structure with a clear CHoCH (Change of Character). This confirmed that market sentiment was shifting from seller control to buyer dominance.
After the CHoCH confirmation, price created multiple BOS (Break of Structure) signals, proving strong bullish order flow. Each breakout created a new higher high and protected higher low, showing institutional buying strength.
Key Educational Points:
1. Trend Reversal Process A professional reversal is not identified by one candle. It develops through:
Liquidity collection
CHoCH confirmation
BOS continuation
Retest and expansion
2. Liquidity & Stop Hunt Concept Before the bullish move, price collected liquidity around previous lows and weak positions. Institutions use these areas to build positions before driving price higher.
3. Strong Low Protection The strong low acts as the foundation of the bullish structure. As long as price respects this area, buyers remain in control.
4. Weak High Liquidity Target The current price is approaching weak highs, where liquidity is resting. Markets often target these areas before deciding the next move.
5. Multi-Timeframe Approach High timeframe defines the direction:
Identify structure shift on HTF
Mark liquidity zones
Wait for lower timeframe confirmation
Execute with proper risk management
Professional Trading Lesson:
Do not buy because price is already moving.
Wait for the market to show: Liquidity → Structure Shift → Confirmation → Entry
SMC Principle:
Smart money does not chase price; it creates the move after collecting liquidity
This chart explains the complete journey of price from bearish distribution to bullish reversal, using Smart Money Concepts (SMC) principles.
The market started with a clear bearish structure, where sellers maintained control by creating consecutive Lower Highs and Lower Lows. Multiple BOS (Break of Structure) confirmations showed continuous downside pressure.
After reaching the lower liquidity area, price formed a Weak Low zone, where selling momentum started decreasing. This area became important because institutions often accumulate positions near liquidity zones before a major reversal.
The major turning point appeared when price created a CHoCH (Change of Character). This was the first indication that market control was shifting from sellers to buyers.
Following the CHoCH, price developed a bullish structure by:
Breaking previous resistance levels
Creating Higher Highs
Protecting Higher Lows
Printing bullish BOS confirmations
This transition represents the shift from seller dominance → institutional accumulation → buyer expansion.
Key Educational Lessons:
1. Identify The Market Phase Every market moves through phases:
Distribution
Expansion
Accumulation
Reversal
Understanding the phase prevents traders from entering against the dominant flow.
2. CHoCH Is The First Signal, Not The Entry A CHoCH only shows that the old trend is weakening. Professional traders wait for:
Liquidity confirmation
BOS confirmation
Retest of demand areas
3. Liquidity Controls Price Movement The market often targets:
Previous Highs (PWH)
Previous Lows (PWL)
Strong Highs
Weak Lows
These areas contain trapped orders and liquidity.
4. Higher Time Frame Gives The Direction The bigger timeframe shows the institutional intention. Lower timeframes should only be used for precise entries after the higher timeframe bias is clear.
Professional Trading Mindset:
Do not focus on predicting every candle.
Focus on understanding where liquidity is located, who controls the structure, and when the market changes character.
SMC Principle:
The trend changes when smart money changes position. First comes liquidity, then structure, then expansion
GOLD: Short-Term Bearish Setup – 4,300 & 4,250 in FocusGOLD: Short-Term Bearish Setup – 4,300 & 4,250 in Focus
Gold is showing signs of a possible short-term bearish move after failing to maintain the recent bullish momentum due to the news related to the war.
Price is currently trading below the recent highs, and the setup suggests a potential pullback toward the previous breakout area.
The fundamental backdrop could also support this short-term bearish scenario. With the U.S. and Iran failing to reach a deal over the weekend, uncertainty remains elevated, which could increase volatility and potentially put additional pressure on Gold in the near term.
Technically, the first key level to watch is around 4300. A break below this area could open the way toward the next support zone around 4,250.
Bearish Targets:
🎯 Target 1: 4,300
🎯 Target 2: 4,250
You can find more details on the chart.
Thank you ! 🍀
⚠️PS: Do your own analysis and use your own strategy to join the trade.
❤️ If this analysis helps your trading day, please support it with a like or comment ❤️
XAUUSD Bullish Rebound | Support Holding Strong (4H)Gold has made a strong bullish move and is now testing the highlighted support/resistance zone around 4,280–4,300. Price has broken above the descending trendline, showing improving bullish momentum.
If this zone holds as support, the next upside levels are:
* 🟢 1st Resistance: 4,500
* 🟢 2nd Resistance: 4,700
* 🟦 Support: 4,280–4,300
A rejection back below the support zone could weaken the bullish setup.
XAUUSD | CHoCH, BOS & Liquidity Mapping AnalysisXAUUSD 4H | Smart Money Structure + Liquidity & Demand Zones
Professional Candle By Candle Educational Description (With Reasons)
1. Initial Bearish Movement Candles
Starting candles showed strong selling pressure from higher levels. Large bearish bodies and continuous downside movement indicated that sellers were controlling the market and creating lower lows.
Reason:
Price was rejected from the premium area, and sellers pushed the market toward lower liquidity zones.
---
2. First Liquidity Sweep Candles
Price moved below previous lows and created long rejection wicks. These candles showed that sell-side liquidity was collected before buyers started showing interest.
Reason:
Smart money often takes liquidity below weak lows before initiating a reversal move.
---
3. Bullish Recovery Candles From Demand
After reaching the lower demand area, strong bullish candles appeared. Buyers absorbed selling pressure and pushed price upward from the discount zone.
Reason:
Demand zone provided support where buyers entered with strong volume.
---
4. CHoCH Formation Candles
Price broke minor previous highs and created a Change of Character (CHoCH). These candles indicated that short-term market momentum was shifting toward buyers.
Reason:
Buyer strength increased after defending the demand zone and breaking short-term resistance.
---
5. Consolidation Range Candles
Market entered a sideways phase where candles became smaller and price moved between support and resistance. This showed accumulation of liquidity before the next expansion.
Reason:
Both buyers and sellers were building positions while waiting for confirmation.
---
6. Equal High (EQH) Formation Candles
Several candles tested the same resistance level and failed to break strongly. These equal highs created a liquidity pool above the market.
Reason:
Buy-side liquidity formed above equal highs, becoming a potential target for smart money.
---
7. Breakout Bullish Candles
Strong bullish candles pushed above the range and broke previous resistance. This move confirmed buyer participation and increased bullish momentum.
Reason:
Price captured liquidity and buyers gained temporary market control.
---
8. Current Strong Bullish Expansion Candles
Latest candles show aggressive upward movement toward the weak high area. Large bullish bodies indicate strong demand and momentum continuation.
Reason:
Buyers are targeting liquidity above previous highs and testing higher resistance zones.
---
9. Resistance Reaction Candles
Near the upper supply area, candles may show smaller bodies and rejection wicks. This indicates sellers are waiting at higher prices.
Reason:
Supply zone contains potential selling orders and can create a pullback.
---
10. Possible Retracement Candles
If price rejects from the high area, bearish candles can return toward the 4075–4065 demand zone for a retest.
Reason:
Markets often revisit previous breakout zones before continuing the next move.
---
11. Smart Money Structure Summary
The chart shows:
BOS: Market structure continuation
CHoCH: Momentum shift confirmation
Liquidity Sweep: Stop hunt before expansion
Demand Zone: Buyer reaction area
Supply Zone: Seller reaction area
Educational Lesson:
Every candle represents the battle between buyers and sellers. Professional analysis comes from understanding why price moved, not only where it moved. Always combine Market Structure + Liquidity + Supply/Demand + Confirmation before making decisions.
XAU/USD – Bullish Recovery Breakout SetupXAU/USD – Bullish Recovery Breakout Setup
Gold is showing a strong recovery from the 4,076 support zone after forming a higher-low structure and holding above the rising trendline. The latest bullish impulse has pushed price into the cloud, indicating that buyers are attempting to regain control after the previous corrective phase.
Price is now approaching a key resistance area. A confirmed breakout and sustained close above the cloud would strengthen the bullish structure and could open the path toward 4,546 as the first major resistance, followed by 4,702. As long as price continues to respect the rising trendline and the 4,076 support zone, the recovery structure remains favorable.
If the Bullish Structure Holds
🟢 1st Resistance: 4,546.00
🟢 2nd Resistance: 4,702.00
🔴 Primary Support: 4,076.00
Market Structure Insight: The transition from a prolonged corrective phase into a higher-low recovery structure suggests improving bullish momentum. A confirmed move above the would provide additional confirmation for continuation toward the higher resistance levels.
⚠️ Disclaimer: This analysis is for educational purposes only. Always wait for confirmation before entering a trade and apply proper risk management in all market conditions.
The Secret Behind Market Moves | SMC ExplainedThe Secret Behind Market Moves
Step 1 — Identify Liquidity
First, locate areas where traders’ stop-losses are likely resting, such as equal highs/lows, previous highs/lows, and obvious swing points.
Step 2 — Liquidity Sweep
Price may move toward that liquidity and briefly break the level, triggering stops before reversing. This is often called a liquidity sweep.
Step 3 — Market Structure Shift
After the sweep, wait for a BOS or CHoCH. This provides evidence that the short-term order flow may be changing.
Step 4 — Displacement & FVG
A strong impulsive move can create a Fair Value Gap (FVG). This imbalance can become an area of interest for a potential retracement.
Step 5 — Mitigation
Price may return to the FVG or mitigation area before continuing in the new direction.
Step 6 — Entry & Invalidation
Look for confirmation at the zone and define the invalidation level before entering. Avoid entering simply because price touched an FVG.
Step 7 — Target the Next Liquidity
The logical objective is often the next significant BSL/SSL or structural high/low.
🔥 SMC Flow
Liquidity → Sweep → BOS/CHoCH → Displacement → FVG → Mitigation → Entry → Target
The Institutional Trading Model: Liquidity → Structure → EntryThe market does not move randomly. Every price movement is connected with liquidity, market structure, and institutional activity.
Many retail traders enter trades after seeing a simple breakout. They buy above resistance or sell below support because they believe the move will continue. However, these obvious levels often contain a large amount of retail stop-loss liquidity.
Smart money uses these liquidity zones to execute large orders. Price may first move against retail traders, collect their stop losses, and then continue toward the actual direction.
Smart Money Trading Process:
1. Liquidity Formation
Retail traders place stop losses around previous highs, previous lows, support, and resistance zones. These areas become liquidity pools.
2. Liquidity Sweep (Stop Hunt)
Price breaks an important level, triggering retail orders and creating a false breakout. This move removes weak positions from the market.
3. Market Structure Confirmation
After liquidity is collected, traders should wait for confirmation:
CHoCH (Change of Character) – Early sign of possible reversal.
BOS (Break of Structure) – Confirmation of the new trend direction.
4. Institutional Entry Zone
Price returns to an important area such as:
Order Block (OB)
Fair Value Gap (FVG)
Premium & Discount Zone
This provides a more professional entry opportunity.
Professional Trading Model:
Liquidity Sweep → CHoCH → BOS → Retest → Entry → Target
Risk Management & Discipline:
A successful trader is not only focused on finding entries; protecting capital is the first priority.
Always define your risk before entering a trade.
Never risk more than you can afford to lose.
Use a proper Stop Loss based on market structure.
Avoid revenge trading after a loss.
Follow your trading plan with patience and discipline.
Wait for high-probability setups instead of forcing trades.
Final Lesson:
Retail traders usually react to price movement, but professional traders understand the reason behind that movement.
The goal is not to predict every move, but to wait for confirmation, manage risk, and execute with discipline
"Good analysis finds the opportunity. Risk management and discipline protect the results
XAUUSD H1: Is Gold Building a Bull Trap or a Launchpad?The strongest moves often begin when the majority starts feeling comfortable.
Gold has rallied aggressively after reclaiming liquidity below the previous range, but instead of accelerating higher, price is now compressing beneath resistance. This shift from expansion to consolidation is where the next meaningful clue usually appears.
What Catches My Attention
Rather than focusing on the recent breakout, I'm watching the quality of the pullback.
The chart shows an untouched Fair Value Gap (FVG) sitting below the current price, aligned with the mid-range retracement. This area represents unfinished business left behind during the impulsive rally.
As long as the market respects this imbalance, the broader bullish narrative remains intact.
Why I'm Not Chasing Highs
Buying after a vertical move often means accepting poor risk while relying on continued momentum.
A healthier market usually breathes before making another push.
If price rotates into the FVG and buyers quickly reclaim control, it would suggest that institutions are still accumulating positions rather than distributing them.
However, if the imbalance fails to attract demand, the correction could extend toward the ascending trendline and eventually the higher-timeframe Order Block before the larger trend resumes.
The Roadmap
📍 First area of interest: FVG retracement
📍 Second layer of support: Rising trendline
📍 Final defensive zone: Bullish Order Block
The reaction inside these zones will matter far more than the retracement itself.
The market isn't asking whether gold is bullish or bearish.
It's asking where buyers are willing to defend value.
If price revisits the FVG next, would you be looking for an immediate reversal, or would you wait for a clear confirmation before getting involved?
XAUUSD SMC Analysis | Liquidity & Market StructureThis XAUUSD analysis focuses on liquidity, market structure, and key institutional reaction zones. The 4365 BSL and 4080 SSL represent major external liquidity levels, while 4120 Supply and 4115 provide important areas for potential rejection or structural reaction. The primary objective is to wait for a liquidity sweep followed by clear BOS/CHoCH confirmation before determining the next directional move
XAUUSD: Bullish Structure Favors a Move Toward $4,430Hello everyone, here is my breakdown of the current XAUUSD setup.
Market Analysis
XAUUSD previously traded inside a broad descending channel before forming a strong base near the lower boundary. After several breakout attempts, price successfully broke above the channel resistance and reclaimed the 4,290 Support Zone, confirming a bullish shift in market structure.
Currently, XAUUSD is trading above the 4,290 Support Zone while remaining below the 4,430 Resistance Zone. The recent breakout from the consolidation range and the ascending trendline suggests that buyers remain in control despite the short-term pullback.
My Scenario & Strategy
As long as XAUUSD holds above the 4,290 Support Zone and respects the rising trendline, the bullish scenario remains valid. A successful retest of support could trigger another upward move toward the 4,430 Resistance Zone (TP1).
However, a breakdown below the 4,290 Support Zone would weaken the bullish outlook and increase the risk of a deeper correction.
That’s the setup I’m tracking. Thank you for your attention, and always manage your risk.
XAU/USD Masterclass | How to Measure Cycles and Predict Market
Gold Market Cycle Analysis | Time, Price & Trend Projection Masterclass
This advanced educational chart explains the professional approach of Gold market cycle analysis, where traders study the relationship between time, price movement, market rhythm, and previous historical patterns to understand possible future market behavior.
Every candle on the chart represents a specific battle between buyers and sellers. By studying candle formation, cycle length, price movement, and repeated market behavior, traders can identify potential turning points, continuation zones, and important market phases.
---
1. Cycle Measurement — Understanding Market Rhythm
The first step in cycle analysis is identifying a complete price movement from one major top to another major top, or from one important bottom to another important bottom.
Candle Explanation:
Starting Bullish Candles: Early bullish candles show increasing buying pressure and the beginning of a market expansion phase. Buyers gradually gain control as price starts creating higher levels.
Strong Expansion Candles: Large bullish candles indicate strong momentum and aggressive participation from buyers. These candles often appear when market demand increases.
Peak Formation Candles: Near the cycle top, candles become smaller and slower. This shows that buying pressure is weakening and sellers may start entering.
Reversal Candles: Bearish candles appearing after the peak indicate a shift in market control from buyers to sellers.
Decline Phase Candles: Continuous bearish candles create the next cycle movement, completing the relationship between previous high and future price behavior.
Reason: Markets often move in repeating cycles because trader psychology, liquidity, and institutional activity create similar patterns over time.
---
2. Cycle Shift — Time Projection Analysis
The second concept explains how a previous market cycle can be shifted forward to study possible future timing.
Candle Explanation:
Previous Cycle Candles: Historical candles show how price behaved during an earlier market phase.
Shifted Cycle Movement: The previous pattern is moved forward in time to compare possible similarities with current price action.
Matching Candles: When current candles start behaving similarly to previous cycle candles, traders watch for possible repeated reactions.
Turning Point Candles: Important candles near cycle completion can indicate possible reversal or continuation areas.
Momentum Candles: Strong candles after the cycle point show confirmation that the market direction is continuing.
Reason: Time cycles help traders understand when important market reactions may happen, but confirmation from price action remains necessary.
---
3. Time & Price Projection — Future Target Analysis
The final step combines previous cycle movement with price measurement to estimate possible future targets.
Candle Explanation:
Base Formation Candles: Small candles near a low area indicate accumulation, where buyers may slowly enter the market.
Breakout Candles: Strong bullish candles breaking previous resistance show increased demand and possible trend continuation.
Acceleration Candles: Large momentum candles represent aggressive buying and expansion.
Target Reaching Candles: As price approaches previous highs, candles may slow down because traders start taking profits.
Reaction Candles: Wicks and rejection candles near targets show where market participants are defending levels.
Reason: Price often reacts around previous cycle highs and lows because these areas contain liquidity and historical interest.
---
Gold Candle Psychology Analysis
Every candle provides important information:
Bullish Candle:
Shows buyers are stronger than sellers. The larger the body, the stronger the momentum.
Bearish Candle:
Shows sellers are controlling the market and pushing price lower.
Long Wick Candle:
Shows rejection. One side attempted to move price but failed.
Small Body Candle:
Shows uncertainty and balance between buyers and sellers.
Large Momentum Candle:
Shows institutional participation and strong market interest.
Repeated Candle Pattern:
Shows market psychology repeating through different cycles.
---
Professional Cycle Trading Framework
This chart teaches traders how to analyze:
Previous Market Cycles
Time-Based Price Movement
Historical Repetition
Trend Continuation
Reversal Possibilities
Support & Resistance Timing
Market Psychology
Future Price Projection
The purpose of cycle analysis is not to predict the market with certainty, but to understand where price has reacted before, how long movements usually last, and where important decisions may occur.
A professional trader does not only watch candles — they study the story behind every candle, the timing behind every move, and the psychology behind every market cycle.
Learn the cycle. Understand the movement. Master the market structure.
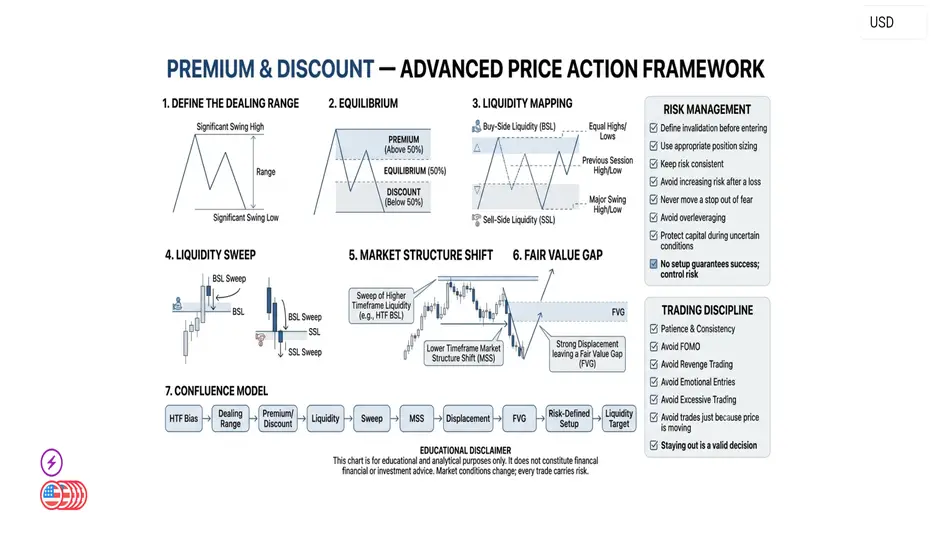
Premium & Discount: Advanced Market StructurePremium and Discount are used to evaluate where price is trading within a defined dealing range. This framework becomes more effective when combined with higher-timeframe structure, liquidity, displacement, Market Structure Shift (MSS), and Fair Value Gaps (FVG).
1. Define the Dealing Range
Start by identifying a clear and meaningful swing high and swing low. The range provides the framework for determining where price is trading relative to its equilibrium.
2. Equilibrium
The 50% level divides the dealing range into two sections:
• Above 50% = Premium
• Below 50% = Discount
• 50% = Equilibrium
The location of price alone should not be treated as an entry signal. Context and confirmation remain essential.
3. Liquidity Mapping
Identify important liquidity pools such as:
• Buy-Side Liquidity (BSL)
• Sell-Side Liquidity (SSL)
• Equal Highs
• Equal Lows
• Previous Session Highs/Lows
• Major Swing Highs/Lows
Understanding where liquidity may be located helps provide context for potential price reactions.
4. Liquidity Sweep
A liquidity sweep occurs when price temporarily trades through an obvious liquidity area before showing a potential shift in order flow.
A sweep by itself is not confirmation of a reversal. Additional structure and price-action confirmation should be considered.
5. Market Structure Shift
After a liquidity event, monitor the lower-timeframe structure for a potential MSS. A meaningful displacement through structure can provide stronger confirmation than a simple wick or temporary breakout.
6. Fair Value Gap
Strong displacement can leave an imbalance or Fair Value Gap. Traders may study these areas as potential reaction zones, but an FVG should not automatically be treated as a guaranteed entry.
7. Confluence Model
A stronger educational framework can be built around:
HTF Bias → Dealing Range → Premium/Discount → Liquidity → Sweep → MSS → Displacement → FVG → Risk-Defined Setup → Liquidity Target
The more independent pieces of confirmation align, the more structured the setup becomes.
Risk Management
Risk management remains more important than finding the perfect entry.
• Define invalidation before entering
• Use appropriate position sizing
• Keep risk consistent from trade to trade
• Avoid increasing risk after a losing trade
• Never move a stop simply because you do not want to accept a loss
• Avoid overleveraging
• Protect capital during uncertain market conditions
No setup has a guaranteed outcome. A high-quality setup can still fail, which is why risk must always be controlled.
Trading Discipline
Professional execution requires patience and consistency.
Avoid FOMO, revenge trading, emotional entries, excessive screen-time trading, and taking trades simply because price is moving. If the required conditions are not present, staying out is also a valid decision.
The objective is not to trade every move. The objective is to wait for a clear framework, execute according to the plan, and manage risk consistently.
Educational Disclaimer
This chart is created for educational and analytical purposes only. It does not constitute financial or investment advice. Market conditions can change rapidly, and every trading setup carries risk.