Chevron Corporation
No trades
No trades
Compare with Chevron Corporation
5.00 EUR
10.47 B EUR
157.12 B EUR
1.98 B
Next report date
—
Report period
—
EPS estimate
—
Revenue estimate
—
Details
Sector
Industry
CEO
Michael K. Wirth
Website
Headquarters
Houston
Founded
1879
IPO date
Jun 24, 1921
ISIN
US1667641005
CUSIP
166764100
FIGI
BBG000F5P129
Identifiers
ISIN US1667641005
Chevron Corp. engages in the provision of oil and gas energy solutions. It provides crude oil and natural gas, manufactures transportation fuels, lubricants, petrochemicals, and additives, and develops technologies that enhance business and the industry. It operates through the Upstream and Downstream segments. The Upstream segment consists of the exploration, development, and production of crude oil and natural gas, the liquefaction, transportation, and regasification associated with liquefied natural gas, the transporting of crude oil by major international oil export pipelines, the processing, transporting, storage, and marketing of natural gas, and a gas-to-liquids plant. The Downstream segment consists of the refining of crude oil into petroleum products, the marketing of crude oil and refined products, the transporting of crude oil and refined products by pipeline, marine vessel, motor equipment, and rail car, and the manufacturing and marketing of commodity petrochemicals and plastics for industrial uses and fuel & lubricant additives. The company was founded on September 10, 1879 and is headquartered in Houston, TX.
As $USO goes $CVX $XOM will followAMEX:USO is currently making a v-shape recovery back to it's previous highs. Unsure if it will return there but this is my idea.
If AMEX:USO can get above the 61.8% on the fib around $134, I would say yes. Have you missed the entire move? No as it still will track back towards $150 before it wil
Sell Side Institutions vs Buy Side Institutions
Sell Side Institutions are the Money Center Banks and Giant Financial Services companies such as JPM Bank and Goldman Sachs, the Giant Financial Services company. Sell Side are short term traders. Each Bank and Financial Services company has a huge floor of traders. They do not use AI to make tradi
Bearish potential detected for CVXEntry conditions:
(i) lower share price for NYSE:CVX along with continued lower highs and lower lows in the lagging indicator (green line) of the Ichimoku indicator, and
(ii) swing up of indicators such as DMI/ADX (bearish) and swing down in RSI, and
(iii) observe market reaction around the long-t
Chevron (CVX) is approaching a critical decision pointPrice is currently testing a key support level at $171.74, which corresponds to the high of Wave 1 from January. With CVX trading less than 1% above this level, the market is now at a pivotal stage for the broader wave count.
As long as support holds, the current structure continues to favor the co
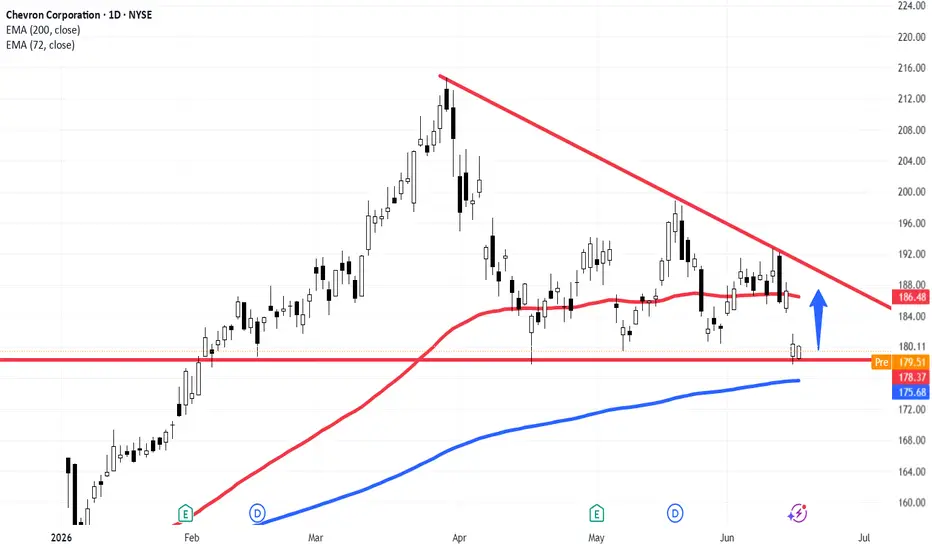
Chevron ($CVX) Daily: Testing Key Support – Mapping Risk Chevron ( NYSE:CVX ) Daily: Testing Key Support – Mapping Risk Profiles Near 200 EMA For Mean-Reversion Long
### 🛢️ Chevron Corporation ( NYSE:CVX ) Daily Technical Study (Ref: CVX_2026-06-17_11-53-39.png)
We are analyzing Chevron Corporation ( NYSE:CVX - NYSE) on the Daily (1D) timeframe, where
My #1 Gift For You --Buy This Stock NowThis stock is going to go up and here is why.
So about a week ago
this oil stock showed us a buy signal
and now it has bounced from the re-entry
It looks oversold
but this is now a short squeeze..
Now i must warn you
this strategy is a level 3
its the lowest trading strategy
but it will get yo
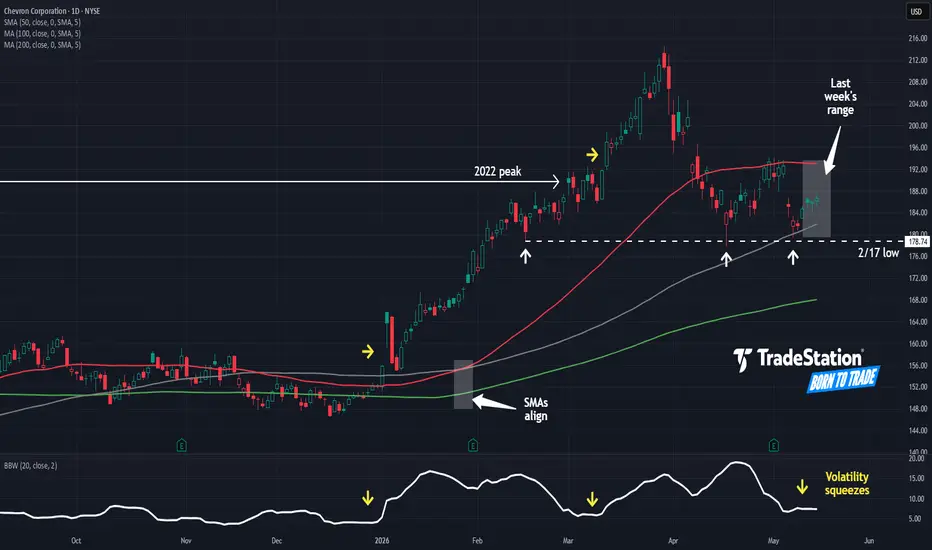
Chevron Squeezes Near Old HighsChevron has been squeezing near previous highs, and some traders may see further upside.
The first pattern on today’s chart is November 2022’s record peak of $189.68. The oil-and-gas giant paused below that level before breaking out last March. CVX pulled back near it without a significant move bel
CVX Chevron Corporation Options Ahead of EarningsIf you haven`t sold CVX before the retracement:
Now analyzing the options chain and the chart patterns of CVX Chevron Corporation prior to the earnings report this week,
I would consider purchasing the 200usd strike price Calls with
an expiration date of 2027-6-17,
for a premium of approximately $
See all ideas
Summarizing what the indicators are suggesting.
Neutral
SellBuy
Strong sellStrong buy
Strong sellSellNeutralBuyStrong buy
Neutral
SellBuy
Strong sellStrong buy
Strong sellSellNeutralBuyStrong buy
Neutral
SellBuy
Strong sellStrong buy
Strong sellSellNeutralBuyStrong buy
An aggregate view of professional's ratings.
Neutral
SellBuy
Strong sellStrong buy
Strong sellSellNeutralBuyStrong buy
Neutral
SellBuy
Strong sellStrong buy
Strong sellSellNeutralBuyStrong buy
Neutral
SellBuy
Strong sellStrong buy
Strong sellSellNeutralBuyStrong buy
Displays a symbol's price movements over previous years to identify recurring trends.
6.003% YTM
Maturity dateApr 1, 2047
Coupon5.80% (Fixed)
5.923% YTM
Maturity dateAug 12, 2050
Coupon2.34% (Fixed)
5.847% YTM
Maturity dateMay 11, 2050
Coupon3.08% (Fixed)
5.640% YTM
Maturity dateNov 15, 2044
Coupon5.05% (Fixed)
5.632% YTM
Maturity dateJan 15, 2040
Coupon6.00% (Fixed)
5.589% YTM
Maturity dateNov 15, 2043
Coupon5.25% (Fixed)
5.529% YTM
Maturity dateFeb 15, 2041
Coupon5.60% (Fixed)
5.498% YTM
Maturity dateMay 11, 2040
Coupon2.98% (Fixed)
5.465% YTM
Maturity dateAug 15, 2047
Coupon4.95% (Fixed)
5.221% YTM
Maturity dateMar 1, 2041
Coupon6.00% (Fixed)
5.109% YTM
Maturity dateApr 15, 2035
Coupon4.98% (Fixed)
See all CHV bonds
Weight0.43%
Market value9.96 B
Weight0.48%
Market value8.06 B
Weight15.07%
Market value5.75 B
Weight0.55%
Market value4.76 B
Weight0.55%
Market value4.33 B
Weight3.76%
Market value3.93 B
Weight1.17%
Market value2.98 B
Weight13.43%
Market value1.49 B
Weight1.27%
Market value1.23 B
Weight2.11%
Market value966.48 M
Weight0.55%
Market value880.88 M
Explore more ETFs
Frequently asked questions
The current price of CHV is 169.16 EUR — it has increased by 2.21% in the past 24 hours. Watch Chevron Corporation stock price performance more closely on the chart.
Depending on the exchange, the stock ticker may vary. For instance, on XETR exchange Chevron Corporation stocks are traded under the ticker CHV.
CHV stock has risen by 0.40% compared to the previous week, the month change is a 12.86% rise, over the last year Chevron Corporation has showed a 25.68% increase.
We've gathered analysts' opinions on Chevron Corporation future price: according to them, CHV price has a max estimate of 213.36 EUR and a min estimate of 149.27 EUR. Watch CHV chart and read a more detailed Chevron Corporation stock forecast: see what analysts think of Chevron Corporation and suggest that you do with its stocks.
CHV stock is 2.71% volatile and has beta coefficient of −0.51. Track Chevron Corporation stock price on the chart and check out the list of the most volatile stocks — is Chevron Corporation there?
Today Chevron Corporation has the market capitalization of 325.95 B, it has increased by 2.30% over the last week.
Yes, you can track Chevron Corporation financials in yearly and quarterly reports right on TradingView.
Chevron Corporation is going to release the next earnings report on Jul 31, 2026. Keep track of upcoming events with our Earnings Calendar.
CHV earnings for the last quarter are 1.22 EUR per share, whereas the estimation was 0.87 EUR resulting in a 40.86% surprise. The estimated earnings for the next quarter are 4.86 EUR per share. See more details about Chevron Corporation earnings.
Chevron Corporation revenue for the last quarter amounts to 42.07 B EUR, despite the estimated figure of 44.89 B EUR. In the next quarter, revenue is expected to reach 54.92 B EUR.
CHV net income for the last quarter is 1.91 B EUR, while the quarter before that showed 2.36 B EUR of net income which accounts for 0.00% change. Track more Chevron Corporation financial stats to get the full picture.
Yes, CHV dividends are paid quarterly. The last dividend per share was 1.53 EUR. As of today, Dividend Yield (TTM)% is 3.72%. Tracking Chevron Corporation dividends might help you take more informed decisions.
Chevron Corporation dividend yield was 4.49% in 2025, and payout ratio reached 103.22%. The year before the numbers were 4.50% and 67.08% correspondingly. See high-dividend stocks and find more opportunities for your portfolio.
As of Jul 30, 2026, the company has 43.04 K employees. See our rating of the largest employees — is Chevron Corporation on this list?
EBITDA measures a company's operating performance, its growth signifies an improvement in the efficiency of a company. Chevron Corporation EBITDA is 34.78 B EUR, and current EBITDA margin is 19.98%. See more stats in Chevron Corporation financial statements.
Like other stocks, CHV shares are traded on stock exchanges, e.g. Nasdaq, Nyse, Euronext, and the easiest way to buy them is through an online stock broker. To do this, you need to open an account and follow a broker's procedures, then start trading. You can trade Chevron Corporation stock right from TradingView charts — choose your broker and connect to your account.
Investing in stocks requires a comprehensive research: you should carefully study all the available data, e.g. company's financials, related news, and its technical analysis. So Chevron Corporation technincal analysis shows the strong buy rating today, and its 1 week rating is buy. Since market conditions are prone to changes, it's worth looking a bit further into the future — according to the 1 month rating Chevron Corporation stock shows the strong buy signal. See more of Chevron Corporation technicals for a more comprehensive analysis.
If you're still not sure, try looking for inspiration in our curated watchlists.